PO Box 9491
San Diego, CA 92169
858-273-5900
 Tiger's
Power-Stock-Ranker Software
with automatic Buy-Sell Signals
on the Screen
 Tiger
Software systematically screens 7,000+ stocks for signs of big money accumulation.
We post the top 1% on our TIGER BBS and on this web site. This is our ELITE STOCK PROFESSIONAL (ESP) Service.
Tiger
Software systematically screens 7,000+ stocks for signs of big money accumulation.
We post the top 1% on our TIGER BBS and on this web site. This is our ELITE STOCK PROFESSIONAL (ESP) Service.
Users of our software download the ESP list and follow these stocks closely with the data on their own computer. They typically get their own data from Dial Data or TC-2000.
They then run our Power-Stock-Ranker automatic
ranking/flagging and BUY/SELL signaling software against these the most heavily
accumulated stocks. Our in-house Accumulation Scanning saves them hours and hours of time
fishing for new stock ideas. They can devote their energies to timing the purchase and
sale of these high accumulation stocks.
In the charts below you see TIGER's proprietary
Accumulation Index plotted underneath the price charts.
We consider: how positive (or negative) the indicator currently is, its 100-day and
250-day integral, and extreme divergences from price action.
Our customers confirm that the Accumulation Index is the most important measure of internal strength of a stock.
Our remarkable indicator tells us who is buying and and who is selling the stock. We want to own stocks that Smart Big Money is buying. "Smart Big Money" is far-sighted, and won't sell quickly on a small rally. They have a vision about where the stock will be in a year or two, and they are carefully buying it on all dips. Such a stock is tightly held and can sometimes shoot up rapidly when the word gets out about the company. By buying the most heavily accumulated stocks on dips back to the 21-day moving average or on the automatic BUY signals, our TIGER users can easily make more money and they can reduce risk.High accumulation tells us that there is probably a cushion of big money buying interest just underneath the current prices. Knowing this gives us peace of mind. Instead of panicking when prices start to slide in these stocks, we buy more just the the Big Boys do.
We can readily prove to you how well this indicator works.
Just look at the track record of buying only the top Accumulated stock in the DJI at the end of each quarter- starting in 1970. Blindly holding these stocks 21 months and then buying the new number#1 accumulated DJI stock would have gained you 26% per year over a 26 year period. This study has been frequently replicated. You can do it, too. But most important, it shows how good our TIGER Accumulation Index really is. The TIGER Accumulation Index techniques work even better and more dramatically with volatile high tech stocks. And they work in reverse. Steady big money distribution usually leads to much lower stock prices. Below are some High Tech charts which showed intense accumulation early in their price rise and then steadily positive levels.This is typical of a NASDAQ high tech stock that will double or triple. You will see how easy it was to make money with them, simply buying them at their 21-day moving average or when automatic buy signals appear. The only trick was identifying them early in their move. And this is the function of TIGER's Elite Stock Professional Report.

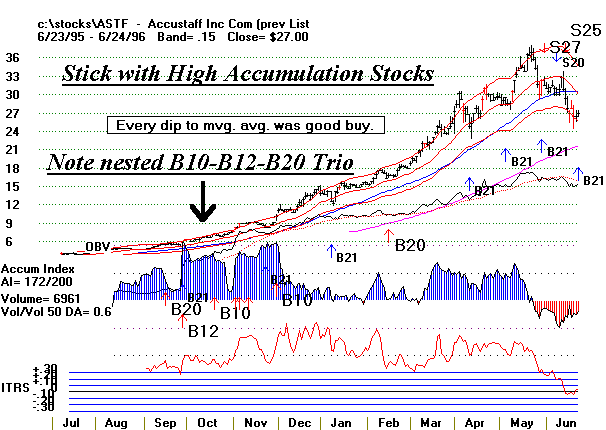
In the chart above you will note the HOLX showed very high levels of accumulation throughout its long rise. The high accumulation also was very apparent 6 months earlier than that shown above, Note the automatic BUY B12. This is our most important BUY signal. The B10's and B20's are also major BUYs. The B21 is a pullback BUY signal that works very nicely with high accumulation stocks. Now look at ASTF. Neither stock is a household name. They were screened out of more than 11,000 stocks. You will see exactly the same characteristics and signals, all foretelling a big price rise.
. Click here for chart of ASTF
In these charts you will see how well having a consistently high level of Accumulation, using TIGER's proprietary indicator, predicts future price rises in the stock. Year after year, we have found that the single best predictor of the best moves on the stock market is our automatic "BUY B12". For a stock to achieve a B12 it must show intense accumulation. It must also have an "ITRS" reading above +.3. The "ITRS" is a second proprietary measure of the stock's strength or weakness. You will also see in the charts below "B10" buy signals. These are also major BUY signals, but they work best when a B12 occurs nearby or on the same day. The very best situations have an automatic "BUY B12", a "BUY B10" and a "BUY B20". The B20 is another proprietary indicator. It measures a stock's velocity.
Look at the incredibly high levels of accumulation in FA below.
Its high accumulation made it a stand-out BUY on all dips back to its 21-day moving average. These are marked as "B21" buy signals automatically. Please note that all the signals shown occurred on the same day they are displayed for. In addition, these principles have been used by our customers for more than 10 years. Click here for chart of FAIRCHILD When do we buy a stock that shows steadily positive accumulation readings? We buy it when we get an automatic BUY signal. One of the easiest to employ methods is to buy the high accumulation stock on all dips to its 10 or 21-day moving. average. Which moving average you use would depend on the stock's velocity, the market's overall strength and how risk averse you are. The 21-day moving. average is safer and very reliable. The main point to be made is that Very High Accumulation stocks seem always to have a cushion of support from Big Buyers. Instead of panicking on a decline, we use it to take our follow-up positions.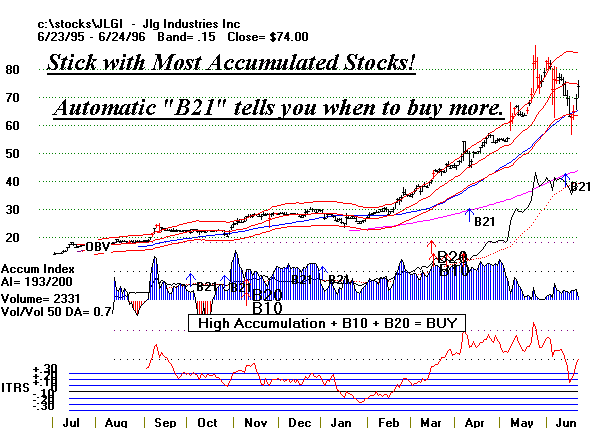 Click here
for chart of JLGI
Click here
for chart of JLGI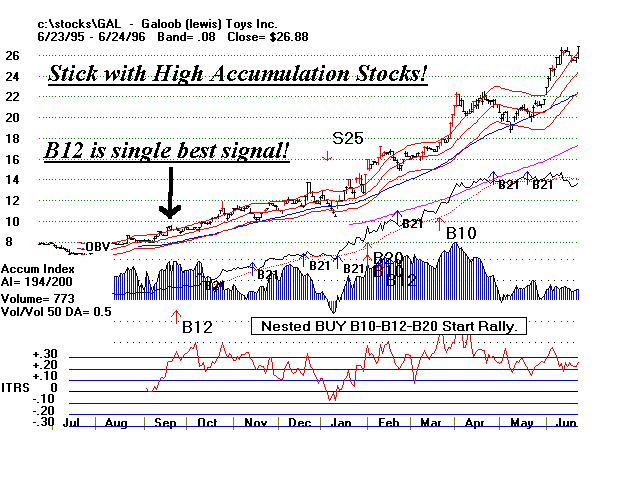 Click here for chart of GAL
More information about Tiger's Power-Stock-Ranker Software
More information about the Elite Stock Professional Report