1.
Major Peerless Sell Signals
Peerless is a software program I wrote back
in 1981. I used to travel
around the
Southwest with an Apple
II-plus, putting on seminars in brokers' office and selling
a book and software for $250.
Twenty six years later, the very same major signals
that I had discovered then
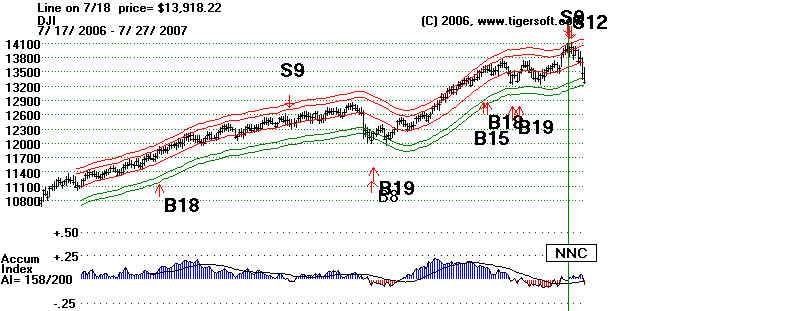
still work. On July 17th this year, just eight trading days
ago, Peerless gave an
automatic major Sell "S9" and Sell "S12". Compare the
recent major Sell signals
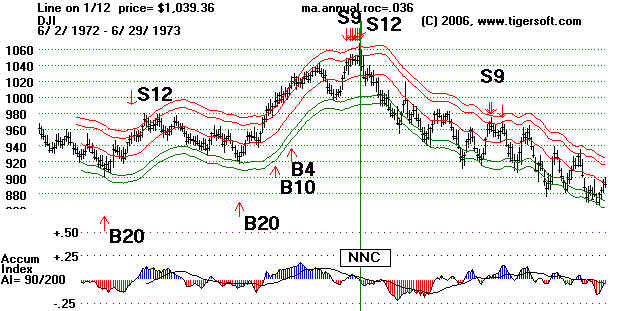
with what occurred in January 1973. Exactly the same
algorithms called the top in
January 1973, not long before oil prices shot through
the roof because of the oil embargo, a year before Nixon
was impeached and a year
before Congress refused to
keep funding the US war in Viet Nam, and 18 months
the DJI fell from its high of
1050 to 580, a decline of more than 40%. There are some
technical defferences, but
the similarities are clear-cut and the historical parallels
eye-opening.
This is our "bread and
butter", so I can't tell you what it is based on, until you buy
our program, but compare the
top in January 1973, shown first, with the apparent
top eight trading days ago,
shown second. Buy our software and we'll show you
how to call these tops better
than you ever imagined possible.
January 1973 Top
 |
July 2007 Top?
 |
What Should You Do When You Get A Major Sell?
The first thing to do is to use the Peerless Help Routine and see how accurate
and powerful the particular
signal is. Doing this, we see that there have been 194 days
when an "S9" signal
occurred beteeen 1965 and 2007. The average DJI drop at the time of
the next major Peerless Buy
is 5.3%. That might not seem like a lot, but it is impressive
when you realize these are
Sell signals and the DJI rose from 800 to 13200 in this period.
71.8% of the them brought
declines at the time of the next major Peerless Buy signal.
There was a simultaneous
"S12" major Sell at the 14000 top recently. Looking up the
S12's track record, we see
there have been 58 of them up to mid 2006. These averaged
a drop of 6.1% at the time of
the next major Peerless Buy. 79.7% of them were profitable.
You could also study these
results and see how "S9" and "S12" signals do in Julys and we
can also take the first
occurrence if there is a cluster of days with "S9" signals. When we do
that
we see only 2 earlier July
cases where there was a simultaneous "S9" and S12" as we just saw.
In both cases, these S9-S12
Sell signals took place as the DJI made a new all-time high
and fell 15%
S12
7/16/1970 - This was at the end of the 1969-1970 bear
market. It does not really
match
the current situation, where we have had an on-going bull market. The
DJI
fell in this case 1.9%, at which time Peerless gave a major Buy.
S12
7/17/1978 - The DJI disregarded this Sell signal and
rose 5.7% before Peerless
gave
a reversing Buy Signalfell in this case 1.9%, at which time Peerless gave a major Buy.
S9
7/12/1982 - This was at the end of the 1981-1982 bear market. So it does
not really apply. The DJI fell 5% from 825 to 780, But on 8/17/2007 Peerless
gave a major Buy and the 1982-1983 bull market started.
S9/S12 7/13/1990 - This was at
an all-time high. There also was a "Sell S12" here.
The DJI fell immediately and sharply, reaching a mini-bear market bottom in
October with a major Peerless Buy signal. At that point
the DJI had falled
15.6%. This was at the time Iraq invaded Kuwait.
.
S9/S12 7/8/1998 - This was at
an all-time high. There also was a "Sell S12" here.
The DJI fell immediately and sharply, reaching a mini-bear market bottom in
October with a major Peerless Buy signal. The DJI had
by thrn falled 15.2%.
S12
7/6/2006 - This signal was over-ridden by a previous
NASDAQ buy that is so
powerful
that it cancels Peerless Sells for 3 months. The DJI in this case did
fall
to the lower band. This signal also occurred on a rebound after a sell-off,
and
so does not really apply.
What does it take to
reverse a Peerless Major Sell. If the DJI bounced off
the support at 13200
tomorrow, will it be a good place to buy?
Our
studies show that the lower band is reached about 80% of the time after
either an S9 or S12.
When they both occur simultaneously, the DJI has always reached
the lower
band. But the odds heavily favor a break-down.
So
will there be a significant bounce from the lower band? Usually that is
where professional buyers do
come in. But how tightly will they hold if prices
start to weaken again.
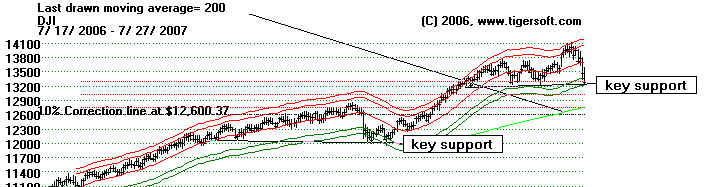
The key question the markets will face next week is
whether the well-tested
support seen at 13,200 on the DJI will hold. You might
want to compare the support
at 13,200 with the support that held in March at
12,000. We pay
attention to key moving averages. A 200-day moving average
is shown in the chart below.
We monitor percentage retracements, too. A 10%
correction would bring the
DJI back to 12,600. That level is important because it
also coincides with the
200-day moving average.
Until
Peerless gives a major Buy signal, we have to advise great caution. Traders
can watch the market
intra-day and play a support level like we see at 13,200. But investors
should wait for Peerless to
give a Buy signal.
Our nightly Hotline - $298/year - discusses these
and many other nuances,
such as foreign markets, the
way the US markets behave in the second half of years
that end in "7",
what is portended by the history of combined "S9+S12" signals
at all-time highs portend and what
to watch for from Crude Oil, foreign currencies
and metals, as well as US housing,
REIT, real estate and bank stocks.
2. Using
ETFs To Short The Market
You
don't have to go short the market to make money ina declining market. And
you can use the vehicles decribed
below to hedge and protect profitable long positions
you wish to hold, perhaps for tax
reasons. Four of the newer ProShares ETFs allow
investors
to get short exposure to a stock
index without having to set up margin accounts or
worry about margin calls:
Some of these vehicles are:
Short
QQQ ProShares (PSQ)
Ultra-Short QQQ (QID)
Short S&P500 ProShares (SH)
Ultra-Short S&P500 (SDS)
Short Dow30 ProShares (DOG )
Ultra-Short Dow (DXD)
DXD,
DIA, SDS, SPY, QID, QQQQ 1-yr chart:
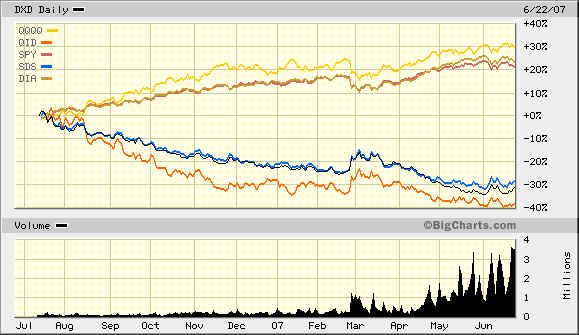
(Source:
http://etf.seekingalpha.com/article/39285
)
---------------------------------------------------------------------------------------------------------------------------
Watch
those Interest Rate Charts:
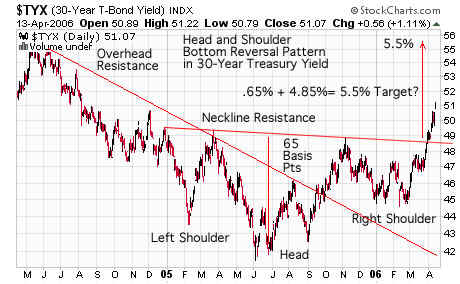
-----------------------------------------------------------------------------------------------------------------------
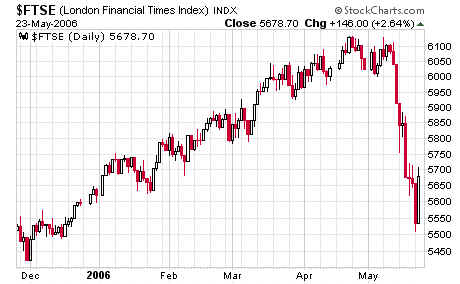
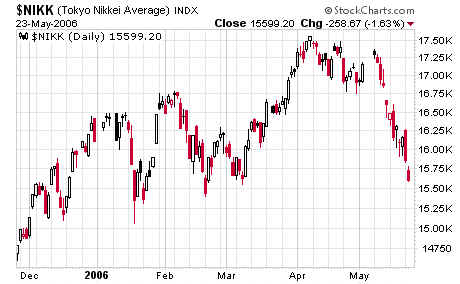
3.
Will Foreign Markets Escape The Down-Draft of the Peerless S9/S12?
They
did not after the May 5th, 2006 S9.
England's FTSE crashed 550 points, or 9
percent:
Japan's
Nikkei, down 1,900 points, or 10.8 percent:
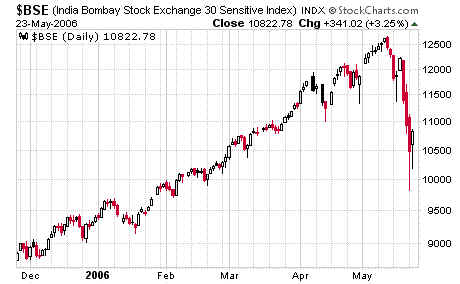
Emerging
markets experienced the most dramatic slide.
India's Sensex Index, suffered a crash, dropping 2,500 points, or 20
percent after
the
Peerless S9 of May 5, 2006..
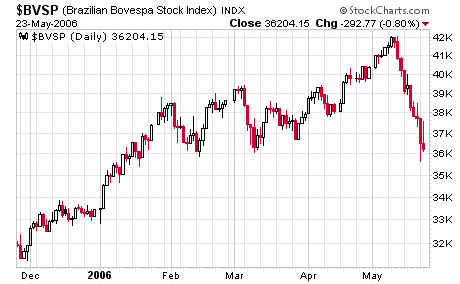
Brazil's Bovespa, down 6,000 points, or 14 percent:
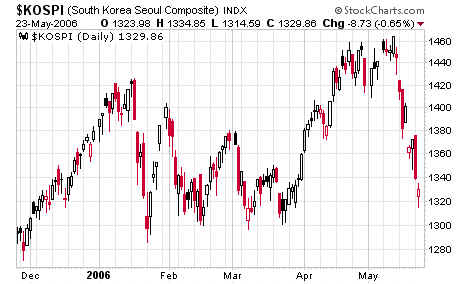
The Korean Seoul Composite, fell 140 points, or 9.5 percent:
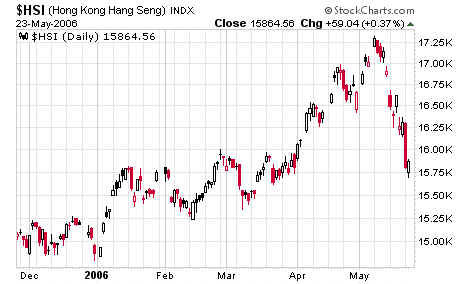
The Hong Kong Hang Seng Index, down 1,550 points, or 8.9
percent:
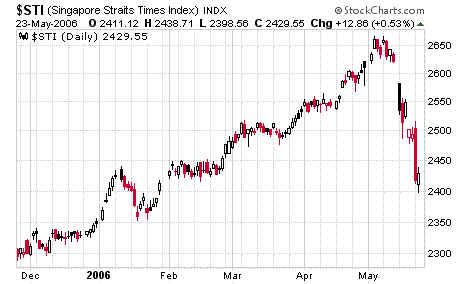
Singapore's
Straits Times Index, down 250 points, or 9.4 percent:
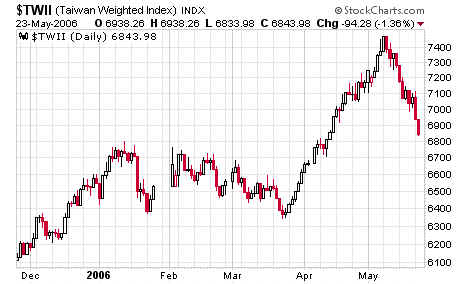
Taiwan's Weighted Index, fell 700 points, or 9.3 percent:
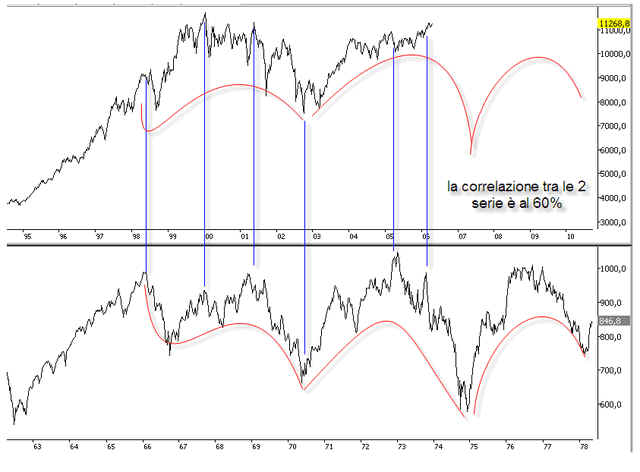
4. An Eerie Paralel:
Something
to think about.
Barry
Ritholz, of The Big Picture Blog, created a post comparing the
present with 1973-74 cycle,
using
a chart to show that today's Dow is following the 1970's Dow's pattern with an eerie
correlation.
If
the comparison holds true, 2007 is similar to 1973, a year that marked the start of an
18-23 month
bear
market that finally ended with a 40 percent loss. Here is his chart:
.
|