The Terrible Happens.
Should
You Panic with Your Investments?
Five
Case Studies: 1915, 1941, 1957, 1963 and 2001
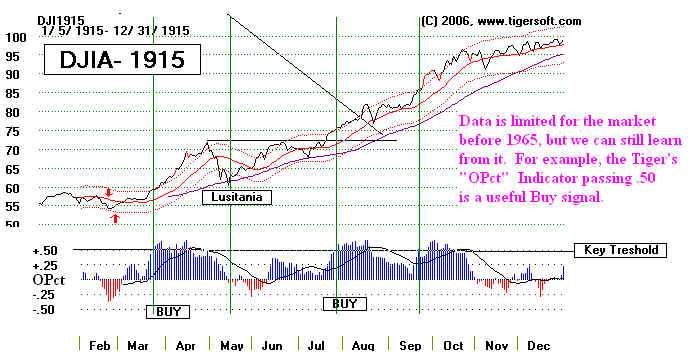
1915 - Sinking of
Lusitania.
http://home.pacbell.net/steamer/lusita.htm
(Editor's
note: This would seem to make as good a movie as the sinking of the Titanic.
But like Steinbeck's best
novel, "In Dubious Battle", Hollywood does not want to touch the
issues raised here.)
Say, for example, you are an
investor back in 1915. The US has stayed neutral
in the European War,
but then the passenger liner Lusitania is sunk by a German
submarine with the loss
of more than 1100 people, including 112 Americans. Surely,
this means the US will
be thrown into the bloody war. Should you sell all your stocks.
Here
is the Tiger chart of the year 1915. Technical analysis usually wins out over
heeding "raw
emotions". That was as true in 1915 as it is today. The DJI held at its
long-term moving
averages and rallied with very positive readings from Tiger's volume
tools.
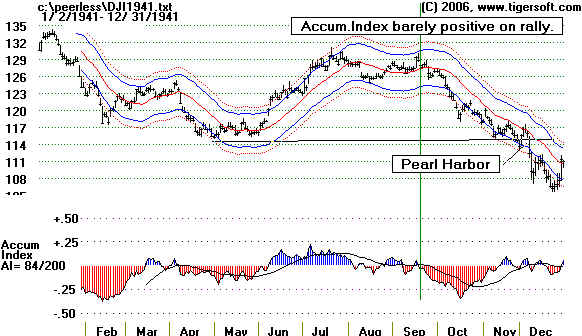
Japanese Attack on Pearl Harbor - December 7, 1941
(See
http://www.american.edu/TED/ice/japan-oil.htm)
The DJI and the
US stock market was already in a decline after mid-1941. In July 1941
the US had imposed an oil embagro on Japan.
Those who followed international developments
knew that the US would not be able to escape
World War II for very much longer. Japan's
imperial ambitions depended upon oil. (The same
is still true. For the US to be the pre-eminent
power in the world, it needs more and more oil.
Hence, Bush's war on Iraq.)
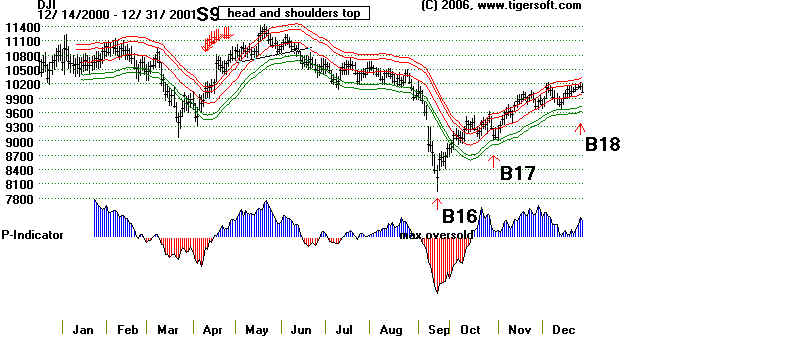
Tiger
"Accumulation Index weakened in September 2001, so that its readings were barely
positive as the DJI came close to tagging the
upper band zone we use. The breaking below
the 125 lows of August were confirmed by
Tiger's volume indicators making corresponding new
lows.
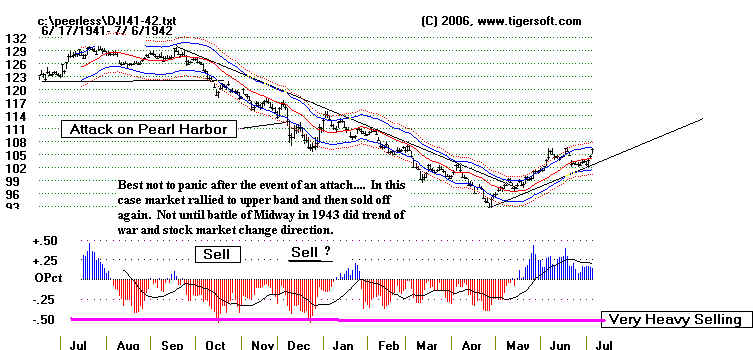
Not
until the Battle of Midway in May 1943 Did The Market Turn Upwards.
The
DJI's downtrend-line here was very well-tested. That made its upside violation
very
significant technically. Note how the Accumulation Index turned positive.
The
tide of war had turned, and with it the US stock market.
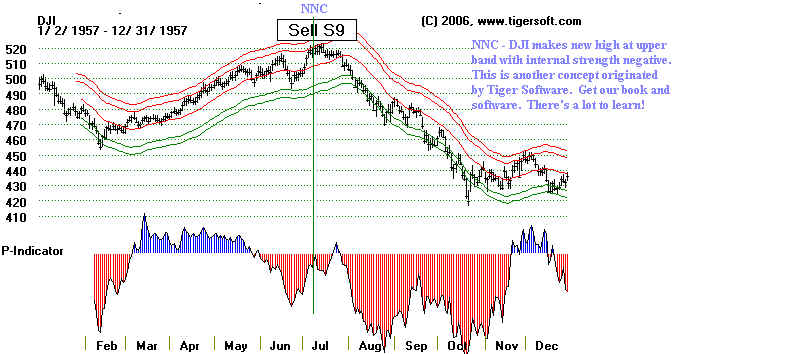
1957
- 'Sputnik" Bear Market
Peerless
sytem easily called the top in October 1957, just before the DJIA
fell 20%. "Someone
always knows." Use Peerless and buy when others are panicking.
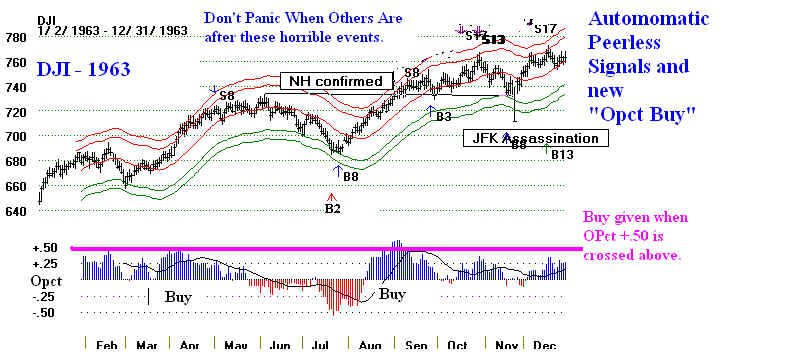
1963
- JFK Assassination
Would you have panicked
when President Kennedy was assassinated? Not a good idea.
The next day the market was up strongly. Of course, much of
American business was holtile
to Kennedy. Still, at first it seemed Oswald was a CIA
assassin.
9-11-2001 Attack
The
market was closed for more than a week after the attack of early 9/11/2001.
The attack took place before
the market had opened. It had closed at 9605.51 the day
before the attack. 10
days later, on 9/17, it opened down about 600 points and then fell
another 1000 more beofre
reversing intra-day on 9/21. Our Peerless chart gave a major
Buy on this day. The
DJI was as oversold as it has been at the bottom of the October 1987
Crash. The Peerless major Buy
B16 on 9/21/01 reversed the major Sell from the beginning
of the year.
|
| Dow Jones Performance After Major U.S. National Security Events |
| Event |
Date |
% Change for Daya |
6-Months Later |
1-Year Later |
| aIf the event occurred after the U.S. market closed or on a
non-trading day, the % change for day reflects the next trading day's activity. |
| SOURCE: Dow Jones web page. |
| Terrorist Attack |
09/11/01 |
-7.12% |
10.47% |
-10.66% |
| Oklahoma Bombing |
04/19/95 |
0.68% |
14.92% |
32.46% |
| WTC Bombing |
02/26/93 |
0.17% |
8.41% |
14.07% |
| Operation Desert Storm |
01/16/91 |
4.57% |
18.73% |
30.14% |
| Panama & Noriega |
12/15/89 |
-1.53% |
7.17% |
-5.32% |
| Reagan Shot |
03/30/81 |
-0.26% |
-14.56% |
-17.12% |
| Vietnam Conflict |
02/26/65 |
-0.41% |
-0.81% |
5.48% |
| Kennedy Assassination |
11/22/63 |
-2.89% |
12.04% |
21.58% |
| Sputnik Launched |
10/04/57 |
-2.01% |
-4.59% |
15.60% |
| Korean War |
06/25/50 |
-4.65% |
2.36% |
9.34% |
| Pearl Harbor |
12/07/41 |
-3.50% |
-9.48% |
-1.37% |
| Lusitania Sinks |
05/07/15 |
-4.54% |
36.01% |
| Dow Jones Performance After Major U.S. National Security Events |
| Event |
Date |
% Change for Daya |
6-Months Later |
1-Year Later |
| aIf the event occurred after the U.S. market closed or on a
non-trading day, the % change for day reflects the next trading day's activity. |
| SOURCE: Dow Jones web page. |
|
There's more coming in my book on the stock market since 1915 using the
perspective of Peerless
Stock Market Timing. Stay tuned.
.
|