wpe1E.jpg (33803 bytes)

         Daily Blog - Tiger Software

      >>>   Momentum Trading.  Does It Work?
           Yes... But it's a lot easier and safer with
           Peerless and Tiger.

                              July 17, 2007

    
William Schmidt,     - Tiger Software's Creator
      (C) 2007 William Schmidt, Ph. D.  - All Rights Reserved. 

      No reproductions of this blog or quoting from it
      without explicit written consent by its author is permitted.

     
Back to Home Page - www.tigersoft.com

__________________________________________________________________

     Send any comments or questions
      to william_schmidt@hotmail.com

                      
           Momentum Trading.  Does It Work? 
           "Yes", If You Use Peerless,TigerSoft and Get Our Books.

        Four months ago Tiger Software published a report on the top performing stocks from
   July 2006 to February 22, 20076. Here we see what has happened in the last 5 months (101
   trading days) to all those stocks that were up at least 125%.  This gives a sample of 40 stocks.
   It might be considered that any stock that was up more than 125% had accomplished a lot
   technicially, in moving up past the point where simple Sell-after-A-Double prifit-taking would
   have occurred.
 
       Below is a table showing the ranking of the percent gans of these stocks.  They all had
   risen at least 125% from July 2006 to February 22, 2007.  16 of the 41 rose more than 20%,
   but 18 lost money in a rising general market.  Clearly, simply buying the best performing
   stocks is risky.  So, what do you do?  In a word, TigerSoft.   Use our books and software.  They
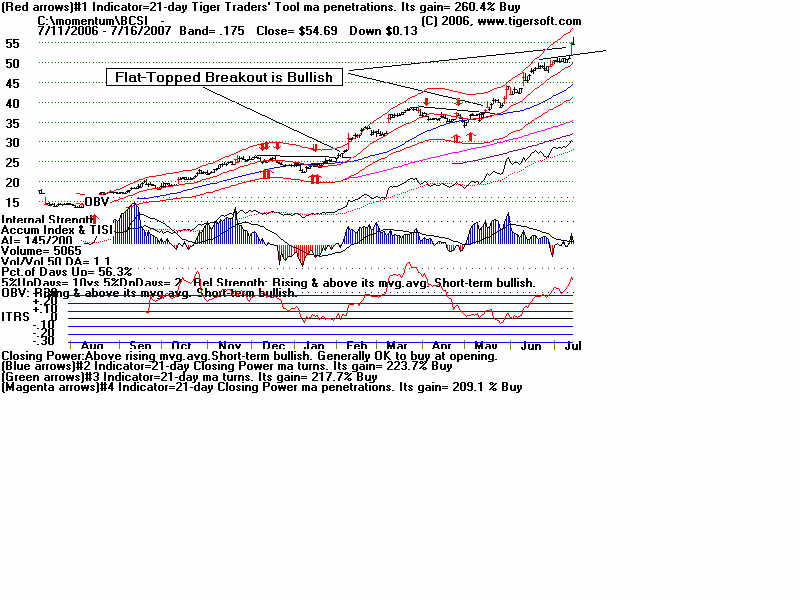
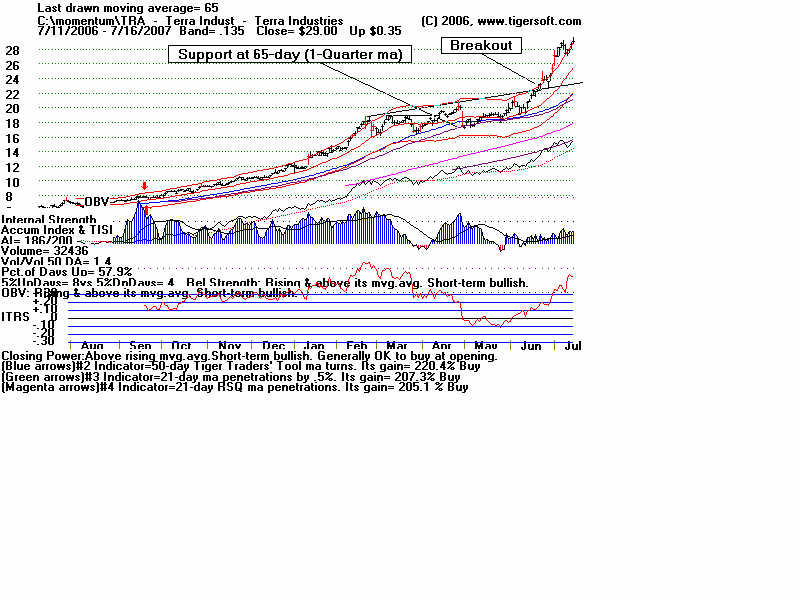
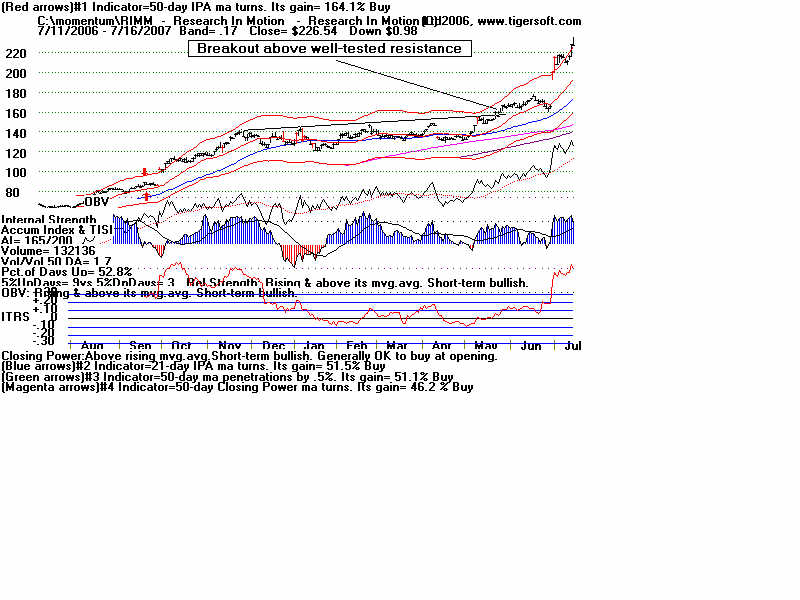
   show you which stocks to buy and own and which to sell.  Look at the shcarts of the best performing
   stocks and see the notes I have added.  Compare them with the poorest performing "ex-momentum"
   stocks. 
 
C:\momentum   Days back= 101 
 2 / 20 / 2007 - 7 / 16 / 2007 
Rank          Symbol        Name                       Price          Pct.Gain     
---------     ----------------------------              -------       ----------     
 1            BCSI          ---                          54.69         67%                     
 2            TRA           Terra Industries             29            63%                      
 3            RIMM          Research In Motion Ltd.      226.54        59%                      
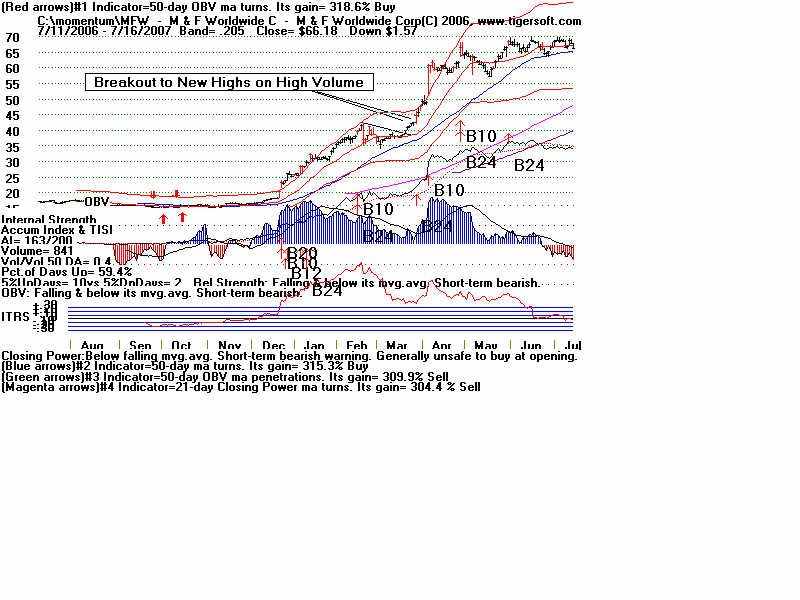
 4            MFW           M & F Worldwide Corp.        66.18         58%           
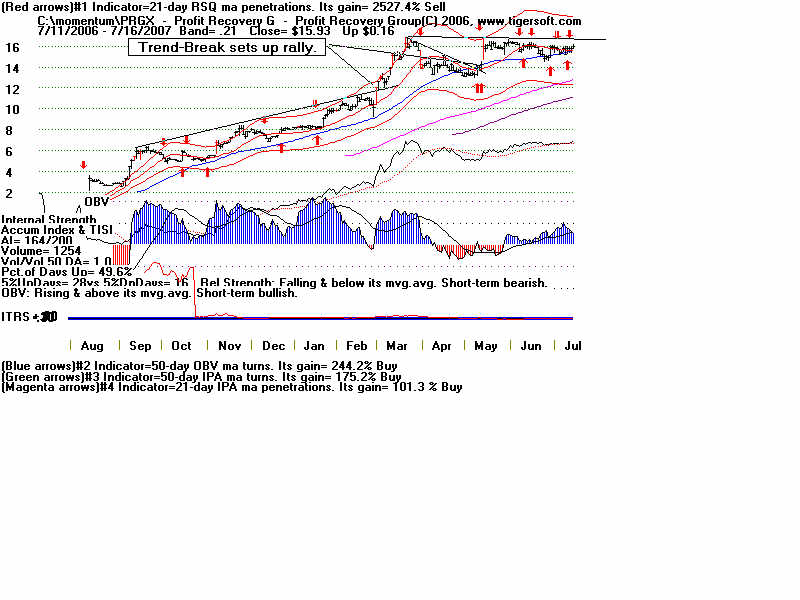
 5            PRGX          Profit Recovery Group        15.93         46%                 
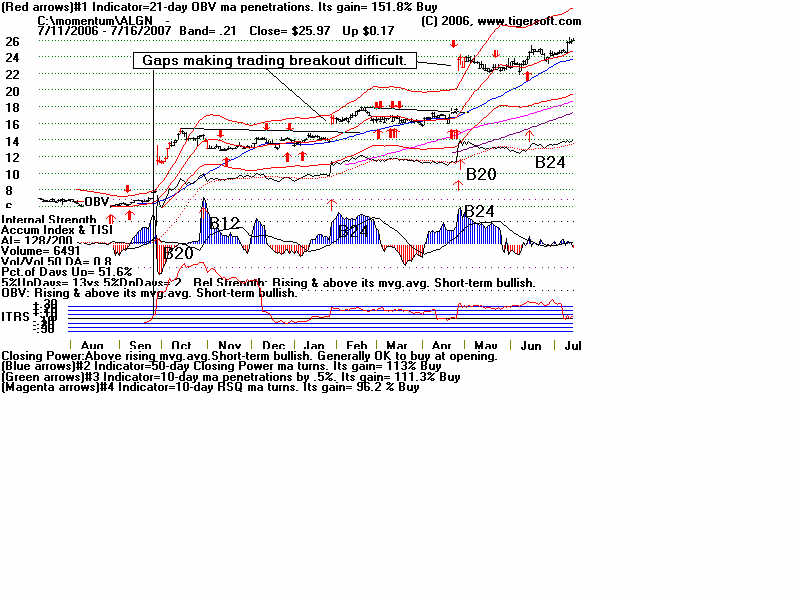
 6            ALGN          ---                          25.97         45%                      
 7            CEA           China Eastern Airlines       49.1          43%             
 8            TRT           Trio-Tech International      22.19         37%              
 9            CCOI          ---                          32.31         33%               
 10           VDSI          VASCO Data Security Int'l    24.43         32%           
 11           TVL           ---                          18.94         31%            
 12           ZNH           China Southern Airlines      32.8          26%                  
 13           CHDX          US-China Industrial Exch.    25.9          25%                       
 14           REFR          Research Frontiers           13.36         25%                       
 15           DLX           Deluxe Corporation           41.25         24%             
 16           JADE          LJ International             12.35         23%                 
 17           MICC          Millicom Int'l Cellular      97.05         19%            
 18           LFL           Lan Chile S.A.               85.21         14%               
 19           POZN          ---                          19.21         12%              
 20           SIGM          Sigma Designs                30.57         11%                
 21           MWP           ---                          59.02         2%                    
 22           SPAR          Spartan Motors               16.4          1%             
 23           TBWC          ---                          24.69         0%               
 24           IGLD          ---                          13.99        -3%           
 25           JST           Jinpan International LTD     20.61        -4%               
 26           ACY           Aerocentury Corporation      18.25        -5%          
 27           TTEC          TeleTech Holdings Inc.       31.8         -6%          
 28           SRSL          SRS Labs                     11.25        -11%         
 29           ACP           Amer. Real Estate Partner    97.7         -17%         
 30           ACOR          ---                          20.4         -18%         
 31           TATTF         TAT Technologies Ltd.        20.94        -18%         
 32           DIT           ---                          22.05        -19%         
 33           VPHM          ViroPharma                   14.5         -20%         
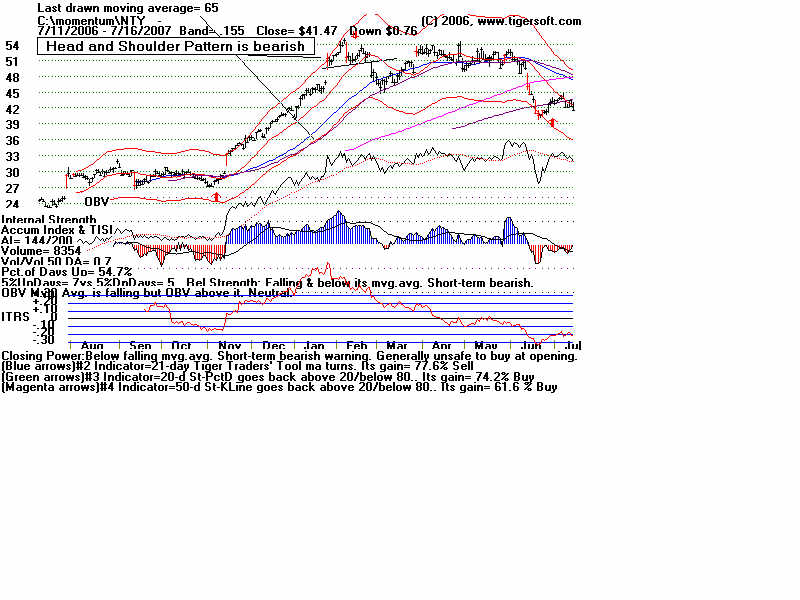
 34           NTY           ---                          41.47        -23%         
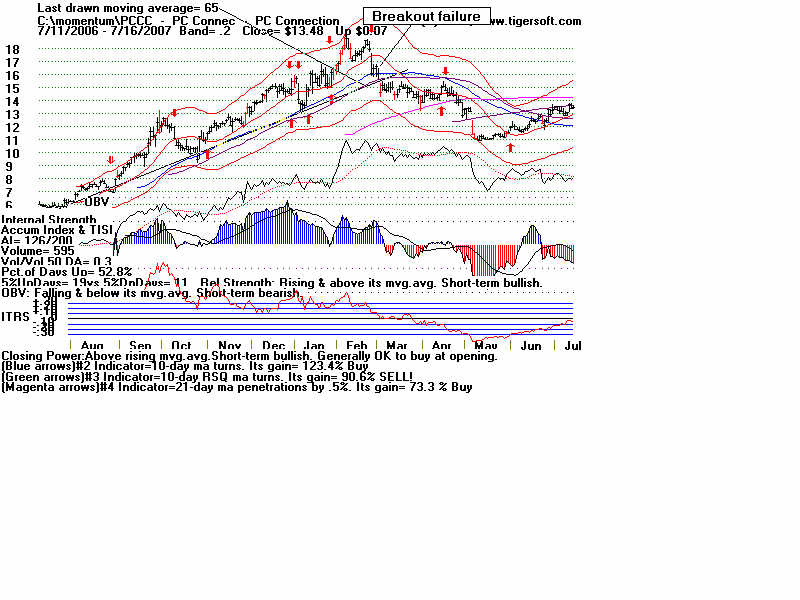
 35           PCCC          PC Connection                13.48        -24%         
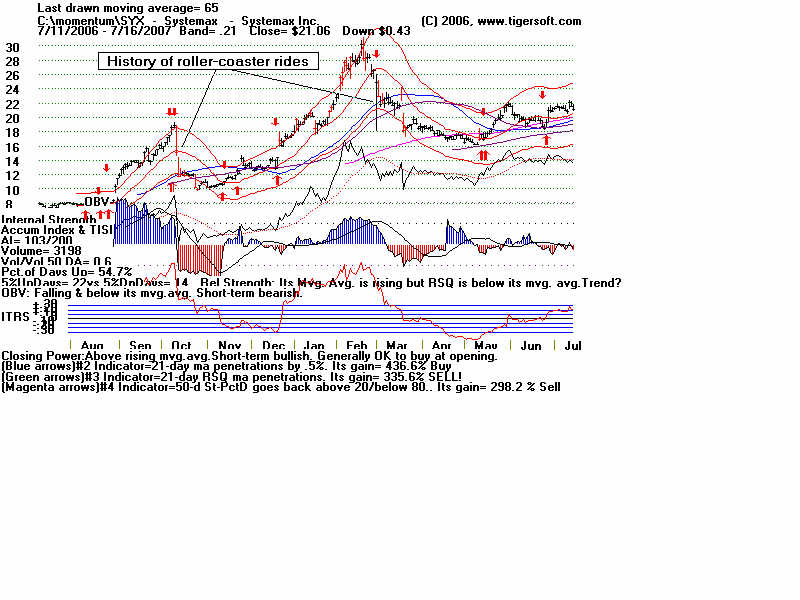
 36           SYX           Systemax Inc.                21.06        -31%         
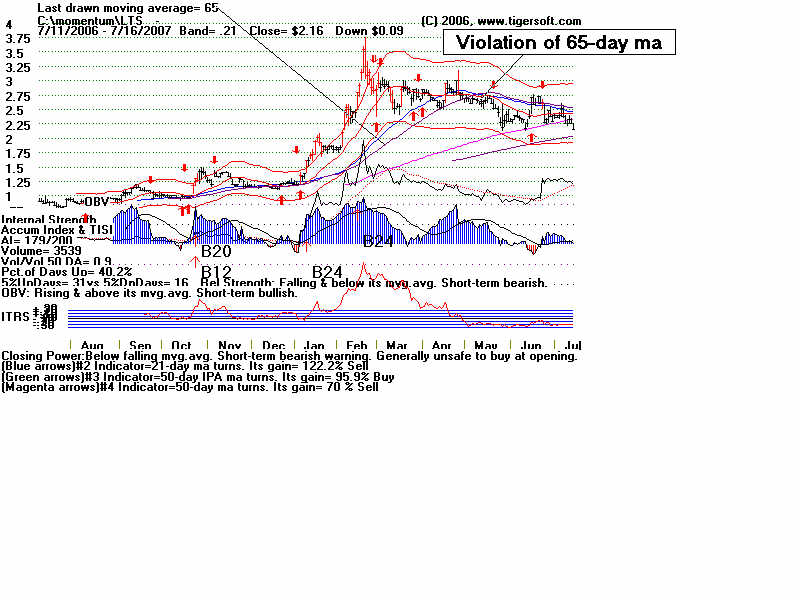
 37           LTS           ---                           2.16        -32%         
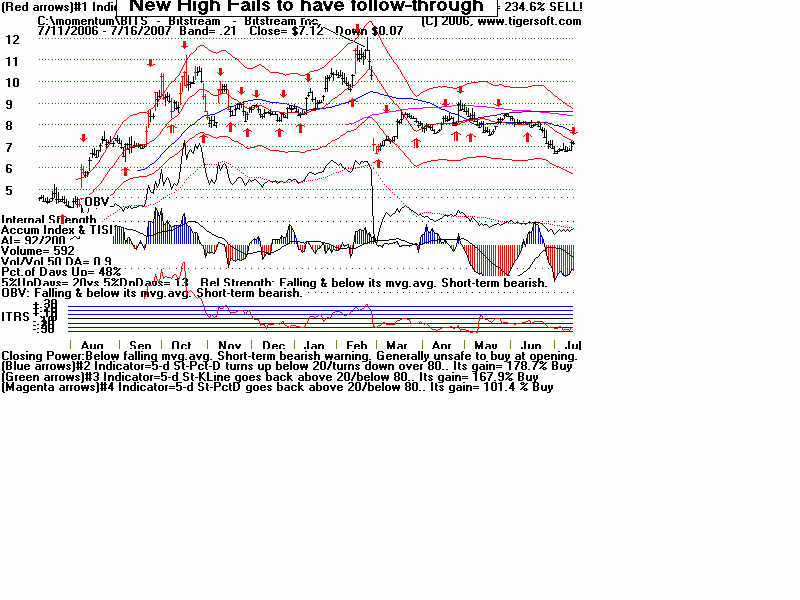
 38           BITS          Bitstream Inc.                7.12        -37%         
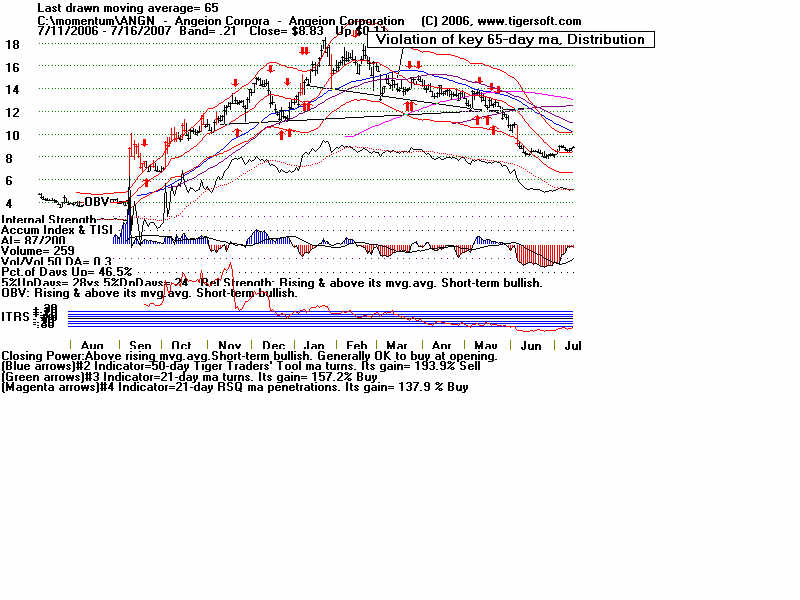
 39           ANGN          Angeion Corporation           8.83        -47%         
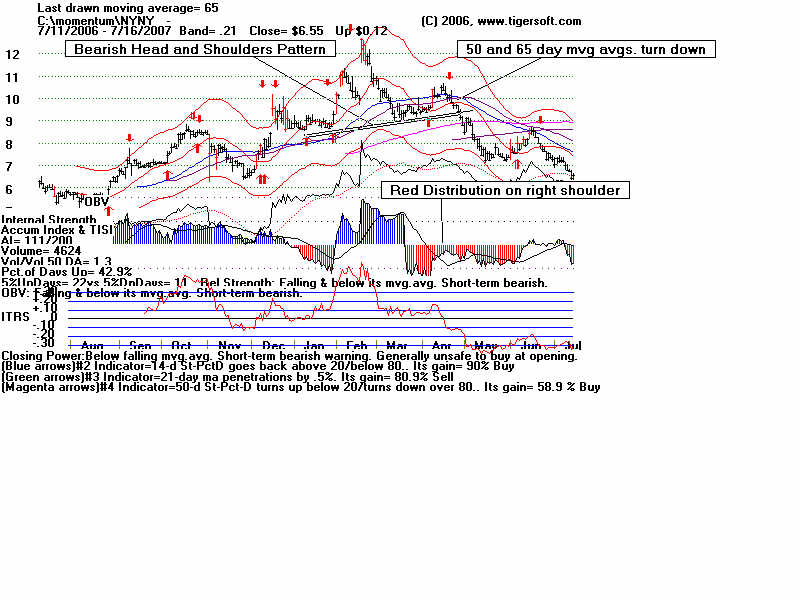
 40           NYNY          ---                           6.55        -49%         
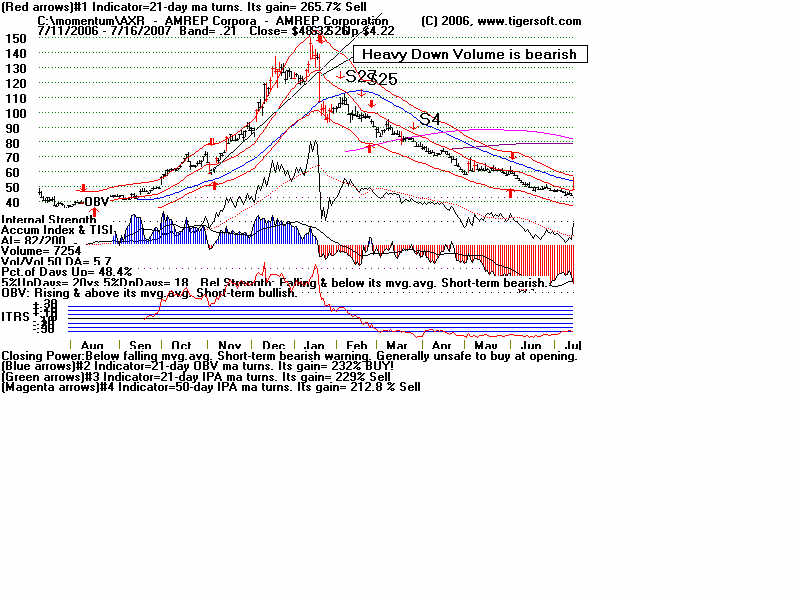
 41           AXR           AMREP Corporation            48.32        -51%         

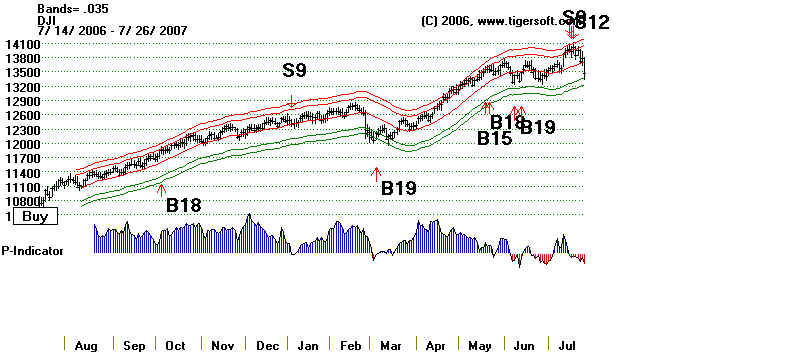
                                  Use Peerless To Know When To Stop Buying Strength   7/26/2007

      There is a point at which you have to stop buying strength.   That occurs when Peerless gives
      a major Sell Signal.  On 7/17/2007, that happened.   Take a look at the stocks now in light
      of that sell signal.  Here is the chart a week later.

      wpe1.jpg (45981 bytes)


    .


.

.

.

.     


Hit Counter