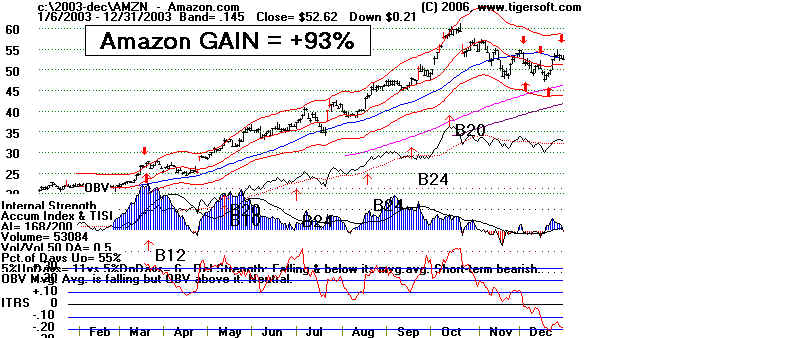
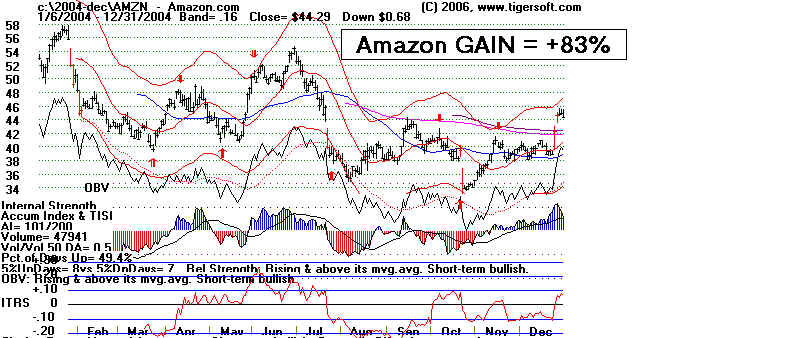
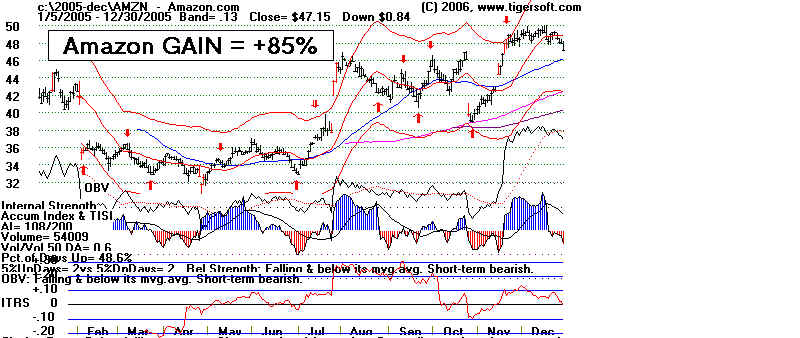
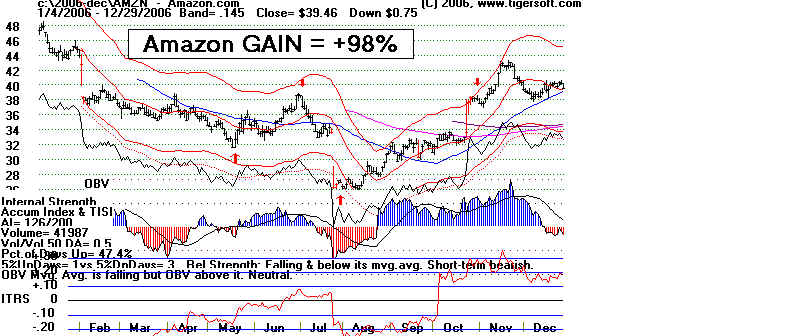
Case Study: AMZN - 2000-2007
Yearly Profits Ranged from +80% to +330% Home Page of Tiger Software.
More information on TigerSoft's
Automatic Buys and Sells.
These automatic Buy and Sell signals are optimized for the last year from more than 60
different trading systems. While the best system does change, they are valid and
exceedingly profitable until they do. We teach you when they are the most reliable.
Used in conjunction with the major trend as defined by Peerless or even the stock's own
long-term moving averages, you will never trade the same way again. Hundreds of
professionals know how to take advantage of these short term signals. Let us show you.
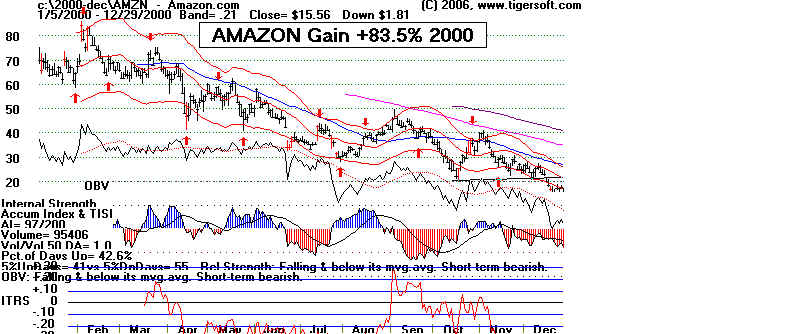
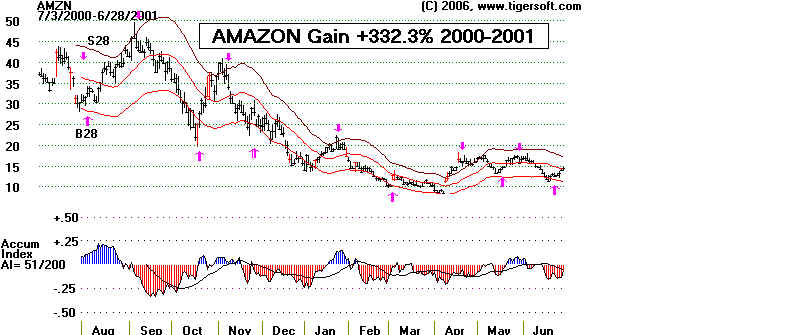
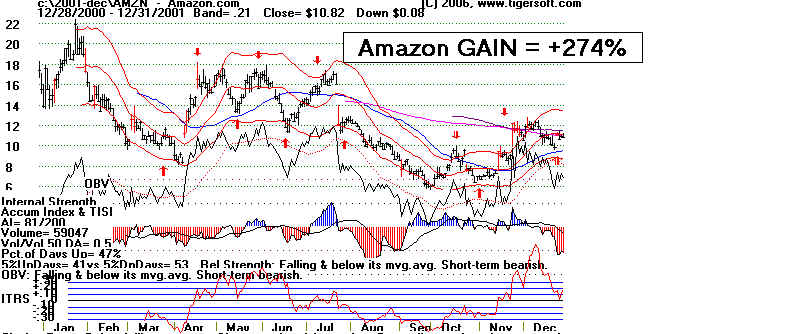
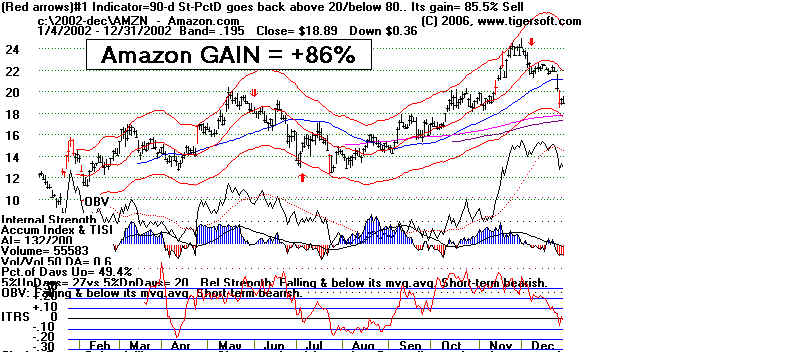
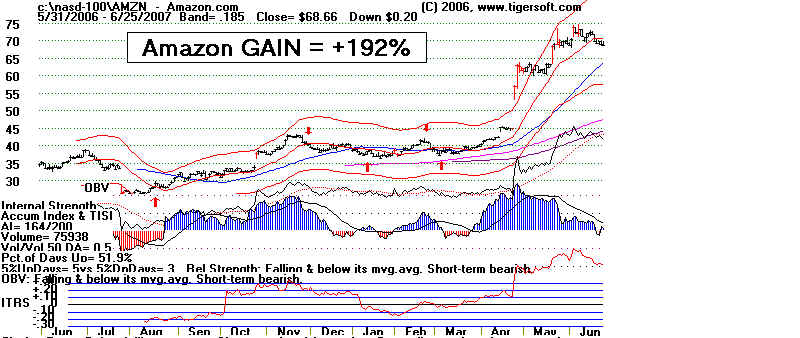
Here are the charts of Amazon from 2000-2007. Judge for yourself if these signals
would not have helped you. You will also want to study these charts to see the power
of Tiger's Accumulation Index. Our books explain how to use this important internal
strength indicator.