---- TIGERSOFT/PEERLESS HOTLINE ----------------
(C)
1985-2018 William Schmidt, Ph.D. www.tigersoft.com
All rights
strictly reserved.
You are now at www.tigersoft.com/21PEY3/INDEX.htm
(Do not use the suffix ".html")
===> Always CLICK REFRESH to be sure you are
looking at latest version of Hotline
Data used through 4/3/2019
4/4/2019 4:55 AM
PCT
IMPORTANT - Look for an EMAIL sent earlier tonight.
This HOTLINE's address will change Friday AM.
------------------------------------------------------------------------------------------------------------------------
Earlier Hotlines
www.tigersoft.com/21PEY3/INDEX-2.htm
(most recent Hotlines before
current ones)
......................................................................
www.tigersoft.com/19HLK5/INDEX.htm
www.tigersoft.com/44UHL/INDEX.htm
www.tigersoft.com/NHLP/INDEX.htm
www.tigersoft.com/7LHL/INDEX.htm
www.tigersoft.com/NHL718/INDEX.htm
www.tigersoft.com/21MAY18/INDEX.htm
www.tigersoft.com/55HEP/INDEX.htm
www.tigersoft.com/44H4L/INDEX2.htm
Earlier still: Go here...
HELP
A Guide
To Profitably Using The Tiger Nightly HOTLINE
Introduction to Tiger/Peerless Buys and
Sells.
Peerless Buy and
Sell Signals: 1928-2016
Individual Peerless signals explained:
http://tigersoftware.com/PeerlessStudies/Signals-Res/index.htm
http://www.tigersoft.com/PeerInst-2012-2013/
Explanation of each Peerless signal. http://www.tigersoft.com/PeerInst-2012-2013/
Different Types of
TigerSoft/Peerless CHARTS, Signals and Indicators
-----> More HELP LINKS
Documentation for
TigerSoft Automatic and Optimized Signals.
How reliable support is the
DJI's rising 200-day ma?
SPY Charts since
1994: Advisory Closing Power S7s, Accum. Index, 65-dma, Optimized Signals.
^^^^^^^^^^^^^^^^^^^^^^^^^^^^^^^^^^^^^^^^^^^^^^^^
1/19/2016 ---> Corrections,Deeper
Declines and Bear Markets since 1945.
1/21/2016
---> High
Velocity Declines since 1929
2/12/2016 ---> Presidential
Elections Years and Bullish IP21 Positive Non-Confirmations at Lower Band.
2/12/2016 ---> OBV NNCs on DJI's Rally to
2.7% Upper Band when DJI's 65-dma is falling.
11/6/2016 --->
Killer Short Selling
Techniques: ===> Order Here ($42.50)
It's As Easy as 1,2,3
TigerSoft "Combination" Short-Selling... Easy as 1-2-3 Short Sales
Earlier Q-Answers
QuickSilver Documentation (1/11/2016)
Our Different
Signals
Better understand the difference between
Peerless DJI-based signals,
the one-year optimized red Signals and the fixed signals based
on technical developments.
Introduction to Tiger/Peerless Buys and Sells.
Different Types of
TigerSoft/Peerless CHARTS, Signals and Indicators
New TigerPeerless Installation and
Basic Uses' Instruction
See the re-written materials on TigerSoft Buys and Sells.
Study- Trading SPY
WITHOUT Peerless - Some Guidelines.
When completed this will be a new Tiger Trading E-Book.
Study- Examples of
"Hands above the Head" top patterns.
Study- 9/3/2017 TigerSoft (not
Peerless) charts of Major Tops as they occurred.
===> Please report any broken or out-of-date links. william_schmidt@hotmail.com
--->>> Order New E-Book: "New Tiger Tahiti
System's Stocks: 2000-2018", $50.00
> When to
start avoiding the long side altogether because of Peerless signals.
> When to
start buying Tahiti stocks after the start of a Bear Market.
> When to
avoid a weaker high AI/200 stock and use the second choice.
> When to exit
Tahiti stocks before the normal 21-month holding period is over.
> The special
benefits of working with major Tahiti tech stocks.
> Watch for Head/Shoulders tops with these stocks.
> Using the
90-day Stochastic to time the purchase of Safer Tahiti Stocks
> The Tahiti
Tech System's track record using these rules matches closely the 24%/year gain that
the
blue chip Tahiti system did between 1970 and 2000.
> Tiger Software 858-273-5900 PO Box 22784 San
Diego, CA 92192 Email william_schmidt@hotmail.com
====================================================================
====================================================================
4/3/2019 The January B4, B18 and B15 Peerless Buy
signals remain un-reversed
even
though the DJI has made it to the 2.0% upper band. The market is moving
steadily
higher, almost day by day. Yes, the DJI has reached well-tested flat resistance/
But
this type of formation favors upside breakouts. Its pause now reflects normal
caution
until the Jobs' Report comes out Friday morning. Since the Buy signals' average
gains
large enough to take the DJI above 27000, since the Closing Powers are still rising
for
the major ETFs, since the Hourly DISI is in an uptrend and since 39 of the 45 groups we
follow
show more than half of their component-stocks above the support of their
65-day
ma, it is important now that we be patient and expect a good Jobs' Report
(whatever
that is!).


Don't worry that Democrats in the House now are grabbing some of the
Headlines.
The
political reality remains one that Wall Street likes and depends on, namely that
the
Trump forces control the Senate and the Supreme Court. There is very little the
Democrats
can do except to make a lot of noise. Meanwhile, Trump's budget priorites
will
continue, so will de-Regulation and so will spending on the military. Nothing is on
the
horizon that should disturb Wall Street's priorities. At least, not so long as the stock
market
and the economy keep growing. Don't worry about the FED. Chairman Powell
knows
his job now is to not rock the boat. As a Washington lawyer who made $100,000,000
from
the system, he knows how to get along. He knows his job is to boost the market
in
time for the 2020 Election. The Dollar is strong. There is little inflation. So, low
rates
are
as they say, "a no brainer". Oh, one more thing. Labor remains very
docile. That's
important
because Labor costs are the one variable that corporations must control.
What's
not to like for the stock market? Be patient, the DJI is aimed at new highs and
the
Peerless Buy signals are there for good reason. DIA, SPY and QQQ should all
keep
rising.

Charts
4/3/2019
2018 PEERLESS DJI, Signals,
Indicators Daily DJI Volume 10-DayUp/Down Vol
Hourly DJIA A/D Line for All Stocks
Inverted Traders Index
NASDAQ S&P OEX NYSE COMPQX DJI-15 DJI-20 DJI-30
DIA SPY QQQ MDY IWM TNA
Short-Term Rates
USO-CrudeOil DBO FAS GLD BBH IBB JETS JNUG KOL NUGT OIH OIL RSX RETL
SDS AGQ SLV SOXL TECL TLT TMF TNA UGA (gasoline) XIV YINN
Commodities: CANE
CORN DBC JJC, NIB, CHOC CORN, CUT (paper)
MOO, SOYB WEAT UUP (Dollar) LIT
(Lithium)
AAPL ADBE ALXN AMAT AMGN AMD AMZN BA BABA BAC BIDU CAT CVX DE
FB GOOG GS HD IBM INTU JPM M (Macy's) MSFT NFLX NVDA QCOM TSLA TXN
XOM WMT CMG , LRCX, SWKS, MDGL
SPPI WATT SQ TOWN
4/3/19 (Click
on Underlined link.)
Bullish MAXCPs - http://tigersoft.com/MAXCPS/Apr-3/BULLISH.htm
Bearish MAXCPs - http://tigersoft.com/MINCPs/Apr-3/BEARISH.htm
|
Table 1 QUICKSILVER on ETFS - 4/3/19
ETF       CLOSE   CHANGE     PIVOT-PT    5-dmaAROC  CL-PWR     CANDLE  IP21   ITRS
---------------------------------------------------------------------------------------------
DIA       262      .31       257.08        113.6%   -------      RED  .184    =====
                                                                      ^^^^^
---------------------------------------------------------------------------------------------
BA        384.74   -6.01     374.44        137.7%   -------      RED  .134   .001
---------------------------------------------------------------------------------------------
SPY       286.42    .45      280.71        119.6%   -------      RED  .064   .016
---------------------------------------------------------------------------------------------
QQQ       183.78    1.05     178.31        163.2%   -------      ---- .087   .061
---------------------------------------------------------------------------------------------
MDY       350.45    1.86     344.1         133.1%   Bearish      RED  .044   .002
---------------------------------------------------------------------------------------------
IWM       155.16    .8       152.62        126.9%   Bearish      RED -.077  -.004
---------------------------------------------------------------------------------------------
FAS       65.68    .47       61.35         462.9%   -------      RED  .043   .123
---------------------------------------------------------------------------------------------
RETL      29.89    .45       29.5          123.2%   Bearish      BLUE-.149   .002
---------------------------------------------------------------------------------------------
SOXL      158.23    10.09    131.49        934.3%   -------      BLUE .028   .698
---------------------------------------------------------------------------------------------
TECL      149.34    3.49     134.89        570.9%   -------      BLUE .113   .541 strongest combined
---------------------------------------------------------------------------------------------
IBB       113.49    .67      109.46        211.3%   Bearish      ---- .088  -.03
---------------------------------------------------------------------------------------------
GLD       121.8    -.18       121.9        -75.7%   Bearish      BLUE -.02  -.071
---------------------------------------------------------------------------------------------
RSX       21.02    -.09       20.82         50.3%   Bearish      RED  .062  -.037
|
 Table 2   Count of Stocks in Key Directories
           2019-04-03
-------------------------------
NEWHIGHS       182
NEWLOWS        21
MAXCP          25
MINCP          18
TTTNH          10
TTTNL          28
FASTUP         97
FASTDOWN       49
CPCROSSA       63
CPCROSSD       126
BIGVOLUP       4
BIGVODN        11
ACCUMVER       14
HIGHIP21       11
HIUPPCT        8
VHIP21         34
LOWACCUM       184
REDSELL        46
AUGSELS7       38
TRAPDOOR       15
|
Table 3 RANKING OF KEY DIRECTORIES BASED PCT.OF STOCKS ABOVE 65-DMA
        4/3/19
Bullish = 39
Bearish = 6
---------------------------------------------------------------------------------------
Directory     Current       day-1         day-2         day-3         day-4         day-5
----------------------------------------------------------------------------------------
BONDFUND       .99           .98           .98           .99           .99           .99
DJI-13         .923          .923          .923          .923          .846          .692
HACKERS        .863          .772          .818          .818          .681          .681
DOWJONES       .862          .862          .896          .862          .793          .689
NIFTY          .859          .894          .894          .824          .807          .789
BIGBANKS       .857          .714          .857          .428          .571          0
NASD-100       .855          .814          .835          .762          .711          .731
ETFS           .844          .827          .827          .793          .775          .758
SEMI           .827          .81           .836          .767          .715          .698
UTILITY        .825          .8            .875          .875          .825          .825
HOMEBLDG       .823          .823          .823          .823          .823          .823
AUTO           .82           .692          .717          .538          .512          .435
SP500          .82           .802          .826          .763          .739          .71
SP-100         .819          .787          .84           .755          .744          .659
TRANSP         .8            .75           .75           .65           .65           .65
INDEXES        .79           .784          .774          .752          .731          .731
REIT           .79           .81           .79           .756          .797          .783
FIDSTKS        .783          .794          .832          .751          .735          .681
INFRA          .777          .777          .805          .666          .527          .444
COMPUTER       .772          .772          .772          .681          .636          .636
SOLAR          .764          .823          .823          .823          .823          .705
RUS-1000       .763          .754          .793          .723          .701          .667
SOFTWARE       .746          .746          .714          .714          .666          .65
CHINA          .745          .762          .745          .694          .694          .644
INSURANC       .733          .7            .7            .666          .766          .766
ELECTRON       .728          .703          .746          .679          .648          .635
BIG17          .717          .695          .673          .608          .63           .565
OILGAS         .697          .732          .816          .739          .76           .725
BIOTECH        .685          .685          .674          .658          .648          .613
CHEM           .685          .648          .666          .629          .574          .518
INDMATER       .683          .683          .683          .607          .544          .544
EDU            .666          .666          .666          .666          .666          .666
RETAIL         .66           .622          .679          .641          .641          .641
GREEN          .652          .652          .695          .652          .695          .695
BEVERAGE       .611          .611          .611          .666          .611          .611
MILITARY       .548          .677          .741          .645          .58           .483
GUNS           .529          .47           .588          .47           .47           .47
FINANCE        .522          .522          .566          .366          .444          .344
COMODITY       .512          .536          .512          .463          .439          .512
============================================================================================
JETS           .5            .5            .5            .5            .5            .5
============================================================================================
FOOD           .481          .518          .5            .444          .444          .518
GAMING         .458          .458          .458          .375          .333          .333
GOLD           .411          .392          .431          .49           .47           .705
HOSPITAL       .291          .25           .291          .291          .291          .291
COAL           .285          .428          .428          .428          .428          .428
REGBANKS       .285          .321          .285          .214          .214          .178
|
====================================================================
4/2/2019 The January B4, B18 and B15 Peerless Buy signals all point to the DJI
reaching 28000 by this Summer. The abiding strength shown by the NYSE A/D,
which is running in all-time high territory ahead of the DJI and all the other ETFs is
impressive. It shows how important low interest rates are. The DJI remains
the
leader in the sense that it is closest to its high of last year. The DJI also
now shows
the highest IP21. The main ETFs we are long still are in price and Closing Power
uptrends
as is the Hourly DJI's DISI Line. The futures are up. April has strong
seasonality.
Trump is backing away from his ill-advised plan to shut the Mexican border and
Chinese stocks are acting like there may soon be a tariffs' agreement. Meanwhile,
the Dollar is strong and interest rates are low. Foreign money should continue to
flow into the major ETFs that we are long, DIA, SPY and QQQ. The futures look
good for the much more speculative SOXL. This shows confidence in US equities
remains strong. Hold for DJI 27000 soon.


Five of the DJI-30 stocks, CSCO, MRK, MSFT, PG and V are now making
new highs, just two seem particularly weak and holding it back. They are Walgreen
(-7
today) and United Healthcare (very weak Closing Power). Now oil is moving up.
So, XOM and CVX should help lift the DJI-30. Goldman Sachs could turn weak
again, but its rising 65-dma is will act as support. Altogether, there are no
dangerous
looking head and shoulders patterns and I see nothing in the blue chips which will
prevent the DJI from making a nominal new high close above 27000. Nothing, unless
it is high priced Boeing which is enjoying a rebound and is trying to close its downside
gap.
Hold onto DIA as well as SPY and QQQ. The A/D Lines of their components is
is each making new highs. But it would be better if these ETFs were making new
highs
ahead of prices or their Opening Powers. But for now their Closing Powers' uptrends
are intact and that will have to do. They should soon reach their highs.
Charts 4/2/2019
2018 PEERLESS DJI, Signals,
Indicators Daily DJI Volume 10-DayUp/Down Vol
Hourly DJIA A/D Line for All Stocks
Inverted Traders Index
NASDAQ S&P OEX NYSE COMPQX DJI-15 DJI-20 DJI-30
DIA SPY QQQ MDY IWM TNA
Short-Term Rates
USO-CrudeOil DBO FAS GLD BBH IBB JETS JNUG KOL NUGT OIH OIL RSX RETL
SDS AGQ SLV SOXL TECL TLT TMF TNA UGA (gasoline) XIV YINN
Commodities: CANE
CORN DBC JJC, NIB, CHOC CORN, CUT (paper)
MOO, SOYB WEAT UUP (Dollar) LIT
(Lithium)
AAPL ADBE ALXN AMAT AMGN AMD AMZN BA BABA BAC BIDU CAT CVX DE
FB GOOG GS HD IBM INTU JPM M (Macy's) MSFT NFLX NVDA QCOM TSLA TXN
XOM WMT CMG , LRCX, SWKS, MDGL
SPPI WATT SQ TOWN
4/2/19 (Click
on Underlined link.)
Bullish MAXCPs - http://tigersoft.com/MAXCPS/Apr-2/BULLISH.htm
Bearish MAXCPs - http://tigersoft.com/MINCPs/Apr-2/BEARISH.htm
|
Table 1 QUICKSILVER on ETFS - 4/2/19
ETF       CLOSE   CHANGE     PIVOT-PT    5-dmaAROC  CL-PWR     CANDLE  IP21   ITRS
---------------------------------------------------------------------------------------------
DIA       261.69   -.7       256.11        101.3%   -------      RED  .187   =====
                                                                      ^^^^^
---------------------------------------------------------------------------------------------
BA        390.75   -.79      374.21        269.2%   -------      BLUE .154   .012
---------------------------------------------------------------------------------------------
SPY       285.97    .14      279.65        86%      -------      RED  .075   .014
---------------------------------------------------------------------------------------------
QQQ       182.73    .69      177.9         102.6%   -------      BLUE .108   .047
---------------------------------------------------------------------------------------------
MDY       348.59   -1.41     341.24        103.2%   Bearish      RED  .02   -.005
---------------------------------------------------------------------------------------------
IWM       154.36   -.4       151.27        81.8%    Bearish      RED -.089  -.012
---------------------------------------------------------------------------------------------
FAS       65.21    .24       59.88         379.1%   -------      BLUE .064   .095
---------------------------------------------------------------------------------------------
RETL      29.44   -.89       29.16         199.1%   Bearish      RED -.106  -.079
---------------------------------------------------------------------------------------------
SOXL      148.14    .47      132.18        360.2%   -------      BLUE .011   .46
                                                                             ^^^^
---------------------------------------------------------------------------------------------
TECL      145.85    1.53     133.42        372%     -------      BLUE .125   .436
---------------------------------------------------------------------------------------------
IBB       112.82    .91      108.8         112.7%   Bearish      BLUE .027  -.038
---------------------------------------------------------------------------------------------
GLD       121.98    .45      123.65       -94.6%    Bearish      BLUE .03   -.051
---------------------------------------------------------------------------------------------
RSX       21.11    .08       20.81        -2.4%     Bearish      BLUE .125  -.03
|
 Table 2  Count of Stocks in Key Directories
          20190402
-------------------------------
NEWHIGHS       169  Bullish
NEWLOWS        16
MAXCP          23
MINCP          15
TTTNH          8
TTTNL          35
FASTUP         58
FASTDOWN       52
CPCROSSA       82
CPCROSSD       143
BIGVOLUP       4
BIGVODN        176
ACCUMVER       11
HIGHIP21       11
HIUPPCT        8
VHIP21         34
LOWACCUM       176
REDSELL        44
AUGSELS7       30
TRAPDOOR       15
|
Table 3 RANKING OF KEY DIRECTORIES BASED PCT.OF STOCKS ABOVE 65-DMA
        4/2/19
---------------------------------------------------------------------------------------
Directory     Current       day-1         day-2         day-3         day-4         day-5
----------------------------------------------------------------------------------------
BONDFUND       .98           .98           .99           .99           .99           .99
DJI-13         .923          .923          .923          .846          .692          .769
NIFTY          .894          .894          .824          .807          .789          .824
DOWJONES       .862          .896          .862          .793          .689          .758
ETFS           .827          .827          .793          .775          .758          .81
HOMEBLDG       .823          .823          .823          .823          .823          .764
SOLAR          .823          .823          .823          .823          .764          .705
REIT           .81           .79           .756          .797          .797          .817
SEMI           .81           .836          .767          .715          .706          .775
NASD-100       .808          .828          .757          .707          .727          .777
SP500          .804          .828          .765          .74           .718          .738
UTILITY        .8            .875          .875          .825          .825          .875
SP-100         .795          .849          .763          .752          .666          .731
FIDSTKS        .794          .832          .751          .735          .697          .735
INDEXES        .784          .774          .752          .731          .736          .747
INFRA          .777          .805          .666          .527          .472          .472
COMPUTER       .772          .772          .681          .636          .636          .681
HACKERS        .772          .818          .818          .681          .681          .772
CHINA          .762          .745          .694          .694          .661          .644
RUS-1000       .754          .793          .722          .702          .677          .692
TRANSP         .75           .75           .65           .65           .65           .6
SOFTWARE       .746          .714          .714          .666          .666          .714
OILGAS         .732          .816          .739          .76           .739          .767
BIGBANKS       .714          .857          .428          .571          0             .571
ELECTRON       .703          .746          .679          .648          .641          .703
INSURANC       .7            .7            .666          .766          .766          .766
BIG17          .695          .673          .608          .63           .586          .652
AUTO           .692          .717          .538          .512          .461          .435
INDMATER       .683          .683          .607          .544          .556          .531
BIOTECH        .682          .674          .658          .648          .619          .666
MILITARY       .677          .741          .645          .58           .483          .516
EDU            .666          .666          .666          .666          .666          .666
GREEN          .652          .695          .652          .695          .695          .695
CHEM           .648          .666          .629          .574          .555          .555
RETAIL         .622          .679          .641          .641          .641          .584
BEVERAGE       .611          .611          .666          .611          .611          .611
COMODITY       .536          .512          .463          .439          .512          .56
FINANCE        .522          .555          .366          .444          .344          .444
FOOD           .518          .5            .444          .444          .518          .555
=========================================================================================
JETS           .5            .5            .5            .5            .5            .3
=========================================================================================
GUNS           .47           .588          .47           .47           .47           .529
GAMING         .458          .458          .375          .333          .333          .333
COAL           .428          .428          .428          .428          .428          .428
GOLD           .392          .431          .49           .47           .705          .725
REGBANKS       .321          .285          .214          .214          .178          .214
HOSPITAL       .25           .291          .291          .291          .291          .333
|
==========================================================================
4/1/2019 No thanks to JP Morgan's misleading talk of
an inversion of interest rates,
we got our rally back above 26000. Professionals were correctly bullish about
Boeing.
Today's overall volume could have been higher and more of the Russell-2000 stocks could
have
participated, but the DJIA is once again the leader. As I showed last night, the market
could
could go wildly up if it can get past 27000 on a lowering of interest rates. But that
won't
happen, at least, not until we see from this Friday's Jobs' Report if the US economy is
slowing down. The Peerless Buy signals all suggest we will see 27000 before we get a
Peerless
Sell.


What is clear from today's action is that no inflation is expected. Gold and silver
show bearish head/shoulders patterns. And Chinese and Semi-conductor stocks
are moving up again. So, the advance is a lot broader than just the DJIA stocks.
See how the NYSE AD line made a new 12-month high today. Only in 1976-1977
and August 2001 (a month before the 9/11 attack) was this true before a bear market.
Most of the advance recently has come from higher openings. I woudn't take this
as bearish yet. But we should see more Closing Power Strength if the resistance-levels we
have reached are going to be overcome.
Stay long DIA, SPY and QQQ. There are very few appealing short sale
candidates among
our Bearish MINCPs. The shorts are being run in. Cover any shorts if their Closing
Powers are violated.


Charts 4/1/2019
2018 PEERLESS DJI, Signals,
Indicators Daily DJI Volume 10-DayUp/Down Vol
Hourly DJIA A/D Line for All Stocks
Inverted Traders Index
NASDAQ S&P OEX NYSE COMPQX DJI-15 DJI-20 DJI-30
DIA SPY QQQ MDY IWM TNA
Short-Term Rates
USO-CrudeOil DBO FAS GLD BBH IBB JETS JNUG KOL NUGT OIH OIL RSX RETL
SDS AGQ SLV SOXL TECL TLT TMF TNA UGA (gasoline) XIV YINN
Commodities: CANE
CORN DBC JJC, NIB, CHOC CORN, CUT (paper)
MOO, SOYB WEAT UUP (Dollar) LIT
(Lithium)
AAPL ADBE ALXN AMAT AMGN AMD AMZN BA BABA BAC BIDU CAT CVX DE
FB GOOG GS HD IBM INTU JPM M (Macy's) MSFT NFLX NVDA QCOM TSLA TXN
XOM WMT CMG , LRCX, SWKS, MDGL
SPPI WATT SQ TOWN
4/1/19 (Click
on Underlined link.)
Bullish MAXCPs - http://tigersoft.com/MAXCPS/Apr-1/BULLISH.htm
Bearish MAXCPs - http://tigersoft.com/MINCPs/Apr-1/BEARISH.htm
|
Table 1 QUICKSILVER on ETFS - 4/1/19
ETF       CLOSE   CHANGE     PIVOT-PT    5-dmaAROC  CL-PWR     CANDLE  IP21   ITRS
---------------------------------------------------------------------------------------------
DIA       262.39    3.26     256.46        142.5%   -------      BLUE .163    0
---------------------------------------------------------------------------------------------
BA        391.54    10.12    370.38        281.7%   -------      BLUE .155   .014
---------------------------------------------------------------------------------------------
SPY       285.83    3.35     281.12        121%     Bearish      BLUE .06   .011
---------------------------------------------------------------------------------------------
QQQ       182.04    2.38     179.05        106.9%   -------      BLUE .094   .036
---------------------------------------------------------------------------------------------
MDY       350       4.6      341.48        173.4%   Bearish      BLUE .02  -.004
---------------------------------------------------------------------------------------------
IWM       154.76    1.67     151.86        147.5%   Bearish      BLUE-.108  -.015
---------------------------------------------------------------------------------------------
FAS       64.97    3.11      60.53         523.6%   Bearish      BLUE .039   .123
---------------------------------------------------------------------------------------------
RETL      30.33    .66       28.27         457.4%   Bearish      BLUE-.132  -.013
---------------------------------------------------------------------------------------------
SOXL      147.67    10.13    138.24        501.4%   Bearish      BLUE .006   .542
---------------------------------------------------------------------------------------------
TECL      144.32    5.69     135.63        401.6%   -------      BLUE .105   .47
---------------------------------------------------------------------------------------------
IBB       111.91    .11      110.33        163.6%   Bearish      RED -.001  -.057
---------------------------------------------------------------------------------------------
GLD       121.53   -.48      124.3        -137.4%   Bearish      RED  .017  -.081
---------------------------------------------------------------------------------------------
OIL       121.53   -.48      124.3        -137.4%   Bullish      RED -.032   11.052
---------------------------------------------------------------------------------------------
OIH       17.75    .52       17.13         245.6%   Bearish      BLUE-.025  -.004
---------------------------------------------------------------------------------------------
GASL      8.09    .26        7.73          468.9%   Bearish      ---- .041  -.109
---------------------------------------------------------------------------------------------
UGA       8.09    .26        7.73          468.9%   Bullish      -----.002  -.767
---------------------------------------------------------------------------------------------
UUP       26.01   -.02       25.88         40.5%   Bullish      ---- .054  -.055
---------------------------------------------------------------------------------------------
IEF       26.01   -.02       25.88         40.5%   Bearish      -----.204  -.827
---------------------------------------------------------------------------------------------
CORN      26.01   -.02       25.88         40.5%   Bullish      ---- .057   .535
---------------------------------------------------------------------------------------------
WEAT      26.01   -.02       25.88         40.5%   Bullish      ---- .082   3.325
---------------------------------------------------------------------------------------------
YINN      26.01   -.02       25.88         40.5%   -------      ---- .304   .08
---------------------------------------------------------------------------------------------
RSX       21.03    .43       21.12        -40.7%   Bearish      BLUE .096  -.042
|
Table 2   Count of Stocks in Key Directories
          20190401
-------------------------------
NEWHIGHS       187  Bullish
NEWLOWS        8
MAXCP          19
MINCP          12
TTTNH          11
TTTNL          23
FASTUP         74
FASTDOWN       55
CPCROSSA       114
CPCROSSD       75
BIGVOLUP       4
BIGVODN        9
ACCUMVER       11
HIGHIP21       11
HIUPPCT        8
VHIP21         33
LOWACCUM       184
REDSELL        44
AUGSELS7       37
TRAPDOOR       15
|
Table 3 RANKING OF KEY DIRECTORIES BASED PCT.OF STOCKS ABOVE 65-DMA
              4/1/19
  Bullish = 39
  Bearish = 5
---------------------------------------------------------------------------------------
Directory     Current       day-1         day-2         day-3         day-4         day-5
----------------------------------------------------------------------------------------
BONDFUND       .98           .99           .99           .99           .99           .99
DJI-13         .923          .923          .846          .692          .846          .692
NIFTY          .894          .824          .807          .789          .842          .807
UTILITY        .875          .875          .825          .825          .875          .85
DOWJONES       .866          .833          .766          .666          .766          .666
BIGBANKS       .857          .428          .571          0             .571          0
SP-100         .849          .763          .752          .666          .752          .645
SEMI           .836          .767          .715          .706          .775          .793
FIDSTKS        .832          .751          .735          .697          .751          .686
NASD-100       .828          .757          .707          .727          .787          .757
SP500          .828          .765          .74           .718          .748          .702
ETFS           .827          .793          .775          .758          .81           .775
HOMEBLDG       .823          .823          .823          .823          .764          .764
SOLAR          .823          .823          .823          .764          .705          .823
HACKERS        .818          .818          .681          .681          .772          .772
OILGAS         .816          .739          .76           .739          .767          .683
INFRA          .805          .666          .527          .472          .527          .444
RUS-1000       .793          .722          .701          .678          .7            .649
REIT           .79           .756          .797          .797          .824          .75
COMPUTER       .772          .681          .636          .636          .681          .636
INDEXES        .768          .752          .731          .736          .752          .736
TRANSP         .75           .65           .65           .65           .6            .55
ELECTRON       .746          .679          .648          .641          .703          .703
CHINA          .745          .694          .694          .661          .644          .711
MILITARY       .741          .645          .58           .483          .548          .516
AUTO           .717          .538          .512          .461          .435          .384
SOFTWARE       .714          .714          .666          .666          .714          .714
INSURANC       .7            .666          .766          .766          .766          .666
GREEN          .695          .652          .695          .695          .695          .695
INDMATER       .683          .607          .544          .556          .569          .544
RETAIL         .679          .641          .641          .641          .603          .509
BIG17          .673          .608          .63           .586          .652          .608
BIOTECH        .671          .658          .648          .619          .669          .648
CHEM           .666          .629          .574          .555          .574          .555
EDU            .666          .666          .666          .666          .666          .5
BEVERAGE       .611          .666          .611          .611          .611          .611
GUNS           .588          .47           .47           .47           .529          .47
FINANCE        .555          .355          .444          .344          .444          .355
COMODITY       .512          .463          .439          .512          .56           .536
FOOD           .5            .444          .444          .518          .555          .518
JETS           .5            .5            .5            .5            .3            .3
===============================================================================================
GAMING         .458          .375          .333          .333          .333          .333
GOLD           .431          .49           .47           .705          .725          .745
COAL           .428          .428          .428          .428          .428          .428
HOSPITAL       .291          .291          .291          .291          .333          .416
REGBANKS       .285          .214          .214          .178          .214          0
|
====================================================================
3/29/2019 Short-Term rates are going down. This
should be bullish.

The Peerless Buy B4, B18 and B15 signals stand. Seasonality is bullish for the
next two weeks. Since 1965, the DJI has risen 65% of the time in this period.
In the third year of the 4-year Presidential cycle, like now, the odds of a DJI
rally jump to 75% of the time and DJI shows an average gain of 1.6%. If this were
a typical year, the DJI should then be up 2.1% in a month, 4.2% in two months
and 6% in three months. The DJI's head and shoulder pattern looks like it will
not play out. As traders realize this, the shorts among them will have to
cover.
So, what was a hesitant rally back up to resistance could quickly get a lot more
exciting when recovery new highs are made. Defintely, continue to hold the major
ETFs, DIA, SPY and QQQ.


Parallel to 1927
In many ways, the market is behaving as it did in the Spring
of 1927. See the
weekly chart below of that era. Back then, rates were dropped in the Summer of 1927,
also a year before the Presidential Election. That allowed the DJI to begin a wild
advance into all-time high territory. The DJI then doubled and did not stop until
September 1929.

What's To Prevent Another 1929 Crash?
I believe the political and economic parallels between then
and now are worth
considering; the most important being that, like now, the bull market has already made
a long run, the gap between the super wealthy and the rest of Americans is
very wide and most of the new wealth was by 1929 going back into the stock market
In addition, the Coolidge and Trump economic agendas match up closely: tax cuts for
corporations and the wealthy, de-regulation of industry/Wall Street and bigger tariffs.
Two other similarities: Labor was weak and Unemployment was low.
There were, of course, many important differences. Coolidge's stock market did have
two advantages over Trump's: Coolidge's Party controlled both the Senate and the
House and in the 1920s, there was a much bigger array of new consumer goods that
assured a high level of consumer demand. Of course, the Federal Government now
plays
a much bigger role in the whole Economy. Trump's budgets guarantee two million
military
and civilian jobs while Social Security, welfare and Medicare prevent most extreme poverty
and offer a safety-net underneath the Economy.
The big problem for Coolidge and possibly Trump will - if
history repeats - be that the
stock market rally will turn into a wildly speculative bubble. Back in the late
1920s,
the broader public was drawn like moths to a flame. They were allowed to buy stock
with as
little as 10% down. As a result, the Public drove the DJI up 50% in 1928 despite the
FED's raising the Discount Rate four times. That was the year the FED lost control.
The market's advance, however, was very convenient for the Hoover Presidential campaign,
but it soon posed a serious dilema. By 1929, the FED knew quite well that the
stock market's
bubble was becoming dangerous. One half of all the money that was loaned in 1929
went into stock speculation. "Legitimate" commerce and construction began
suffering from
a lack of capital. Many big corporations even found it very profitable to loan for
stock
speculation. They could borrow it for 5 1/2% to 6% and loan it out for more than
double
that for stock speculation. But the FED did not want to raise rates. They knew
from the
depression of 1920-1921, that if they raised the Discount Rate much above 5%, it could
lead
to another deep recession. They also had no authority to raise margin requirements.
And when
Hoover asked JP Morgan to stop making so many loans for stock speculation, Morgan
just laughed at him.
Finally, after the DJI had risen from to 360 in August 1929,
they raised rates from
5% to 6% even though the first signs of an economic slow down were already occurring
in new home permits, housing construction and auto/steel production. This had a
double-barreled effect; it hit stocks hard and it forced a weakening economy to
begin
to retrench. So two weeks later, the market peaked and JP Morgan, for one, took big
short
positions and stopped supporting the DJI whose strength throughout 929 had been
very usefully concealing the rapid fall in the NYSE A/D Line. A month later, with
support
for the DJIA withdrawn, the whole market crashed.
Of course, we don't allow buying stocks with just
10% or 20% down. Or do we? A lot of
traders now buy leveraged long ETFs on margin. The margin requirement when buying 3x
leveraged Exchange Traded Funds (ETF's) overnight is 75% on the the long
side. This
means $33,000 of SOXL (or $100,000 worth of TXN, INTC and NVDA, etc.can be bought
for $22500. In effect, the margin requirement now is 22.5%. It does not take
much of a
decline in one's SOXL long position to get a margin call or even be sold out. This
is
exactly what happened in October and November 1929 to lots and lots of people who
were bankrupted by the plunge..
SOXL is still on a number of TigerSoft Sells.

Charts 3/29/2019
2018 PEERLESS DJI, Signals,
Indicators Daily DJI Volume 10-DayUp/Down Vol
Hourly DJIA A/D Line for All Stocks
Inverted Traders Index
NASDAQ S&P OEX NYSE COMPQX DJI-15 DJI-20 DJI-30
DIA SPY QQQ MDY IWM TNA
Short-Term Rates
USO-CrudeOil DBO FAS GLD BBH IBB JETS JNUG KOL NUGT OIH OIL RSX RETL
SDS AGQ SLV SOXL TECL TLT TMF TNA UGA (gasoline) XIV YINN
Commodities: CANE
CORN DBC JJC, NIB, CHOC CORN, CUT (paper)
MOO, SOYB WEAT UUP (Dollar) LIT
(Lithium)
AAPL ADBE ALXN AMAT AMGN AMD AMZN BA BABA BAC BIDU CAT CVX DE
FB GOOG GS HD IBM INTU JPM M (Macy's) MSFT NFLX NVDA QCOM TSLA TXN
XOM WMT CMG , LRCX, SWKS, MDGL
SPPI WATT SQ TOWN
3/29/19 (Click
on Underlined link.)
Bullish MAXCPs - http://tigersoft.com/MAXCPS/Mar-29/BULLISH.htm
Bearish MAXCPs - http://tigersoft.com/MINCPs/Mar-29/BEARISH.htm
|
Table 1 RANKING OF KEY DIRECTORIES BASED PCT.OF STOCKS ABOVE 65-DMA
        3/29/19
 Bullish = 35
 Bearish = 10
---------------------------------------------------------------------------------------
Directory     Current       day-1         day-2         day-3         day-4         day-5
----------------------------------------------------------------------------------------
BONDFUND       .99           .99           .99           .99           .99           .99
DJI-13         .923          .846          .692          .846          .692          .692
UTILITY        .875          .825          .825          .875          .85           .825
DOWJONES       .833          .766          .666          .766          .666          .666
NIFTY          .824          .807          .789          .842          .807          .824
HOMEBLDG       .823          .823          .823          .764          .764          .705
SOLAR          .823          .823          .764          .705          .823          .764
HACKERS        .818          .681          .681          .772          .772          .727
ETFS           .793          .775          .758          .81           .793          .775
SEMI           .767          .715          .706          .775          .793          .784
SP500          .765          .74           .718          .748          .71           .708
SP-100         .763          .752          .666          .752          .645          .666
REIT           .758          .798          .798          .825          .751          .731
NASD-100       .757          .707          .727          .787          .757          .767
INDEXES        .752          .731          .736          .752          .741          .731
FIDSTKS        .751          .735          .697          .751          .691          .708
OILGAS         .739          .76           .739          .767          .69           .732
RUS-1000       .722          .701          .677          .701          .658          .658
SOFTWARE       .714          .666          .666          .714          .714          .714
CHINA          .694          .694          .661          .644          .711          .677
COMPUTER       .681          .636          .636          .681          .636          .681
ELECTRON       .679          .648          .641          .703          .703          .716
BEVERAGE       .666          .611          .611          .611          .611          .611
EDU            .666          .666          .666          .666          .5            .666
INFRA          .666          .527          .472          .527          .472          .416
INSURANC       .666          .766          .766          .766          .7            .633
BIOTECH        .656          .648          .619          .669          .658          .653
GREEN          .652          .695          .695          .695          .695          .695
TRANSP         .65           .65           .65           .6            .55           .6
MILITARY       .645          .58           .483          .548          .516          .548
RETAIL         .641          .641          .641          .603          .509          .433
CHEM           .629          .574          .555          .574          .611          .611
BIG17          .608          .63           .586          .652          .608          .63
INDMATER       .607          .544          .556          .569          .544          .556
AUTO           .538          .512          .461          .435          .384          .358
============================================================================================
JETS           .5            .5            .5            .3            .3            .4
===========================================================================================
GOLD           .49           .47           .705          .725          .764          .725
GUNS           .47           .47           .47           .529          .47           .411
COMODITY       .463          .439          .512          .56           .585          .56
FOOD           .444          .444          .518          .555          .555          .555
BIGBANKS       .428          .571          0             .571          0             .285
COAL           .428          .428          .428          .428          .428          .428
GAMING         .375          .333          .333          .333          .333          .333
FINANCE        .355          .433          .344          .444          .377          .344
HOSPITAL       .291          .291          .291          .333          .416          .5
REGBANKS       .214          .214          .178          .214          .035          .035
|
 TABLE 2   Count of Stocks in Key Directories
          20190329
-------------------------------
NEWHIGHS       149  Bullish
NEWLOWS        2
MAXCP          27
MINCP          15
TTTNH          18
TTTNL          28
FASTUP         47
FASTDOWN       66
CPCROSSA       62
CPCROSSD       125
BIGVOLUP       5
BIGVODN        7
ACCUMVER       8
HIGHIP21       9
HIUPPCT        8
VHIP21         33
LOWACCUM       185
REDSELL        45
AUGSELS7       32
TRAPDOOR       16
|
Table 3 QUICKSILVER on ETFS - 3/29/19
ETF       CLOSE   CHANGE     PIVOT-PT    5-dmaAROC  CL-PWR     CANDLE  IP21   ITRS
---------------------------------------------------------------------------------------------
DIA       259.13    2.05     255.07        81.5%    Bearish      BLUE  .119   -----
---------------------------------------------------------------------------------------------
BA        381.42    6.98     370.46        259.9%   -------      BLUE  .118   .012
---------------------------------------------------------------------------------------------
SPY       282.48    1.77     279.04        57.7%    Bearish      BLUE  .058   .011
---------------------------------------------------------------------------------------------
QQQ       179.66    1.35     178.22        30.8%    -------      ----  .092   .035
---------------------------------------------------------------------------------------------
MDY       345.4    1.3       338.14        118.4%   Bearish      RED  -.012  -.003
---------------------------------------------------------------------------------------------
IWM       153.09    .47      150.28        114.8%   Bearish      RED  -.103  -.012
---------------------------------------------------------------------------------------------
FAS       61.86    .51       58.64         230.4%   Bearish      RED  -.007   .088
---------------------------------------------------------------------------------------------
RETL      29.67    .17       27.69         516.4%   Bearish      ---- -.326  -.008
---------------------------------------------------------------------------------------------
SOXL      137.54    6.05     134.16       -71.8%    Bearish      BLUE -.033   .488
---------------------------------------------------------------------------------------------
TECL      138.63    3.74     133.46        135.3%   -------      BLUE  .097   .444
                                                                       ^^^^^^^^^^^
---------------------------------------------------------------------------------------------
IBB       111.8    2.34      108.32        166.5%   Bearish      BLUE  .062  -.042
---------------------------------------------------------------------------------------------
GLD       122.01    .11      124.92       -79.2%    Bearish      RED  -.016  -.074
---------------------------------------------------------------------------------------------
RSX       20.6   -.22        21.2         -71.5%    Bearish      RED   .033  -.053
|
====================================================================
3/28/2019 Volume is low, but the DJI's Hourly
OBV is showing the type of
bullish improvement that brings a short-term rally. Also bullish, heavily weighted
Boeing has done very well holding up, despite the continuing negative fallout of the
two crashes of its MAX Jet airlines. I particularly find encouragement in the NYSE
A/D Line's 12-month new high today. Hold DIA, SPY and QQQ.
Hourly DJIA

DJIA

Significant tops seldom occur in the Spring when the ADL is so strong
unless Peerless gives a Sell Signal. Notice, too, how the Advance-Decline for the
DJI-30, SP-500 and Nasdaq-100 are all in strong uprends.
ADL for DJI-30 is rising.

ADL for SP-500 is rising.

ADL for QQQ is rising.

Falling 10-Yr Rates
It remains amazing to me that the Interest Rate on 10-Year Bonds remains in such
a steep downtrend and is below 3%. There are no cases from 1965 to 2008 of the
10-year
Bond dropping below 2.8%. See for yourself. Here are the 10-year rates
going back to 1970.
https://fred.stlouisfed.org/series/IRLTLT01USM156N
Cases where 10-Yr Rates fell below 2.8%
2008-11-01,3.53
2008-12-01,2.42 One month DJI rally
2009-01-01,2.52 Bear Market bottom made a month later,
2010-07-01,3.01
2010-08-01,2.7 Decline to lower band
2010-09-01,2.65 Strong advance follows
2011-07-01,3
2011-08-01,2.3 Steep decline
2011-09-01,1.98 Basing until Oct 4
2014-01-01,2.86
2014-02-01,2.71 Decline until Feb 3
2014-03-01,2.72 Strong rally
2018-12-01,2.83
2019-01-01,2.71 Strong advance
2019-02-01,2.68 Advance
The US Dollar ( UUP ) is also still in a strong uptrend. One would think that this will give
the FED
plenty of room to short-term rates if it wanted to help push up stocks to new highs.
Charts 3/28/2019
2018 PEERLESS DJI, Signals,
Indicators Daily DJI Volume 10-DayUp/Down Vol
Hourly DJIA A/D Line for All Stocks
Inverted Traders Index
NASDAQ S&P OEX NYSE COMPQX DJI-15 DJI-20 DJI-30
DIA SPY QQQ MDY IWM TNA
Short-Term Rates
USO-CrudeOil DBO FAS GLD BBH IBB JETS JNUG KOL NUGT OIH OIL RSX RETL
SDS AGQ SLV SOXL TECL TLT TMF TNA UGA (gasoline) XIV YINN
Commodities: CANE
CORN DBC JJC, NIB, CHOC CORN, CUT (paper)
MOO, SOYB WEAT UUP (Dollar) LIT
(Lithium)
AAPL ADBE ALXN AMAT AMGN AMD AMZN BA BABA BAC BIDU CAT CVX DE
FB GOOG GS HD IBM INTU JPM M (Macy's) MSFT NFLX NVDA QCOM TSLA TXN
XOM WMT CMG , LRCX, SWKS, MDGL
SPPI WATT SQ TOWN
3/28/19 (Click
on Underlined link.)
Bullish MAXCPs - http://tigersoft.com/MAXCPS/Mar-28/BULLISH.htm
Bearish MAXCPs - http://tigersoft.com/MINCPs/Mar-28/BEARISH.htm
|
Table 1 QUICKSILVER on ETFS - 3/28/19
ETF       CLOSE   CHANGE     PIVOT-PT    5-dmaAROC  CL-PWR     CANDLE IP21 ITRS
---------------------------------------------------------------------------------------------
DIA       257.08    .97      254.96       -48.7%   Bearish      BLUE .062   ----
---------------------------------------------------------------------------------------------
BA        374.44    .23      362.17        23.5%   Bullish      RED  .102  -.005
---------------------------------------------------------------------------------------------
SPY       280.71    1.06     279.25       -71.6%   Bearish      BLUE .015   .01
---------------------------------------------------------------------------------------------
QQQ       178.31    .41      178.56       -118.8%  -------      RED  .057   .03
---------------------------------------------------------------------------------------------
MDY       344.1    2.86      337.34       -48.7%   -------      BLUE -.028  .004
---------------------------------------------------------------------------------------------
IWM       152.62    1.35     149.62       -87.4%   Bearish      BLUE -.119 -.004
---------------------------------------------------------------------------------------------
FAS       61.35    1.47      59.1         -155.9%  Bearish      BLUE -.024  .137
---------------------------------------------------------------------------------------------
RETL      29.5    .34        26.75         85.2%   Bearish      RED   -.32  -.004
---------------------------------------------------------------------------------------------
SOXL      131.49   -.69      139.48       -752.3%  Bearish      RED   -.046 .386
---------------------------------------------------------------------------------------------
TECL      134.89    1.47     134.99       -393%   -------       BLUE .062   .409
---------------------------------------------------------------------------------------------
IBB       109.46    .66      108.17       -114.6%   Bearish     BLUE .029  -.066
---------------------------------------------------------------------------------------------
GLD       121.9   -1.75      123.97       -71.7%   Bearish      RED -.021  -.068
---------------------------------------------------------------------------------------------
OIH       17.26    .27       16.95        -142.9%   -------     BLUE-.024  -.02
---------------------------------------------------------------------------------------------
RSX       20.82    .01       20.9         -154%   Bearish       BLUE .036  -.03
|
  Table 2  Count of Stocks in Key Directories
           2019 03 28
-------------------------------
NEWHIGHS       139 Bullish
NEWLOWS        9
MAXCP          24
MINCP          21
TTTNH          17
TTTNL          28
FASTUP         27
FASTDOWN       145
CPCROSSA       79
CPCROSSD       54
BIGVOLUP       1
BIGVODN        8
ACCUMVER       5
HIGHIP21       7
HIUPPCT        8
VHIP21         33
LOWACCUM       163
REDSELL        40
AUGSELS7       17
TRAPDOOR       16
|
 Table 3      RANKING OF KEY DIRECTORIES BASED PCT.OF STOCKS ABOVE 65-DMA
              3/28/19
 Bullish = 36
 Bearish = 9
---------------------------------------------------------------------------------------
Directory     Current       day-1         day-2         day-3         day-4         day-5
----------------------------------------------------------------------------------------
BONDFUND       .99           .99           .99           .99           .99           .99
DJI-13         .846          .692          .846          .692          .692          .846
UTILITY        .825          .825          .875          .85           .825          .9
HOMEBLDG       .823          .823          .764          .764          .705          .823
SOLAR          .823          .764          .705          .823          .823          .823
NIFTY          .807          .789          .842          .807          .824          .877
REIT           .798          .798          .825          .751          .738          .845
ETFS           .775          .758          .81           .793          .775          .982
DOWJONES       .766          .666          .766          .666          .666          .833
INSURANC       .766          .766          .766          .7            .666          .766
OILGAS         .76           .739          .767          .69           .739          .873
SP-100         .752          .666          .752          .645          .666          .86
SP500          .74           .718          .748          .71           .71           .834
FIDSTKS        .735          .697          .751          .691          .713          .848
INDEXES        .731          .736          .752          .741          .731          .795
SEMI           .715          .706          .775          .793          .801          .844
NASD-100       .707          .727          .787          .757          .777          .848
RUS-1000       .701          .677          .7            .66           .665          .785
GREEN          .695          .695          .695          .695          .695          .695
CHINA          .694          .661          .644          .711          .694          .779
HACKERS        .681          .681          .772          .772          .727          .818
EDU            .666          .666          .666          .5            .666          .666
SOFTWARE       .666          .666          .714          .714          .714          .777
TRANSP         .65           .65           .6            .55           .6            .7
ELECTRON       .648          .641          .703          .703          .728          .79
BIOTECH        .645          .619          .669          .658          .658          .767
RETAIL         .641          .641          .603          .509          .433          .603
COMPUTER       .636          .636          .681          .636          .681          .681
BIG17          .63           .586          .652          .608          .63           .739
BEVERAGE       .611          .611          .611          .611          .611          .666
MILITARY       .58           .483          .548          .516          .548          .709
CHEM           .574          .555          .574          .611          .629          .722
BIGBANKS       .571          0             .571          0             .285          .857
INDMATER       .544          .556          .569          .544          .556          .797
INFRA          .527          .472          .527          .472          .416          .833
AUTO           .512          .461          .435          .384          .358          .589
==========================================================================================
JETS           .5            .5            .3            .3            .4            .5
=========================================================================================
GOLD           .47           .705          .725          .764          .745          .725
GUNS           .47           .47           .529          .47           .411          .588
COMODITY       .439          .512          .56           .585          .56           .585
FOOD           .436          .509          .545          .545          .545          .545
FINANCE        .431          .329          .431          .363          .329          .568
COAL           .428          .428          .428          .428          .428          .428
GAMING         .333          .333          .333          .333          .333          .416
HOSPITAL       .291          .291          .333          .416          .5            .541
REGBANKS       .214          .178          .214          .035          .035          .285
|
=======================================================================
3/27/2019 The DJI's Head/Shoulders has NOT
been completed. So, trust our
Buy signals. The Closing Powers for DIA and QQQ continue to rise. The
all-important A/D Line is still rising. When the fall-out from Brexit is over,
I expect the rush into 10-year Bonds will subside along with all the discussion
about inversions of long and short-term yields. From my research, so long as
short-term
rates stay below 4%, corrections will likely be buying opportunities. All the past
cases of "Inversions" involved te Federal Fund Rates being well above 5% and
rising.
I suspect all the scare-talk about these rates now just serves the needs of JP Morgan and
Friends. But I could be wrong. We do not want to
see a lot of potential head/shoulders,
like Steel's, the DJI's and AAPL's bring breaks below their necklines. Watch
them and the Big Banks' stocks especially.


Stay mostly long. Our PEERLESS B4 and B18-B15 are fighting the very rapid fall of
the rates on the 10-year Bond and the failure of the Fed to lower short-term
rates.
When the 10-year rates drop below the 3-month rates, like now, we have what
is called an "Inversion" of rates. The track-record of this is said
to be bearish.
A lot of publicity is being given this pattern's bearish track record by big banks
like JP Morgan. But they may want to help their bond sales more than their
stock customers. See below link to the standard case for selling stocks now
because of the "Inversion Curve".
https://seekingalpha.com/article/4251080-inverted-yield-curve-important
Here is half of the Problem - the rush into Government 10-yr Bonds.
The other half is that the FED should, but is not, lowering its Federal
Funds Rate.

Hooey!
applesauce
[slang], balderdash, baloney
(also boloney), beans, bilge, blah
(also blah-blah),
blarney, blather, blatherskite, blither, bosh, bull
[slang], bunk,
bunkum (or buncombe),
claptrap, codswallop
[British], crapola [slang], crock, drivel, drool, fiddle, fiddle-faddle,
fiddlesticks, flannel
[British], flapdoodle, folderol
(also falderal), folly, foolishness, fudge,
garbage, guff, hogwash, hokeypokey, hokum, hoodoo, horsefeathers
[slang], humbug,
humbuggery, jazz, malarkey
(also malarky), moonshine, muck, nerts
[slang], nonsense,
nuts,
piffle,
poppycock, punk, rot, rubbish, senselessness, silliness, slush, stupidity, taradiddle
(or tarradiddle), tommyrot, tosh, trash, trumpery, twaddle
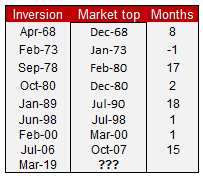
But is the "INVERSION CURVE" reliable and should
it be applied now? I don't think so.
I did some new research on these past inversions. See the table below. In the first
place, the
maximum paper loss from using the inversions on the first of the month after they occur
is whopping 12.7% if one had sold short the DJI. This is way too much for us.
Peerless can
do much better.
Secondly, in each of the previous Inversion cases the Federal Funds Rate was at least
5.05%
and rising. The Federal Funds Rate now is now 2.378% and falling.
Thirdly, none of these "Inversions" since 1968 took place in the year before a
Presidential
Election. This matters because most often the incumbent Party in the White House
pulls out
all the stops to boost the economy and the stockmarket before the Election. The Fed
is also
particularly dovish, too, when that Party happens to be the Republican Party. And
usually,
the party out of power goes to great lengths to boost the economy, too. It wants
some of the
credit for a strong economy.
Fourth, I would suggest that it is Brexit's uncertainty that is the biggest reason that
10-year bonds are being so eagerly bought now and their rates have fallen so fast.
It is not that wealthy folks fear a recession next year. If that were true, I think
that the
market would already be in a big free-fall for fear that the Democrats would win back
the White House and, perhaps, the Senate in 2020. And then re-establish higher
corporate taxes and a lot more government regulations. Take a look at the similar
comments here:
https://www.cnbc.com/2019/03/26/el-erian-no-way-the-us-will-have-a-recession-this-year-or-in-2020.html
| Inversion DJIA |
10-year
Rate |
Fed.
Funds
Rate |
Market
Top |
Months |
%Decline |
Paper
Loss |
Peerless |
| Apr 1 1968 861 |
5.64 |
5.76+.72 |
Dec-68 |
8 |
861-637 |
861-983
-14.2% |
Buy B17 |
Feb 1 1973
986 |
6.64 |
6.58+.64 |
Jan-73 |
-1 |
986-578 |
zero |
4 S9s at
Jan.top |
Sept 1 1978
879 |
8.42 |
8.45+.41 |
Sept-78 |
1 |
879-785 |
879-908
-3.3% |
S9 at top |
Oc 1 1980
939 |
11.75 |
12.81+1.94 |
Apr-81 |
7 |
939-777 |
939-1024
-8.3% |
S15 at
top |
Jan 1 1989
2169 |
9.09 |
9.12 +.36 |
Jul-90 |
18 |
2169-2365
LOSS |
2169-3000
-38.3% |
S9 at top |
Jun 1 1998
8922 |
5.50 |
5.56 +.07 |
Jul-98 |
1 |
8922-7539 |
8922-9338
-4.7% |
S12 just
before top. |
Feb 1 2000
11041 |
6.52 |
5.73 +.28 |
Jan-00 |
-.5 |
11041-7286 |
11041-11723
-6.2% |
S9 at top |
July 1 2006
11191 |
5.09 |
5.24 +.25 |
Oct-07 |
15 |
11191-6547 |
11192-14165
-26.6% |
S4 at top |
https://fred.stlouisfed.org/series/IRLTLT01USM156N
https://fred.stlouisfed.org/series/FEDFUNDS
Charts 3/27/2019
2018 PEERLESS DJI, Signals,
Indicators Daily DJI Volume 10-DayUp/Down Vol
Hourly DJIA A/D Line for All Stocks
Inverted Traders Index
NASDAQ S&P OEX NYSE COMPQX DJI-15 DJI-20 DJI-30
DIA SPY QQQ MDY IWM TNA
Short-Term Rates
USO-CrudeOil DBO FAS GLD BBH IBB JETS JNUG KOL NUGT OIH OIL RSX RETL
SDS AGQ SLV SOXL TECL TLT TMF TNA UGA (gasoline) XIV YINN
Commodities: CANE
CORN DBC JJC, NIB, CHOC CORN, CUT (paper)
MOO, SOYB WEAT UUP (Dollar) LIT
(Lithium)
AAPL ADBE ALXN AMAT AMGN AMD AMZN BA BABA BAC BIDU CAT CVX DE
FB GOOG GS HD IBM INTU JPM M (Macy's) MSFT NFLX NVDA QCOM TSLA TXN
XOM WMT CMG , LRCX, SWKS, MDGL
SPPI WATT SQ TOWN
3/27/19 (Click
on Underlined link.)
Bullish MAXCPs - http://tigersoft.com/MAXCPS/Mar-27/BULLISH.htm
Bearish MAXCPs - http://tigersoft.com/MINCPs/Mar-27/BEARISH.htm
|
Table 1 QUICKSILVER on ETFS - 3/27/19
ETF       CLOSE   CHANGE     PIVOT-PT    5-dmaAROC  CL-PWR     CANDLE IP21 ITRS
---------------------------------------------------------------------------------------------
DIA       256.11   -.35      259.58       -23%     Bearish      RED  .051  ------
---------------------------------------------------------------------------------------------
BA        374.21   3.83      372.7        -26.3%   Bullish      BLUE .117  -.004
---------------------------------------------------------------------------------------------
SPY       279.65   -1.47     284.73       -33.8%   -------      RED  .018   .015
---------------------------------------------------------------------------------------------
QQQ       177.9   -1.15      182.57       -51.8%   Bullish      RED  .073   .045
---------------------------------------------------------------------------------------------
MDY       341.24   -.24      347.42       -21.5%   -------      RED -.041  -.002
---------------------------------------------------------------------------------------------
IWM       151.27   -.59      155.27       -65.4%   -------      RED -.116  -.008
---------------------------------------------------------------------------------------------
FAS       59.88   -.65       63.23        -202.4%  Bearish      RED -.053   .134
---------------------------------------------------------------------------------------------
RETL      29.16    .89       29.02         158.9%  Bearish      BLUE-.275  -.009
---------------------------------------------------------------------------------------------
SOXL      132.18   -6.06     152.45       -211.8%  -------      RED -.024   .4
---------------------------------------------------------------------------------------------
TECL      133.42   -2.21     145.63       -65.7%   Bullish      RED  .079   .453
---------------------------------------------------------------------------------------------
IBB       108.8    -1.53     111.97       -198.4%  -------      RED  .038  -.057
---------------------------------------------------------------------------------------------
GLD       123.65   -.65      123.68       -21.3%   Bearish      RED -.007  -.059
---------------------------------------------------------------------------------------------
OIH       16.99   -.14       17.75        -219.7%  -------      RED -.076  -.033
---------------------------------------------------------------------------------------------
RSX       20.81   -.31       21.47        -141.4%   Bearish     RED  .031  -.027
|
 Table 2   Count of Stocks in Key Directories
           2019-03-27
-------------------------------
NEWHIGHS       139  Bullish
NEWLOWS        15
MAXCP          21
MINCP          16
TTTNH          20
TTTNL          44
FASTUP         29
FASTDOWN       132
CPCROSSA       41
CPCROSSD       146
BIGVOLUP       1
BIGVODN        11
ACCUMVER       4
HIGHIP21       11
HIUPPCT        8
VHIP21         31
LOWACCUM       165
REDSELL        39
AUGSELS7       16
TRAPDOOR       19
|
 Table 3  RANKING OF KEY DIRECTORIES BASED PCT.OF STOCKS ABOVE 65-DMA
              3/27/19
 Bullish = 35
 Bearish - 10
---------------------------------------------------------------------------------------
Directory     Current       day-1         day-2         day-3         day-4         day-5
----------------------------------------------------------------------------------------
BONDFUND       .99           .99           .99           .99           .99           .99
UTILITY        .825          .875          .85           .825          .9            .9
HOMEBLDG       .823          .764          .764          .705          .823          .705
REIT           .798          .825          .751          .738          .852          .765
NIFTY          .789          .842          .807          .824          .877          .894
INSURANC       .766          .766          .7            .666          .766          .7
SOLAR          .764          .705          .823          .823          .823          .882
ETFS           .758          .81           .793          .775          .982          .965
INDEXES        .74           .756          .745          .735          .8            .794
OILGAS         .739          .767          .69           .739          .859          .845
NASD-100       .727          .787          .757          .777          .848          .828
SP500          .718          .748          .71           .71           .832          .81
SEMI           .706          .775          .793          .801          .844          .836
GOLD           .705          .725          .764          .745          .725          .764
FIDSTKS        .697          .751          .691          .713          .843          .854
GREEN          .695          .695          .695          .695          .695          .782
DJI-13         .692          .846          .692          .692          .846          .923
HACKERS        .681          .772          .772          .727          .818          .818
RUS-1000       .677          .7            .658          .666          .784          .754
DOWJONES       .666          .766          .666          .666          .833          .833
EDU            .666          .666          .5            .666          .666          .666
SOFTWARE       .666          .714          .714          .714          .777          .761
SP-100         .666          .752          .645          .666          .849          .86
CHINA          .661          .644          .711          .694          .779          .762
TRANSP         .65           .6            .55           .6            .7            .65
ELECTRON       .641          .703          .703          .728          .79           .796
RETAIL         .641          .603          .509          .433          .603          .584
COMPUTER       .636          .681          .636          .681          .681          .681
BIOTECH        .616          .669          .658          .658          .764          .748
BEVERAGE       .611          .611          .611          .611          .666          .611
BIG17          .586          .652          .608          .63           .739          .739
INDMATER       .556          .569          .544          .556          .797          .759
CHEM           .555          .574          .611          .629          .74           .703
FOOD           .517          .553          .553          .553          .553          .607
COMODITY       .512          .56           .585          .56           .585          .634
===========================================================================================
JETS           .5            .3            .3            .4            .5            .5
===========================================================================================
MILITARY       .483          .548          .516          .548          .709          .709
INFRA          .472          .527          .472          .416          .833          .75
GUNS           .47           .529          .47           .411          .647          .588
AUTO           .461          .435          .384          .358          .589          .461
COAL           .428          .428          .428          .428          .428          .428
FINANCE        .333          .433          .377          .344          .588          .711
GAMING         .333          .333          .333          .333          .416          .416
HOSPITAL       .291          .333          .416          .5            .541          .5
REGBANKS       .178          .214          .035          .035          .321          .357
BIGBANKS       0             .571          0             .285          .857          .857
|
========================================================================
3/26/2019 The PEERLESS B4,
B18-B15 combination should take the DJI
higher. Probably to 27000 by the Summer. But
we will need to see the DJI close
back above its 21-dma soon or else the (green) neckline near 25000 will
have to be tested. A close below the neckline at 25000 would have to be treated
as a Sell S10. It would also show us
that something unexpected and bearish is
troubling the market. Below I ask the question: Why is the Justice Department
switching tracks now so quickly to Obama Care when Trump is in a position to
do more victory laps about the Democrat's failure to prove any "Russia-Gate"?
Is it Brexit and overseas' selling that is causing the DJI now to be down 70? Is
it that passengers don't want to fly the Boeing MAX 747? That shouldn't be
a surprise. Is the vast amount of Debt suddenly a problem now because the inverted
yield curve is causing loans to be called in from fear of a recession?
Or perhaps this will prove a better time to buy. After all. the all-important A/D
Line is
confirming the advance at a rate that matches the bullish parallel case of a March
B18-B15 in 1975. Keep in mind that any DJI
move above the right shoulder apex
at 26300 should motivate the shorts to rush to cover and then we will likely see 27000
in May. But any break below 25000 would
complete a DJI head and shoulders
pattern and have to be used by us to sell and sell short.

Typically the DJI rallies nicely
after March 26th in the 3rd Year
of the Presidential Cycle. See the
data from 1965 - 2018 in our software.
Avg DJI Gain Pct of time DJI Rallies
10 days 1.6%
75%
21days 2.1%
75%
42 days 4.2%
75%
65 days 6.0%
81.3%
While it is true that the DJI and the other indexes could not hold their big early gains
today.
Still, there were nearly 1400 more up than down and the big bank stocks did not fall
further.
The Closing Powers for DIA, SPY and QQQ are still in uptrends. The leading tech stocks
did very well today, thus showing that speculative energies are still very much alive.
See the
QQQ and TECH charts via our links. I especially like the rising trend of our Index
of the "NIFTY" high volume tech stocks, whose chart is shown below.

NIFTY's Niftiest C:\nifty Days back= 62 Top 25 Pct. Gainers since Rally Started.
12 / 24 / 2018 - 3 / 26 / 2019
Rank Symbol Name Price Pct.Gain AI/200
--------- ----------------------------------- ---------- ------------ ---------
1 PAYC Paycom Software Inc 185.71 66% 133
2 ANET Arista Networks Inc 309.8 64% 70
3 XLNX Xilinx Inc 126.63 59% 166
4 AMD Advanced Micro Devices 25.69 54% 137
5 NFLX Netflix Inc 359.97 53% 105
6 RNG RingCentral` Inc. 108.19 53% 137
7 KLAC Kla-Tencor Corp 120.04 47% 111
8 LRCX Lam Research Corp 180.05 46% 64
9 COHR Coherent Inc 136.56 44% 128
10 CREE Cree Incorporated 55.82 44% 137
11 PANW Palo Alto Networks` Inc. 244.2 43% 89
12 ALGN Align Tech Inc 274.27 41% 170
13 SNPS Synopsys Inc 112.4 41% 152
14 INTU Intuit Inc 255.99 40% 161
15 NVDA NVIDIA Corporation 176.87 39% 94
16 MU Micron Technology Inc 40.32 38% 86
17 AMAT Applied Materials Inc 39.63 36% 80
18 ALRM Alarm.com Holdings Inc 62.72 35% 138
19 BABA Alibaba Group Holding Ltd 178.08 35% 100
20 FB Facebook Inc 167.68 35% 89
21 ADI Analog Devices Inc 107.1 33% 135
22 AMZN Amazon-Com Inc 1783.76 32% 122
23 CSCO Cisco Systems Inc 53.23 32% 131
24 ADSK Autodesk Inc 155.91 31% 116
25 CRM Salesforce.com Inc 159.4 31% 149
|
Giving The Democrats Something To Campaign
On:
Why? What's The Problem?
I
Small intra-day pullbacks, like today's are fairly common when the market must eat up
over-head supplies of stock. There does seem to be quite a bit of resistance up to
26000,
but I would trust the bullish seasonality of Spring and the politics of the year before
the Presidential
Election Year along with interest rates that are well below the 4% danger-level. But, as
always, we should be watchful of the market it when it fails to achive our expections.
Trump's Justice Department now wants to throw out all of Obamacare. Health care for all
would
seem to a very strong card for the Democrats. I always thought that Social Security
and
Medicare were the "third rail" of politcs. In other words, he who
threatens to take away these
benefits from seniors and near-seniors could be politically electrocuted.
Just why would Trump give the Democrats a new issue to run with? Why not relax a
little
and let the Democrats squirm a little longer on their failure to prove a link between the
President and the Russian Government in the 2016 Election? That coupled with a
strong
economy could be all he needs in 2020.
It's odd, I've been thinking all day about this. Do they not want to win
because they know
a market Crash is coming? Ideological purity? An out of control Justice
Department?
I don't know. The New York Times raised the very same question tonight. Does
it
mean that the Federal Budget's deficit is ballooning so much that soon we will see more
and
more efforts to cut popular Federal Government spending, possibly in ways that could
back-fire
on Republicans just when they should be able to get lots of credit for a strong economy
and
stock market? Perhaps, this will prevent the usual Spring Rally in this the third
year of the
four-year cycle. Since Insiders will probably
know first, we must watch the Professionals through
our Closing Power and we should probably consider any decline much below the lower band
in the next few weeks to be a bad sign, a sign that the normally bullish Spring
seasonality
is being challenged by something abnormal, bearish and unexpected. .
https://www.nytimes.com/2019/03/26/us/politics/democrats-trump-affordable-care-act.html
Charts 3/25/2019
2018 PEERLESS DJI, Signals,
Indicators Daily DJI Volume 10-DayUp/Down Vol
Hourly DJIA A/D Line for All Stocks
Inverted Traders Index
NASDAQ S&P OEX NYSE COMPQX DJI-15 DJI-20 DJI-30
DIA SPY QQQ MDY IWM TNA
Short-Term Rates
USO-CrudeOil DBO FAS GLD BBH IBB JETS JNUG KOL NUGT OIH OIL RSX RETL
SDS AGQ SLV SOXL TECL TLT TMF TNA UGA (gasoline) XIV YINN
Commodities: CANE
CORN DBC JJC, NIB, CHOC CORN, CUT (paper)
MOO, SOYB WEAT UUP (Dollar) LIT
(Lithium)
AAPL ADBE ALXN AMAT AMGN AMD AMZN BA BABA BAC BIDU CAT CVX DE
FB GOOG GS HD IBM INTU JPM M (Macy's) MSFT NFLX NVDA QCOM TSLA TXN
XOM WMT CMG , LRCX, SWKS, MDGL
SPPI WATT SQ TOWN
3/26/19 (Click
on Underlined link.)
Bullish MAXCPs - http://tigersoft.com/MAXCPS/Mar-26/BULLISH.htm
Bearish MAXCPs - http://tigersoft.com/MINCPs/Mar-26/BEARISH.htm
|
Table 1 QUICKSILVER on ETFS - 3/26/19
ETF       CLOSE   CHANGE     PIVOT-PT    5-dmaAROC  CL-PWR     CANDLE   IP21   ITRS
---------------------------------------------------------------------------------------------
DIA       256.46    1.39     257.29       -47.1%    Bearish      RED   .043    ----
---------------------------------------------------------------------------------------------
BA        370.38   -.08      376.16       -41.1%    -------      RED   .099  -.02
---------------------------------------------------------------------------------------------
SPY       281.12    2.08     281.55       -22.7%    -------      BLUE  .009   .016
---------------------------------------------------------------------------------------------
QQQ       179.05    .83      179.76        0%       Bullish      RED   .09    .045
---------------------------------------------------------------------------------------------
MDY       341.48    3.34     342.71       -60.2%    -------      BLUE -.116  -.005
---------------------------------------------------------------------------------------------
IWM       151.86    1.58     153.26       -101.5%   -------      BLUE -.162  -.012
---------------------------------------------------------------------------------------------
FAS       60.53    1.89      62.34        -364.9%   Bearish      BLUE -.052   .16
---------------------------------------------------------------------------------------------
RETL      28.27    .58       28.27        -124.4%   Bearish      ---- -.276  -.063
---------------------------------------------------------------------------------------------
SOXL      138.24    4.08     138.13       -139.4%   -------      RED  -.01    .397
---------------------------------------------------------------------------------------------
TECL      135.63    2.17     135.22       -35.4%    Bullish      RED   .094   .439
---------------------------------------------------------------------------------------------
IBB       110.33    2.01     113.18       -158.4%   -------      BLUE  .045  -.057
---------------------------------------------------------------------------------------------
GLD       124.3   -.62       124.18        37.1%    -------      RED   .05   -.049
---------------------------------------------------------------------------------------------
OIH       17.13    .22       17.75        -92.2%    -------      ---- -.094  -.023
---------------------------------------------------------------------------------------------
GASL      7.73    .36        8.14          129.2%   -------      --- - .008  -.074
---------------------------------------------------------------------------------------------
RSX       21.12   -.08       21.41        -25.9%   -------       RED   .077  -.016
|
Table 2    Count of Stocks in Key Directories
           2019-03-26
-------------------------------
NEWHIGHS       199   Bullish
NEWLOWS        11
MAXCP          49
MINCP          23
TTTNH          32
TTTNL          34
FASTUP         34
FASTDOWN       130
CPCROSSA       61
CPCROSSD       55
BIGVOLUP       7
BIGVODN        7
ACCUMVER       8
HIGHIP21       9
HIUPPCT        12
VHIP21         33
LOWACCUM       165
REDSELL        40
AUGSELS7       16
TRAPDOOR       18
|
Table 3     RANKING OF KEY DIRECTORIES BASED PCT.OF STOCKS ABOVE 65-DMA
            3/26/19
 Bullish =39
 Bearish = 7
---------------------------------------------------------------------------------------
Directory     Current       day-1         day-2         day-3         day-4         day-5
----------------------------------------------------------------------------------------
BONDFUND       .99           .99           .99           .99           .99           .98
UTILITY        .875          .85           .825          .9            .9            .925
DJI-13         .846          .692          .692          .846          .923          .923
NIFTY          .842          .807          .824          .877          .894          .877
REIT           .825          .751          .738          .852          .765          .758
ETFS           .81           .793          .775          .982          .965          .982
NASD-100       .787          .757          .777          .848          .818          .858
SEMI           .775          .793          .801          .844          .836          .853
HACKERS        .772          .772          .727          .818          .818          .818
DOWJONES       .766          .666          .666          .833          .833          .866
INSURANC       .766          .7            .666          .766          .7            .8
HOMEBLDG       .764          .764          .705          .823          .705          .764
OILGAS         .762          .685          .734          .853          .832          .783
INDEXES        .758          .741          .731          .795          .79           .811
SP-100         .752          .645          .666          .849          .838          .881
FIDSTKS        .751          .691          .713          .843          .843          .875
SP500          .748          .71           .71           .832          .806          .855
GOLD           .725          .764          .745          .725          .764          .666
SOFTWARE       .714          .714          .714          .777          .761          .809
SOLAR          .705          .823          .823          .823          .882          .941
ELECTRON       .703          .703          .728          .79           .796          .802
RUS-1000       .7            .658          .665          .785          .753          .803
GREEN          .695          .695          .695          .695          .782          .826
COMPUTER       .681          .636          .681          .681          .681          .681
BIOTECH        .666          .658          .658          .764          .743          .759
EDU            .666          .5            .666          .666          .666          .666
BIG17          .652          .608          .63           .739          .739          .76
CHINA          .644          .711          .694          .779          .762          .796
BEVERAGE       .611          .611          .611          .666          .611          .666
RETAIL         .603          .509          .433          .603          .584          .716
TRANSP         .6            .55           .6            .7            .65           .7
CHEM           .574          .611          .629          .74           .722          .722
BIGBANKS       .571          0             .285          .857          .857          1
INDMATER       .569          .544          .556          .797          .759          .759
COMODITY       .56           .585          .56           .585          .634          .609
FOOD           .553          .553          .553          .553          .607          .571
MILITARY       .548          .516          .548          .709          .709          .709
GUNS           .529          .47           .411          .647          .588          .588
INFRA          .527          .472          .416          .833          .75           .805
==============================================================================================
AUTO           .435          .384          .358          .589          .461          .564
FINANCE        .433          .366          .344          .588          .722          .877
COAL           .428          .428          .428          .428          .428          .428
GAMING         .333          .333          .333          .416          .416          .416
HOSPITAL       .333          .416          .5            .541          .5            .5
JETS           .3            .3            .4            .5            .5            .5
REGBANKS       .214          .035          .035          .321          .357          .857
|
========================================================================
3/25/2019 We should be
buyers of DIA, SPY and QQQ again. Seasonality is
short-term now very bullish. The Closing Powers for DIA, SPY and QQQ are still
rising.
I would rate Peerless as very bullish, especially when you look at how many ways the
charts of March 1975 and March March 2019 look alike. Peerless is still operating
under
a reliable and quite B4, B18-B15 combination. Usually when this Peerless
combination, the B18-B15 buy signals, is at work in March, the DJI is making 12 month
highs. But there are two exceptions, now and that of March 1975. The earlier
instance
turned out to have been an excellent place to Buy. We should not that now.
It's true that there was no interest rate "inversion" back then. Rates were
then simply coming
down from very high levels. It's also true that 1974 represented the end of a long
24-month
bear market. But the similarities between March 1975 and
March 2019 are striking, Both had
January take-offs. Both had B18-B15s as of March. Both showed potential
up-sloping Head and Shoulders that were never completed! And most important, both
benefitted from the same strongly bullish seasonality of occurring in the third year of
the four
year cycle. In addition, their OBV had already made 9-month new highs in March.
Compare the Peerless charts of March 1975 and March
2019 just below.
1975


2019


The Closing Powers for DIA, SPY and QQQ are still in
rising trends.


Let's see if Big Banks can turn up soon.
That could become quite bullish. As I've
said, short-term interest rates may fall to get
back below the 10-year rates. With Inflation
so low, I can't see the 10-year rates falling much
lower.

Charts 3/25/2019
2018 PEERLESS DJI, Signals,
Indicators Daily DJI Volume 10-DayUp/Down Vol
Hourly DJIA A/D Line for All Stocks
Inverted Traders Index
NASDAQ S&P OEX NYSE COMPQX DJI-15 DJI-20 DJI-30
DIA SPY QQQ MDY IWM TNA
Short-Term Rates
USO-CrudeOil DBO FAS GLD BBH IBB JETS JNUG KOL NUGT OIH OIL RSX RETL
SDS AGQ SLV SOXL TECL TLT TMF TNA UGA (gasoline) XIV YINN
Commodities: CANE
CORN DBC JJC, NIB, CHOC CORN, CUT (paper)
MOO, SOYB WEAT UUP (Dollar) LIT
(Lithium)
AAPL ADBE ALXN AMAT AMGN AMD AMZN BA BABA BAC BIDU CAT CVX DE
FB GOOG GS HD IBM INTU JPM M (Macy's) MSFT NFLX NVDA QCOM TSLA TXN
XOM WMT CMG , LRCX, SWKS, MDGL
SPPI WATT SQ TOWN
3/25/19 (Click
on Underlined link.)
Bullish MAXCPs - http://tigersoft.com/MAXCPS/Mar-25/BULLISH.htm
Bearish MAXCPs - http://tigersoft.com/MINCPs/Mar-25/BEARISH.htm
|
Table 1 QUICKSILVER on ETFS - 3/25/19
ETF       CLOSE   CHANGE     PIVOT-PT    5-dmaAROC  CL-PWR     CANDLE  IP21   ITRS
---------------------------------------------------------------------------------------------
DIA       255.07    .11      258.88        -76%     Bearish      BLUE .013   -----
---------------------------------------------------------------------------------------------
BA        370.46   8.29      373.43       -24.5%    -------      BLUE .097  -.012
---------------------------------------------------------------------------------------------
SPY       279.04   -.21      282.4        -58.3%    Bearish      BLUE-.038   .015
---------------------------------------------------------------------------------------------
QQQ       178.22   -.34      179.05       -6.4%     Bullish      BLUE .067   .042
---------------------------------------------------------------------------------------------
MDY       338.14    .8       345.6        -134.1%   Bearish      BLUE-.148  -.008
---------------------------------------------------------------------------------------------
IWM       150.28    .66      154.96       -177.9%   Bearish      BLUE-.197  -.017
---------------------------------------------------------------------------------------------
FAS       58.64   -.46       65.03        -605.2%   Bearish      RED -.13   .131
---------------------------------------------------------------------------------------------
RETL      27.69    .94       28.97        -305.4%   Bearish      BLUE-.29  -.062
---------------------------------------------------------------------------------------------
SOXL      134.16   -5.32     142.18       -96.2%    -------      RED -.045   .4
---------------------------------------------------------------------------------------------
TECL      133.46   -1.53     136.6        -92.2%    Bullish      RED  .058   .414
---------------------------------------------------------------------------------------------
IBB       108.32    .15      113.85       -249.5%   -------      RED  .036  -.068
---------------------------------------------------------------------------------------------
GLD       124.92    .95      123.38        76%      -------      BLUE .031  -.035
---------------------------------------------------------------------------------------------
OIH       16.91   -.04       17.45        -177.3%   Bearish      BLUE-.065  -.038
---------------------------------------------------------------------------------------------
RSX       21.2    .3         21.23        -23.5%   -------       BLUE .076  -.012
|
 Table 2   Count of Stocks in Key Directories
           20190325
-------------------------------
NEWHIGHS       151   Bullish
NEWLOWS        26
MAXCP          33
MINCP          19
TTTNH          24
TTTNL          38
FASTUP         32
FASTDOWN       199
CPCROSSA       55
CPCROSSD       71
BIGVOLUP       5
BIGVODN        6
ACCUMVER       9
HIGHIP21       9
HIUPPCT        9
VHIP21         34
LOWACCUM       170
REDSELL        35
AUGSELS7       12
TRAPDOOR       20
|
Table 3    RANKING OF KEY DIRECTORIES BASED PCT.OF STOCKS ABOVE 65-DMA
              3/25/19
 Bullish = 35
 Bearish = 10
---------------------------------------------------------------------------------------
Directory     Current       day-1         day-2         day-3         day-4         day-5
----------------------------------------------------------------------------------------
BONDFUND       .99           .99           .99           .99           .98           .98
UTILITY        .85           .825          .9            .9            .9            .925
SOLAR          .823          .823          .823          .882          .941          .941
NIFTY          .807          .824          .877          .894          .877          .894
ETFS           .793          .775          .982          .965          .982          .948
SEMI           .793          .801          .844          .836          .853          .853
HACKERS        .772          .727          .818          .818          .818          .909
GOLD           .764          .745          .725          .764          .686          .666
HOMEBLDG       .764          .705          .823          .705          .764          .764
NASD-100       .757          .777          .848          .818          .858          .868
REIT           .751          .738          .852          .765          .758          .778
INDEXES        .741          .731          .795          .79           .806          .774
SOFTWARE       .714          .714          .777          .761          .809          .841
CHINA          .711          .694          .779          .762          .796          .796
SP500          .71           .71           .832          .806          .853          .848
ELECTRON       .703          .728          .79           .796          .802          .808
INSURANC       .7            .666          .766          .7            .8            .8
GREEN          .695          .695          .695          .782          .826          .826
DJI-13         .692          .692          .846          .923          .923          .846
FIDSTKS        .691          .713          .843          .843          .875          .875
OILGAS         .69           .739          .859          .838          .781          .823
DOWJONES       .666          .666          .833          .833          .866          .833
RUS-1000       .658          .665          .784          .754          .802          .81
BIOTECH        .656          .658          .764          .743          .753          .74
SP-100         .645          .666          .849          .838          .881          .87
COMPUTER       .636          .681          .681          .681          .681          .681
BEVERAGE       .611          .611          .666          .611          .666          .666
CHEM           .611          .629          .74           .722          .759          .74
BIG17          .608          .63           .739          .739          .76           .782
COMODITY       .585          .56           .585          .634          .609          .585
FOOD           .553          .553          .553          .607          .571          .553
TRANSP         .55           .6            .7            .65           .7            .75
INDMATER       .544          .556          .797          .759          .784          .784
MILITARY       .516          .548          .709          .709          .709          .709
RETAIL         .509          .433          .603          .584          .716          .641
==========================================================================================
EDU            .5            .666          .666          .666          .666          .666
==========================================================================================
INFRA          .472          .416          .833          .75           .805          .833
GUNS           .47           .411          .647          .588          .647          .647
COAL           .428          .428          .428          .428          .428          .428
HOSPITAL       .416          .5            .541          .5            .5            .5
AUTO           .384          .358          .589          .461          .564          .564
FINANCE        .366          .333          .588          .722          .877          .9
GAMING         .333          .333          .416          .416          .416          .416
JETS           .3            .4            .5            .5            .5            .5
REGBANKS       .035          .035          .321          .357          .857          .964
BIGBANKS       0             .285          .857          .857          1             1
|
======================================================================
3/22/2019 Peerless is still
operating under a reliable B4, B18-B15 combination.
But short-term, more weakness has to be expected because all the ETFs shown in
Table 1 below have falling or "bearish" Closing Powers and/or Candle-sticks.
Moreover, a completed head and shoulders pattern with a DJI close below 25000 would
have to be accorded a Sell S10. Such S10 signals should be judged to be on the safe
side, even if there is no automatic Peerless Sell. The reasons for this are:
1) Head/shoulders patterns are reliable. 2) We saw many, many Sell S9s last year.
So, some serious strains and stresses have been put into the market. 3) H/S patterns
tell us that the market is quickly absorbing some unexpected bad news. 4) The DJI
has not had a 20% decline since the one that ended on March 7th, 2009. Only the
1947-1959 bull market lasted longer. A Republican President also brought that
one to
pass. He was much helped by short-term interest rates that stayed below 4% except
just before the DJI's 19% decline in the Fall of 1957 was starting.

Now we are told that the 10-year rates have dropped
below the 3-month rates.
Inversions do have a bearish track record. Lots of traders know this. And, if
fact,
the 10-year bonds have fallen rapidly this past week. There is a quick exiting
of big money into bonds when they consider stocks unsafe. But another factor should
be considered, namely just how low short-term rates are. That, it seems from what I have
studied, is inherently bullish. Locking in a 2.5% rate at a time when the CPI is
rising just as
fast, is no great bargain. Stocks in this environment, I believe, will remain
attractive
and should not be sold too quickly, especially in the bullish seasonal period we are still
in.
But we should watch QQQ's Closing Power. It topped out
more than two months
after the DJI did in 2000. As long as its Closing Power is rising, I would assume
there
is more upside potential for tech stocks. The DJI, on the other hand, has Boeing's
problems to contend with, but even BA is looking better now that it has fallen to its
200-day
ma and Professionals remain surprisingly Bullish. See QQQ and BA below. So,
I suspect will see a turnaround to the upside later this week.


What could change my optimism that the Peerless buy
signals will still work out
due to the past bullish seasonality until May would be more big volume down-days by the
bank stocks. Unpaid Debt and Massive Consumer and Corporate Debt is a real
problem now. BAC has just had a serious breakdown. Now we must watch
CitiGroup.
Where the big banks as a group go, so does the DJI usually.
C is at key support.

BAC seems to have broken down.

---------------------------------------------------------------------------------------
Peerless Update - March 2019 - After a lot of thought
and nudging by some of you, I have
revised Peerless as of Sunday to show a Oct-Dec Buy B16 when the DJI drops almost
20% on December 24th last year. As set up now, this worked our profitably every
time.
I delayed the S12 on the rally in January until the DJI was more than 2% above the 21-day
ma. This had not adverse effect on the Peerless track record. And I raised from
2.35% to
2.45% the upper band for the S9Vs that were triggered last Summer. This helped in
July's
case but prevented April's valid S9V. Email me if
you want this update for $85. It has been
posted on the ESP Page.
----------------------------------------------------------------------------------------
Charts 3/22/2019
2018 PEERLESS DJI, Signals,
Indicators Daily DJI Volume 10-DayUp/Down Vol
Hourly DJIA A/D Line for All Stocks
Inverted Traders Index
NASDAQ S&P OEX NYSE COMPQX DJI-15 DJI-20 DJI-30
DIA SPY QQQ MDY IWM TNA
Short-Term Rates
USO-CrudeOil DBO FAS GLD BBH IBB JETS JNUG KOL NUGT OIH OIL RSX RETL
SDS AGQ SLV SOXL TECL TLT TMF TNA UGA (gasoline) XIV YINN
Commodities: CANE
CORN DBC JJC, NIB, CHOC CORN, CUT (paper)
MOO, SOYB WEAT UUP (Dollar) LIT
(Lithium)
AAPL ADBE ALXN AMAT AMGN AMD AMZN BA BABA BAC BIDU CAT CVX DE
FB GOOG GS HD IBM INTU JPM M (Macy's) MSFT NFLX NVDA QCOM TSLA TXN
XOM WMT CMG , LRCX, SWKS, MDGL
SPPI WATT SQ TOWN
3/22/19 (Click
on Underlined link.)
Bullish MAXCPs - http://tigersoft.com/MAXCPS/Mar-22/BULLISH.htm
Bearish MAXCPs - http://tigersoft.com/MINCPs/Mar-22/BEARISH.htm
|
Table 1 QUICKSILVER on ETFS - 3/22/19
All Closing Powers are marked Bearish and Candle-Sticks are RED.
ETF       CLOSE   CHANGE     PIVOT-PT    5-dmaAROC  CL-PWR   CANDLE  IP21   ITRS
---------------------------------------------------------------------------------------------
DIA       254.96   -4.62     258.99       -65.3%    Bearish      RED  .025   -----
---------------------------------------------------------------------------------------------
BA        362.17   -10.53    372.28       -224.4%   -------      RED  .082  -.014
---------------------------------------------------------------------------------------------
SPY       279.25   -5.48     282.33       -36.5%    Bearish      RED -.006   .015
---------------------------------------------------------------------------------------------
QQQ       178.56   -4.01     178.45        5.8%     -------      RED  .076   .043
---------------------------------------------------------------------------------------------
MDY       337.34   -10.08    347.37       -107.2%   Bearish      RED -.121  -.007
---------------------------------------------------------------------------------------------
IWM       149.62   -5.65     155.75       -166%     Bearish      RED -.178  -.02
---------------------------------------------------------------------------------------------
FAS       59.1   -4.13       66.29        -470.4%   Bearish      RED -.109   .151
---------------------------------------------------------------------------------------------
RETL      26.75   -2.27      29.43        -366.6%   Bearish      RED -.283  -.15
---------------------------------------------------------------------------------------------
SOXL      139.48   -12.97    136.89        59.7%    -------      RED  .013   .497
---------------------------------------------------------------------------------------------
TECL      134.99   -10.64    136           23.3%    -------      RED  .095   .446
---------------------------------------------------------------------------------------------
IBB       108.17   -3.8      113.92       -265.8%   -------      RED  .034  -.061
---------------------------------------------------------------------------------------------
RSX       20.9   -.57        21.3          7.1%     Bearish      RED  .041  -.025
|
 Table 2   Count of Stocks in Key Directories
          20190322
-------------------------------
NEWHIGHS       121
NEWLOWS        43
MAXCP          30
MINCP          29
TTTNH          17
TTTNL          58
FASTUP         33
FASTDOWN       159
CPCROSSA       20
CPCROSSD       507 heavy professional sellin
BIGVOLUP       2
BIGVODN        19
ACCUMVER       17
HIGHIP21       8
HIUPPCT        8
VHIP21         33
LOWACCUM       180
REDSELL        28
AUGSELS7       16
TRAPDOOR       22
|
Table 3 RANKING OF KEY DIRECTORIES BASED PCT.OF STOCKS ABOVE 65-DMA
              3/22/19
Bullish =35
Bearish =10
---------------------------------------------------------------------------------------
Directory     Current       day-1         day-2         day-3         day-4         day-5
----------------------------------------------------------------------------------------
BONDFUND       .99           .99           .99           .98           .98           .98
UTILITY        .825          .9            .9            .9            .925          .925
NIFTY          .824          .877          .894          .877          .894          .912
SOLAR          .823          .823          .882          .941          .941          .941
SEMI           .801          .844          .836          .853          .853          .836
NASD-100       .777          .848          .818          .858          .868          .858
ETFS           .775          .982          .965          .982          .965          .913
GOLD           .745          .725          .764          .686          .666          .725
REIT           .738          .852          .765          .758          .778          .778
INDEXES        .736          .795          .79           .806          .774          .784
OILGAS         .734          .853          .832          .776          .811          .734
ELECTRON       .728          .79           .796          .802          .808          .796
HACKERS        .727          .818          .818          .818          .909          .863
SOFTWARE       .714          .777          .761          .809          .825          .809
FIDSTKS        .713          .843          .843          .875          .875          .87
SP500          .71           .832          .806          .853          .848          .846
HOMEBLDG       .705          .823          .705          .764          .764          .764
GREEN          .695          .695          .782          .826          .826          .826
CHINA          .694          .779          .762          .796          .796          .83
DJI-13         .692          .846          .923          .923          .846          .923
COMPUTER       .681          .681          .681          .681          .681          .681
DOWJONES       .666          .833          .833          .866          .833          .866
EDU            .666          .666          .666          .666          .666          .666
INSURANC       .666          .766          .7            .8            .8            .8
SP-100         .666          .849          .838          .881          .87           .86
RUS-1000       .665          .784          .753          .803          .811          .797
BIOTECH        .656          .764          .743          .753          .732          .711
BIG17          .63           .739          .739          .76           .782          .739
CHEM           .629          .74           .722          .759          .759          .722
BEVERAGE       .611          .666          .611          .666          .666          .722
TRANSP         .6            .7            .65           .7            .75           .75
COMODITY       .56           .585          .634          .609          .585          .56
INDMATER       .556          .797          .759          .784          .784          .772
FOOD           .553          .553          .607          .571          .553          .535
MILITARY       .548          .709          .709          .709          .709          .709
HOSPITAL       .5            .541          .5            .5            .5            .458
-----------------------------------------------------------------------------------------------
RETAIL         .433          .603          .584          .716          .641          .641
COAL           .428          .428          .428          .428          .428          .428
INFRA          .416          .833          .75           .805          .833          .777
GUNS           .411          .647          .588          .647          .647          .647
JETS           .4            .5            .5            .5            .5            .5
AUTO           .358          .589          .461          .564          .564          .538
FINANCE        .333          .577          .722          .877          .9            .888
GAMING         .333          .416          .416          .416          .416          .5
BIGBANKS       .285          .857          .857          1             1             1
REGBANKS       .035          .321          .357          .857          .964          .964
|
====================================================================
3/21/2019 The Peerless B4, B19 and B15
signals have not been reversed
but the DJI remains unable to break above its resistance at approximately 26300
and the concerns about Boeing's degree of culpability for 2 major plane
crashes in just a few months keeps growing and keeps all it 747 MAX planes
grounded. Because BA will exert a disproprtionate effect on the DJI-30, I
suggest
we watch the A/D Line uptrend and the Closing Power uptrendlines for QQQ
and SPY especially closely. We were sellers of IWM and SOXL today. So,
now we should be waiting for a retreat in them to buy again. The tech sector may
conveniently retreat a little now for a few days.

The SP-500 stocks made a recovery high today.
So did their own A/D Line. 83% are above the
support of their 65-dma. Support should be strong.

QQQ's Closing Power remains in a clear uptrend, Perhaps,
a little overbought, but probably in no danger. This casts a
bullish light on the strongest sectors, the big high techs
represented by our "Nifty" stocks, SOXL and TECL.

Watch The Number of New Lows
and The Weakest Sectors.
How the market reacts to news is always
important. The FED's keeping
interest rates unchanged can be seen as bullish because low interest rates help
make stocks attractive, but low rates also can be seen as bearish if the economy is
weakening much more than was expected.
There is a growing divide between the bulls and bears.
To the extent that high
techs are strong, we see great confidence in the more risky, high growth sector.
The strength in the great high-techs, particularly in our "NIFTY", SOXL and
TECL, shows lots of confidence among the bulls now. Their indexes made new
highs today. So did, the OEX and SP-500. All their Closing Powers are
uptrending.
But clearly, profit-taking and lower volume is blunting their ability to rally
straight-up.
and eat up the remaining resistance overhead. "
What we should know is that in 2000 and 2007, these high techs and the SP-500
topped out later than the DJI. In fact, they only started to sell off at their own
tops when QQQ broke its price and Closing Power uptrendlines. So watch the QQQ.
What we also have to worry about are that the laggard groups
will start breaking down
and diverge even more widely from the nifty high techs. Will a decline now make
more of the laggards breakdown? That will worry the bulls. But not enough yet,
to cause a big
decline. Watch also for air-pockets in individual stocks. And, of course, more
head and shoulders tops. So, far there are not many of either.
 |
 |
 |
 |
 |
Table 1 QUICKSILVER on ETFS - 3/21/19
ETF       CLOSE   CHANGE     PIVOT-PT    5-dmaAROC  CL-PWR   CANDLE  IP21   ITRS
---------------------------------------------------------------------------------------------
DIA       259.58    2.29     258.34        39.5%   -------      BLUE  .104   -----
---------------------------------------------------------------------------------------------
BA        372.7    -3.46     378.99       -8%      Bullish      RED   .117   .003
---------------------------------------------------------------------------------------------
SPY       284.73    3.18     281.31        63.4%   -------      BLUE  .079   .018
---------------------------------------------------------------------------------------------
QQQ       182.57    2.81     178.35        164.2%   -------     BLUE .184   .053
---------------------------------------------------------------------------------------------
MDY       347.42    4.71     344.75        30.4%   Bearish      BLUE -.018   .012
---------------------------------------------------------------------------------------------
IWM       155.27    2.01     154.76        29.8%   Bearish      BLUE -.095   .004
---------------------------------------------------------------------------------------------
FAS       63.23    .89       65.16        -81.2%   Bearish      BLUE -.03    .234
---------------------------------------------------------------------------------------------
SOXL      152.45    14.32    137.79        938.3%  -------      BLUE  .057   .75
                                           ^^^^^^                                  ^^^^
---------------------------------------------------------------------------------------------
TECL      145.63    10.41    134.35        592.7%   Bullish     BLUE  .212   .6
                                                                      ^^^^^
---------------------------------------------------------------------------------------------
IBB       111.97   -1.21     114.2        -44.9%   -------      BLUE  .083  -.042
---------------------------------------------------------------------------------------------
GLD       123.68   -.5       122.97        51.5%    Bearish     RED  -.058   -.073
---------------------------------------------------------------------------------------------
OIH       17.75    0         16.99         181.4%   -------     ---- -.073   .023
---------------------------------------------------------------------------------------------
RSX       20.73    .19       20.47         99.9%    -------     BLUE .075  -.073
|
 Table 2   Count of Stocks in Key Directories
           20190321
-------------------------------
NEWHIGHS       268  Bullish
NEWLOWS        17
MAXCP          67
MINCP          9
TTTNH          44
TTTNL          13
FASTUP         76
FASTDOWN       58
CPCROSSA       231
CPCROSSD       27
BIGVOLUP       4
BIGVODN        15
ACCUMVER       15
HIGHIP21       11
HIUPPCT        10
VHIP21         33
LOWACCUM       172
REDSELL        35
AUGSELS7       16
TRAPDOOR       22
|
 RANKING OF KEY DIRECTORIES BASED PCT.OF STOCKS ABOVE 65-DMA
3/21/19
---------------------------------------------------------------------------------------
Directory     Current       day-1         day-2         day-3         day-4         day-5
----------------------------------------------------------------------------------------
BONDFUND       .99           .99           .98           .98           .98           .98
ETFS           .982          .965          .982          .965          .913          .844
UTILITY        .9            .9            .9            .925          .925          .95
NIFTY          .877          .894          .877          .894          .912          .877
BIGBANKS       .857          .857          1             1             1             1
OILGAS         .853          .832          .776          .811          .734          .755
REIT           .852          .765          .758          .778          .778          .798
SP-100         .849          .838          .881          .87           .86           .86
NASD-100       .848          .818          .858          .868          .868          .818
DJI-13         .846          .923          .923          .846          .923          .923
SEMI           .844          .836          .853          .853          .836          .836
FIDSTKS        .843          .843          .875          .875          .87           .854
DOWJONES       .833          .833          .866          .833          .866          .866
INFRA          .833          .75           .805          .833          .777          .777
SP500          .832          .806          .853          .848          .848          .84
HOMEBLDG       .823          .705          .764          .764          .764          .882
SOLAR          .823          .882          .941          .941          .941          .941
HACKERS        .818          .818          .818          .909          .863          .818
INDMATER       .797          .759          .784          .784          .759          .759
INDEXES        .795          .79           .806          .774          .784          .784
ELECTRON       .79           .796          .802          .808          .796          .802
RUS-1000       .784          .753          .802          .812          .798          .797
CHINA          .779          .762          .796          .796          .83           .762
SOFTWARE       .777          .761          .809          .825          .809          .793
INSURANC       .766          .7            .8            .8            .8            .766
BIOTECH        .761          .743          .753          .732          .711          .708
CHEM           .74           .722          .759          .759          .74           .759
BIG17          .739          .739          .76           .782          .739          .695
GOLD           .725          .764          .686          .666          .725          .725
MILITARY       .709          .709          .709          .709          .709          .741
TRANSP         .7            .65           .7            .75           .75           .75
GREEN          .695          .782          .826          .826          .826          .826
COMPUTER       .681          .681          .681          .681          .681          .727
BEVERAGE       .666          .611          .666          .666          .722          .611
EDU            .666          .666          .666          .666          .666          .666
GUNS           .647          .588          .647          .647          .647          .647
RETAIL         .603          .584          .716          .641          .641          .584
AUTO           .589          .461          .564          .564          .538          .487
COMODITY       .585          .634          .609          .585          .56           .585
FINANCE        .577          .722          .877          .9            .888          .877
FOOD           .553          .607          .571          .553          .535          .5
HOSPITAL       .541          .5            .5            .5            .458          .458
JETS           .5            .5            .5            .5            .5            .5
COAL           .428          .428          .428          .428          .428          .571
GAMING         .416          .416          .416          .416          .5            .416
REGBANKS       .321          .357          .857          .964          .964          .928
|
====================================================================
3/20/2019 The Peerless B4, B19 and
B15 signals have not been reversed.

Because interest rates are low and not threatening to rise above 3%, I think we
should believe that there is more upside, if not in the DJI then in the strongest
sectors and ETFs. As long as the Closing Powers for SOXL, TECL and QQQ
have been rising, I have said to hold them or sell them on strength.
But today SOXL has slightly broken its steep CP uptrend, so take profits in it. IWM,
which I suggested buying in place of the DJI has become more problematic. Its
Accumulation Index has now fallen into negative territory and its Closing Power uptrend
has been replaced by a new declining trend. I think prudent traders have to sell it.
Still
very bullish are QQQ, TQQQ and TECL. If there is a decline, these are the ETFs I
would
buy when a bounce is signalled.
Bank stocks endured a lot of selling. They usually turn with the DJI. So, this
poses
a short term problem. Regional banks are probably selling off because flat interest
rates do not offer the banks an excuse to raise their rates on consumers! Talk of a
slow-down
in the economy hit auto-makers particularly hard. We will show them tomorrow night.


Note in the ETF charts today, that we see red and now blue optimized
Buys and Sells. The red shows the signal from the best system for the
last year. The blue arrows show the Buys and Sells from the second
best system. The idea here is that if both signals are in accord, they
are more likely to be right.
The IP21 in IWM has gone from above +.50 to negative territory in
less than 5 weeks. This is does not happen often. I will test such occurrences
and report back the results in a day or two. A quickening of the decline of
the IP21 is bearish. And as you know, the dropping by the IP21-AI below
its 21-dma after a steep advance is a warning of a top. Let me focus on the
significance of these developments going back to 2000 tomorrow night.

Banks Stocks Usually Move with Peerless
So more weakness from C, JPM and GS would be of concern.
If the more gradual Closing Power uptrends are violated, the DIA
would likely need to re-test 25000.
Today the Fed warned that the economy may be somehat weaker than they had expected.
This should
surprise no one. The last Jobs Report was a "feeble" +20,000.
Presumably, some of
the weakness owed to Trump's delay in signing the Federal Budget. At the least, more
than one low number is needed to discern a downtrend here. Still, the Fed's new
concern
about the US economy dropped the Dollar below its 21-day ma. and that caused a drop
in the big banks stocks today because they fear "hot international money" might
leave the US if
the Dollar should start a downtrend. The FED is now officially saying that they will
probably hold
steady interest rates until 2020.
Monthly Jobs Reports.
|
|
| Year |
Jan |
Feb |
Mar |
Apr |
May |
Jun |
Jul |
Aug |
Sep |
Oct |
Nov |
Dec |
| 2009 |
-783 |
-742 |
-803 |
-694 |
-344 |
-465 |
-341 |
-184 |
-242 |
-198 |
12 |
-269 |
| 2010 |
3 |
-92 |
180 |
237 |
534 |
-136 |
-88 |
-5 |
-64 |
269 |
123 |
74 |
| 2011 |
20 |
213 |
232 |
321 |
95 |
235 |
61 |
122 |
236 |
204 |
132 |
204 |
| 2012 |
355 |
262 |
238 |
83 |
99 |
72 |
153 |
170 |
189 |
158 |
158 |
237 |
| 2013 |
195 |
279 |
136 |
192 |
224 |
181 |
105 |
242 |
189 |
225 |
267 |
67 |
| 2014 |
177 |
168 |
250 |
327 |
221 |
324 |
227 |
188 |
311 |
258 |
286 |
269 |
| 2015 |
213 |
248 |
77 |
300 |
319 |
170 |
293 |
122 |
133 |
339 |
235 |
280 |
| 2016 |
90 |
232 |
234 |
211 |
15 |
282 |
336 |
135 |
270 |
128 |
170 |
215 |
| 2017 |
252 |
141 |
127 |
213 |
128 |
229 |
204 |
187 |
18 |
260 |
220 |
174 |
| 2018 |
171 |
330 |
182 |
196 |
270 |
262 |
178 |
282 |
108 |
277 |
196 |
227 |
| 2019 |
311(P) |
20(P) |
|
|
|
|
|
|
|
|
|
|
| P : preliminary |
GS failed its marginal breakout today.
It is sitting on its price uptrend.
Its Closing Power is forming a head/shoulders

JPM was turned back downward by the resistance at
the top of its price-channel. More weakness by its Closing Power
would add to the bearishness of its Red Sell and now negative
ITRS and IP21. That JPM cannot gain some traction here
is a warning that there is a lot of Debt that may not be paid off.
That is the biggest over-hanging cloud for the American markets
and elsewhere, too.

Charts 3/20/2019
2018 PEERLESS DJI, Signals,
Indicators Daily DJI Volume 10-DayUp/Down Vol
Hourly DJIA A/D Line for All Stocks
Inverted Traders Index
NASDAQ S&P OEX NYSE COMPQX DJI-15 DJI-20 DJI-30
DIA SPY QQQ MDY IWM TNA
Short-Term Rates
USO-CrudeOil DBO FAS GLD BBH IBB JETS JNUG KOL NUGT OIH OIL RSX RETL
SDS AGQ SLV SOXL TECL TLT TMF TNA UGA (gasoline) XIV YINN
Commodities: CANE
CORN DBC JJC, NIB, CHOC CORN, CUT (paper)
MOO, SOYB WEAT UUP (Dollar) LIT
(Lithium)
AAPL ADBE ALXN AMAT AMGN AMD AMZN BA BABA BAC BIDU CAT CVX DE
FB GOOG GS HD IBM INTU JPM M (Macy's) MSFT NFLX NVDA QCOM TSLA TXN
XOM WMT CMG , LRCX, SWKS, MDGL
SPPI WATT SQ TOWN
3/20/19 (Click
on Underlined link.)
Bullish MAXCPs - http://tigersoft.com/MAXCPS/Mar-20/BULLISH.htm
Bearish MAXCPs - http://tigersoft.com/MINCPs/Mar-20/BEARISH.htm
|
Table 1 QUICKSILVER on ETFS - 3/20/19
ETF       CLOSE   CHANGE     PIVOT-PT    5-dmaAROC  CL-PWR   CANDLE  IP21   ITRS
---------------------------------------------------------------------------------------------
DIA       257.29   -1.59     257.54       -1.2%    Bearish      RED   .089    ----
---------------------------------------------------------------------------------------------
BA    376.16    2.73         373.3        -13.1%   Bullish      BLUE  .158   .053
---------------------------------------------------------------------------------------------
SPY       281.55   -.85      281.16        3.7%    Bearish      RED   .057   .014
---------------------------------------------------------------------------------------------
QQQ       179.76    .71      176.71        77.3%   Bullish      BLUE  .136   .044
---------------------------------------------------------------------------------------------
MDY       342.71   -2.89     345.32       -43.8%   Bearish      RED  -.03    .013
---------------------------------------------------------------------------------------------
IWM       153.26   -1.7      154.35       -55.5%   Bearish      RED  -.109   .005
---------------------------------------------------------------------------------------------
FAS       62.34   -2.69      64.28        -98.6%   Bearish      RED  -.033   .233
---------------------------------------------------------------------------------------------
RETL      28.27   -.7        29.09        -374.6%  Bearish      RED -.223  -.072
------------------------------------------------------------------- --------------------------
SOXL      138.13   -4.05     126.86        337%    -------      RED  .004   .55
---------------------------------------------------------------------------------------------
TECL      135.22   -1.38     129.7         234%    Bullish      RED  .164   .519
---------------------------------------------------------------------------------------------
IBB       113.18   -.67      112.99       -5.3%    -------      RED  .02   -.025
---------------------------------------------------------------------------------------------
RSX       21.41    .18       20.62         183.9%  Bullish      BLUE .05  -.007
|
    Count of Stocks in Key Directories
Table 2          20190320
-------------------------------
NEWHIGHS       116
NEWLOWS        24
MAXCP          27
MINCP          18
TTTNH          23
TTTNL          40
FASTUP         58
FASTDOWN       64
CPCROSSA       56
CPCROSSD       112
BIGVOLUP       1
BIGVODN        7
ACCUMVER       17
HIGHIP21       11
HIUPPCT        9
VHIP21         34
LOWACCUM       166
REDSELL        35
AUGSELS7       20
TRAPDOOR       21
|
 Table 3   RANKING OF KEY DIRECTORIES BASED PCT.OF STOCKS ABOVE 65-DMA
              3/20/19
 Bullish = 40
 Bearish = 4
---------------------------------------------------------------------------------------
Directory     Current       day-1         day-2         day-3         day-4         day-5
----------------------------------------------------------------------------------------
BONDFUND       .99           .98           .98           .98           .98           .98
ETFS           .965          .982          .965          .913          .844          .862
DJI-13         .923          .923          .846          .923          .923          .923
UTILITY        .9            .9            .925          .925          .95           .95
NIFTY          .894          .877          .894          .912          .877          .877
SOLAR          .882          .941          .941          .941          .941          .941
BIGBANKS       .857          1             1             1             1             1
FIDSTKS        .843          .875          .875          .87           .854          .854
SP-100         .838          .881          .87           .86           .86           .86
SEMI           .836          .853          .853          .836          .836          .844
DOWJONES       .833          .866          .833          .866          .866          .866
OILGAS         .832          .776          .811          .734          .748          .755
HACKERS        .818          .818          .909          .863          .818          .863
NASD-100       .818          .858          .868          .868          .838          .828
SP500          .806          .853          .848          .848          .84           .853
ELECTRON       .796          .802          .808          .796          .802          .814
INDEXES        .79           .806          .774          .784          .79           .79
GREEN          .782          .826          .826          .826          .826          .826
REIT           .765          .758          .778          .778          .791          .798
GOLD           .764          .686          .666          .725          .725          .803
CHINA          .762          .796          .796          .83           .762          .796
SOFTWARE       .761          .809          .825          .809          .793          .761
INDMATER       .759          .784          .784          .759          .772          .784
RUS-1000       .753          .802          .811          .799          .797          .808
INFRA          .75           .805          .833          .777          .777          .833
BIOTECH        .74           .753          .732          .711          .708          .719
BIG17          .739          .76           .782          .739          .695          .739
CHEM           .722          .759          .759          .74           .777          .759
FINANCE        .722          .877          .9            .888          .877          .877
MILITARY       .709          .709          .709          .709          .709          .774
HOMEBLDG       .705          .764          .764          .764          .882          .882
INSURANC       .7            .8            .8            .8            .766          .8
COMPUTER       .681          .681          .681          .681          .727          .727
EDU            .666          .666          .666          .666          .666          .666
TRANSP         .65           .7            .75           .75           .75           .75
COMODITY       .634          .609          .585          .56           .56           .634
FOOD           .618          .581          .563          .545          .49           .581
BEVERAGE       .611          .666          .666          .722          .611          .611
GUNS           .588          .647          .647          .647          .647          .647
RETAIL         .584          .716          .641          .641          .603          .773
===========================================================================================
HOSPITAL       .5            .5            .5            .458          .458          .416
JETS           .5            .5            .5            .5            .5            .5
===========================================================================================
AUTO           .461          .564          .564          .538          .487          .641
COAL           .428          .428          .428          .428          .571          .571
GAMING         .416          .416          .416          .5            .458          .458
REGBANKS       .357          .857          .964          .964          .928          .928
|
================================================================================
3/19/2019 Seasonality, Peerless and
current technicals argue persusasively that the DJI
has a very good chance of reaching 27000 before the Summer doldrums intrude and cause
another profit-taking decline. But of course, there could be some bearish surprises,
such as a much
more damning Muller Report than seems the case now, a breakoff by China of the tariff and
trade
talks with the Trump Administration, news of coverup by Boeing of basic design flaws
it knew
about in the MAX737 or possibly such a quick rise in inflation from the monthly CPI and
wage
reports that the FED will raise rates despite the political pressure on it to do nothing
for now.
If any of these bearish news items were about to come out, I would expect Professionals to
become heavy sellers before the news and we would then see breaks in the still rising
Closing
Powers for DIA, SPY, QQQ, IWM and SOXL. But all are still rising now. So, lets
just hold
our current positions, including SOXL.


Semi-Conductors Moving Up
SOXL did not quite reach the level recommended for selling today. Just hold
it
long now. (Our sell was for 5% above yesterday's close.) My view now is that
its breakout could take it above 200. Since both its Opening Power and Closing Power
are rising, it is now in a potentially "vertical ascent" mode. Amazingly, it has
out-performed
the DJI by a whopping 68.5% over the last 50 trading days.

The Tiger Index of the 7 most heavily weighted stocks in the SOXL is now making very
bullish all-time highs. These seven are its leaders. Until they break
their individual Closing Power
uptrends, I would think SOXL will keep rising. They are AVGO, INTC, TXN, NVDA, QCOM,
XLNX and ADI. Of these XLNX is the highest power-ranked in both our SOXL and NIFTY
Tech lists..


Of all the Semi-conductors we follow LSCC is the top Power-ranked. It has
appeared in many
of the Bullish listings. Note how it met all the conditions for an augmented Buy B24
several weeks ago.
The augmented B24s criteria appear in the Bullish MAXCPs link. Rarely would we want
to
chase a stock like this was at 11.5 on February 14th, but our back-testing shows
that these
augmented B24s average gains of well-over 24% over the next 12 months. These results
were for
the period 1990-2006. I will post them tomorrow night on the Bullish MAXCPs page.

Boeing - Too Complicated a Plane? Bureaucratic
Laziness? Corporate Coverup?
Plenty of room for blame.... But we need to find out the truth...
The Boeing drama continues. As every point BA falls
means a 7 point drop in the
DJI-30, we must follow the saga here. There are reports that the day before the
Indonesian
Lion 737 MAX crashed a year ago, a similar episode developed. Fortunately, in the
cockpit sat a hitch-hiking pilot who knew how to save that plane from its nose-dive
into the sea. He got the regular pilots to immediately disable BA's anti-stall
software
that was causing plane's nose to turn dangerously down. The NY Times tonight makes
much of the dangers of this software intervention, especially when just one sensor reading
shows that a stall situation is developing. They also point to the conflicts of
interest
that naturally arise when the FAA's certification testing is left mainly to Boeing itself.
They raise the question of de-regulation being carried too far as when the FAA failed to
look
into other reports for the last year that pointed to the risks of giving so much power to
the
software itself. It appears to me that the worst development for BA would be that it
turns
out that Boeing has knowingly built an airplane that had too weighty an engine for
its placement
on the plane's body and then decided to fix the problem with corrective software but
failed to emphasize the risks and how to handle them in its training, even after the first
crash.
And that it did so entirely because of the costs of basic re-design and because it feared
it would lose customers. In other words, the stock's huge advance owes to corners it
cut in the plane's development. Of course, Boeing is exceedingly powerful and it may
take a long time for all the relevant facts to come out. Meanwhile, BA is under a
very big
cloud and that makes SPY and the SP-500 better indexes to follow, in my opinion.
See https://www.nytimes.com/2019/03/19/business/boeing-elaine-chao.html
and comments
after the article.
Charts 3/19/2019
2018 PEERLESS DJI, Signals,
Indicators Daily DJI Volume 10-DayUp/Down Vol
Hourly DJIA A/D Line for All Stocks
Inverted Traders Index
NASDAQ S&P OEX NYSE COMPQX DJI-15 DJI-20 DJI-30
DIA SPY QQQ MDY IWM TNA
Short-Term Rates
USO-CrudeOil DBO FAS GLD BBH IBB JETS JNUG KOL NUGT OIH OIL RSX RETL
SDS AGQ SLV SOXL TECL TLT TMF TNA UGA (gasoline) XIV YINN
Commodities: CANE
CORN DBC JJC, NIB, CHOC CORN, CUT (paper)
MOO, SOYB WEAT UUP (Dollar) LIT
(Lithium)
AAPL ADBE ALXN AMAT AMGN AMD AMZN BA BABA BAC BIDU CAT CVX DE
FB GOOG GS HD IBM INTU JPM M (Macy's) MSFT NFLX NVDA QCOM TSLA TXN
XOM WMT CMG , LRCX, SWKS, MDGL
SPPI WATT SQ TOWN
3/19/19 (Click
on Underlined link.)
Bullish MAXCPs - http://tigersoft.com/MAXCPS/Mar-19/BULLISH.htm
Bearish MAXCPs - http://tigersoft.com/MINCPs/Mar-19/BEARISH.htm
|
Table 1 QUICKSILVER on ETFS - 3/19/19
ETF       CLOSE   CHANGE     PIVOT-PT     5-dmaAROC  CL-PWR   CANDLE  IP21   ITRS
---------------------------------------------------------------------------------------------
DIA       258.88   -.11      257.35        58.6%   -------      RED  .119    ----
---------------------------------------------------------------------------------------------
BA        373.43   1.15      377.14       -26.4%   Bullish      BLUE .173   .037
---------------------------------------------------------------------------------------------
SPY       282.4    .07       281.34        51.8%   Bullish      RED  .082   .014
---------------------------------------------------------------------------------------------
QQQ       179.05    .6       177.01        94.8%   Bullish      RED  .138   .041
---------------------------------------------------------------------------------------------
MDY       345.6   -1.77      345.74        20.3%   Bearish      RED  .011   .023
---------------------------------------------------------------------------------------------
IWM       154.96   -.79      154.98        19.1%   Bearish      RED -.066   .025
                                                                    ^^^^^
---------------------------------------------------------------------------------------------
FAS       65.03   -1.26      63.62         201.2%   -------     RED  .034   .3
---------------------------------------------------------------------------------------------
SOXL      142.18    5.29     129.06        557.7%   Bullish     BLUE .018   .685
                                                                            ^^^^
---------------------------------------------------------------------------------------------
TECL      136.6    .6        128.99        386.7%   Bullish     RED  .185   .567
                                                                     ^^^^
---------------------------------------------------------------------------------------------
IBB       113.85   -.07      113.3         88.7%   -------      RED  .008   .005
---------------------------------------------------------------------------------------------
GLD       123.38    .34      123.84        16.3%   Bearish      RED -.067  -.089
---------------------------------------------------------------------------------------------
OIH       17.45   -.08       17.07         190%    Bearish      RED -.082   .044
---------------------------------------------------------------------------------------------
YINN      25.74   -.03       25.76        -27.1%   Bearish      ---  .098   .044
---------------------------------------------------------------------------------------------
RSX       21.23   -.07       20.64         161.1%  Bullish      ---  .055  -.028
|
 Table 3    Count of Stocks in Key Directories
            2019-03-19
-------------------------------
NEWHIGHS       125
NEWLOWS        15
MAXCP          19
MINCP          7
TTTNH          11
TTTNL          24
FASTUP         75
FASTDOWN       70
CPCROSSA       35
CPCROSSD       192
BIGVOLUP       7
BIGVODN        9
ACCUMVER       21
HIGHIP21       12
HIUPPCT        11
VHIP21         34
LOWACCUM       163
REDSELL        37
AUGSELS7       30
TRAPDOOR       22
|
 Table 3      RANKING OF KEY DIRECTORIES BASED PCT.OF STOCKS ABOVE 65-DMA
              3/19/19
  Bullish = 42
  Bearish = 2
---------------------------------------------------------------------------------------
Directory     Current       day-1         day-2         day-3         day-4         day-5
----------------------------------------------------------------------------------------
BIGBANKS       1             1             1             1             1             1
ETFS           .982          .965          .913          .844          .879          .879
BONDFUND       .98           .98           .98           .98           .98           .98
SOLAR          .941          .941          .941          .941          .941          .882
DJI-13         .923          .846          .923          .923          .923          .923
UTILITY        .9            .925          .925          .95           .95           .975
SP-100         .881          .87           .86           .86           .86           .827
FINANCE        .877          .9            .888          .877          .866          .855
NIFTY          .877          .894          .912          .877          .877          .877
FIDSTKS        .875          .875          .87           .854          .854          .848
DOWJONES       .866          .833          .866          .866          .866          .866
NASD-100       .858          .868          .868          .838          .828          .818
REGBANKS       .857          .964          .964          .928          .928          .928
SEMI           .853          .853          .836          .836          .862          .836
SP500          .844          .84           .84           .832          .84           .828
GREEN          .826          .826          .826          .826          .826          .826
HACKERS        .818          .909          .863          .818          .818          .863
SOFTWARE       .809          .825          .809          .793          .746          .777
INDEXES        .806          .774          .784          .79           .795          .774
INFRA          .805          .833          .777          .777          .833          .833
ELECTRON       .802          .808          .796          .802          .827          .808
RUS-1000       .802          .811          .798          .798          .803          .797
INSURANC       .8            .8            .8            .766          .8            .8
CHINA          .796          .796          .83           .762          .779          .762
INDMATER       .784          .784          .759          .772          .784          .746
OILGAS         .776          .811          .734          .748          .748          .685
HOMEBLDG       .764          .764          .764          .882          .882          .941
BIG17          .76           .782          .739          .695          .739          .717
CHEM           .759          .759          .74           .777          .777          .796
REIT           .758          .778          .778          .791          .785          .805
BIOTECH        .751          .732          .711          .708          .716          .687
RETAIL         .716          .641          .641          .603          .754          .716
MILITARY       .709          .709          .709          .709          .774          .774
TRANSP         .7            .75           .75           .75           .75           .75
GOLD           .686          .666          .725          .725          .803          .784
COMPUTER       .681          .681          .681          .727          .727          .681
BEVERAGE       .666          .666          .722          .611          .611          .555
EDU            .666          .666          .666          .666          .666          .666
GUNS           .647          .647          .647          .647          .647          .647
COMODITY       .609          .585          .56           .56           .634          .56
FOOD           .592          .574          .555          .5            .592          .537
AUTO           .564          .564          .538          .487          .641          .641
---------------------------------------------------------------------------------------------
HOSPITAL       .5            .5            .458          .458          .416          .416
JETS           .5            .5            .5            .5            .5            .5
---------------------------------------------------------------------------------------------
COAL           .428          .428          .428          .571          .571          .571
GAMING         .416          .416          .5            .458          .458          .5
|
===========================================================================
3/18/2019 We have more technical
evidence that the DJI will reach 27000 by June.
The operative Peerless January B4 and last week's B18 were reinforced by a new
Peerless
Buy B15 signal today. The Buy B15 appeared on our DJI chart primarily because its
21-day
ma has now been rising 41 straight days. This is purely a momentum signal. It
appears in
March particularly often because of the strong tendency for the DJI not to make a
significant Sell until late May or June when there is a January take-off like we have
seen.
The combination of a Buy B18 and then a Buy B15 signal has appeared 10 times since
1929. The average DJI gain at the time of the next Peerless Sell from the
"combo" B15
is 10.1 %. Its median gain is 8.65%. Half of the combo signals occurred
in March,
like ours today. Their median gain was 8.9%. They all showed a small a paper
loss
whose median was 1%. See the combination B18-B15 signals below.


Boeing fell more than 6 today and so may continue to distort the DJI-30 somewhat,
as well as hold it back. A better reading of the market's strength now will come
from the
SP-500 and SPY. The Index has made a breakout. Its ETF has not yet.
Let's see
if the current rally can continue and thereby make believers of those that are holding
back for
want of confidence.
Still, since a new Red Sell has appeared on SOXL's chart. traders might want to take
profits if it rises by 5% tomorrow or if it turns negative despite the up-opening
tomorrow.
Hold IWM and Buy SPY.
Combo Peerless Buy B18-B15 Signals: 1929-2018
Date
Signal
DJI
Gain
Paper Loss19430219 B18 126.7 .124 none 0
19430302 B15 128.6 .107 none 0
---------------------------------------------------------------------
19581203 B18 558.8 .164 none 0
19590126 B15 592.4 .098 574.5 -.0302 2/9
---------------------------------------------------------------------
19610201 B18 649.3 .08 637.00 -.0189 2/13
19610207 B15 643.9 .089 637.00 -.0107 2/13
---------------------------------------------------------------------
19710118 B15 847.82 .106 none 0
19710128 B18 865.14 .084 none 0
19710224 B15 875.62 .071 none 0
19710329 B18 903.48 .038 none 0
---------------------------------------------------------------------
19750305 B18 752.82 .149 742.88 -.0132 4/07
19750320 B15 764.0 .132 742.88 -.0276 4/07
-------------------------------------------------------------------------
19870310 B18 2280.09 .055 2248.44 -.0138 3/16
19870313 B15 2258.66 .065 2248.44 -.0045 3/16
-------------------------------------------------------------------------
19950303 B18 3989.61 .391 3979.23 -.0026 3/8
19950417 B15 4195.38 .323 4179.13 -.0038 4/18
---------------------------------------------------------------------------
19980317 B18 8749.99 .050 none 0
19980327 B15 8796.08 .044 8782.12 -.0015 3/30
---------------------------------------------------------------------------
20061005 B18 11866.69 .045 none 0
20061031 B15 12080.73 .026 11986.2 -.0078 11/3
|
The SP-500's Closing Power made a new high,
thus confirming its red (high volume) breakout on Friday.
FAS, representing bigger banks is looking good , but
SOXL just got a new red
optimized Sell which short-term
traders should take given the lagging Closing Power and
nearly negative IP21.
Be patient with IWM.

 |
 |
Charts 3/16/2019
2018 PEERLESS DJI, Signals,
Indicators Daily DJI Volume 10-DayUp/Down Vol
Hourly DJIA A/D Line for All Stocks
Inverted Traders Index
NASDAQ S&P OEX NYSE COMPQX DJI-15 DJI-20 DJI-30
DIA SPY QQQ MDY IWM TNA
Short-Term Rates
USO-CrudeOil DBO FAS GLD BBH IBB JETS JNUG KOL NUGT OIH OIL RSX RETL
SDS AGQ SLV SOXL TECL TLT TMF TNA UGA (gasoline) XIV YINN
Commodities: CANE
CORN DBC JJC, NIB, CHOC CORN, CUT (paper)
MOO, SOYB WEAT UUP (Dollar) LIT
(Lithium)
AAPL ADBE ALXN AMAT AMGN AMD AMZN BA BABA BAC BIDU CAT CVX DE
FB GOOG GS HD IBM INTU JPM M (Macy's) MSFT NFLX NVDA QCOM TSLA TXN
XOM WMT CMG , LRCX, SWKS, MDGL
SPPI WATT SQ TOWN
3/18/19 (Click
on Underlined link.)
Bullish MAXCPs - http://tigersoft.com/MAXCPS/Mar-18/BULLISH.htm
Bearish MAXCPs - http://tigersoft.com/MINCPs/Mar-18/BEARISH.htm
|
Table 1 QUICKSILVER on ETFS - 3/18/19
ETF      CLOSE   CHANGE     PIVOT-PT    5-dma AROC  CL-PWR      CANDLE  IP21   ITRS
---------------------------------------------------------------------------------------------
DIA       258.99    .65      255.86        43.4%    -------      BLUE   .199    ---
---------------------------------------------------------------------------------------------
BA        372.28   -6.71     375.41      -363.9%    Bullish      BLUE   .211   .055
---------------------------------------------------------------------------------------------
SPY       282.33    1.02     279.49        69.4%    Bullish      BLUE   .16    .014
---------------------------------------------------------------------------------------------
QQQ       178.45    .1       175.69       105.4%    Bullish      BLUE   .152   .049
---------------------------------------------------------------------------------------------
MDY       347.37   2.62      344.2         53.1%    -------      BLUE   .064   .029
---------------------------------------------------------------------------------------------
IWM       155.75    .99      154.37        47.2%    Bearish      BLUE   .021   .035
---------------------------------------------------------------------------------------------
FAS       66.29    1.13      62.44         352.2%   Bullish      BLUE   .13    .419
---------------------------------------------------------------------------------------------
RETL      29.43    .56       30.24         -99.2%   Bearish      BLUE   .01    .124
---------------------------------------------------------------------------------------------
SOXL      136.89   -.9       127.5         419.5%   -------      RED    .004   .804
                                                                               ^^^^
---------------------------------------------------------------------------------------------
TECL      136    1.65        126.46        450.8%   Bullish      BLUE   .219   .733
                                           ^^^^^^                       ^^^^
---------------------------------------------------------------------------------------------
IBB       113.92   -.28      111.84        132.7%   Bullish      RED    .06    .024
---------------------------------------------------------------------------------------------
GLD       123.04    .07      122.98        32.5%    Bearish      RED   -.001  -.137
---------------------------------------------------------------------------------------------
OIH       17.53    .54       16.8          295.8%   Bearish      BLUE  -.033   .067
---------------------------------------------------------------------------------------------
RSX       21.3    .43        20.56         196.3%   -------      BLUE   .068  -.025
---------------------------------------------------------------------------------------
|
 Table 2
          Count of Stocks in Key Directories
          20190318
-------------------------------
NEWHIGHS       140  Bullish Ratio
NEWLOWS        10
MAXCP          65
MINCP          20
TTTNH          23
TTTNL          17
FASTUP         82
FASTDOWN       68
CPCROSSA       162
CPCROSSD       51
BIGVOLUP       7
BIGVODN        6
ACCUMVER       20
HIGHIP21       17
HIUPPCT        10
VHIP21         34
LOWACCUM       164
REDSELL        36
AUGSELS7       22
TRAPDOOR       23
|
Table 3
              RANKING OF KEY DIRECTORIES BASED PCT.OF STOCKS ABOVE 65-DMA
              3/18/19
Bullish = 42
Bearish = 2
---------------------------------------------------------------------------------------
Directory     Current       day-1         day-2         day-3         day-4         day-5
----------------------------------------------------------------------------------------
BIGBANKS       1             1             1             1             1             1
BONDFUND       .98           .98           .98           .98           .98           .99
ETFS           .965          .913          .844          .879          .879          .879
REGBANKS       .964          .964          .928          .928          .928          .928
SOLAR          .941          .941          .941          .941          .882          .941
UTILITY        .925          .925          .95           .95           .975          .95
HACKERS        .909          .863          .818          .818          .818          .818
FINANCE        .9            .888          .877          .866          .855          .844
NIFTY          .894          .912          .877          .877          .877          .877
FIDSTKS        .875          .87           .854          .859          .854          .827
NASD-100       .87           .87           .84           .83           .82           .79
SP-100         .87           .86           .86           .87           .838          .827
SEMI           .853          .836          .836          .862          .836          .862
SP500          .848          .848          .84           .848          .836          .826
DJI-13         .846          .923          .923          .923          .923          .923
DOWJONES       .833          .866          .866          .866          .866          .866
INFRA          .833          .777          .777          .833          .805          .777
GREEN          .826          .826          .826          .826          .826          .826
SOFTWARE       .825          .809          .793          .746          .761          .809
OILGAS         .811          .734          .748          .748          .685          .636
RUS-1000       .811          .798          .797          .805          .792          .781
ELECTRON       .808          .796          .802          .827          .808          .814
INSURANC       .8            .8            .766          .8            .8            .8
CHINA          .796          .83           .762          .779          .762          .796
INDMATER       .784          .759          .772          .784          .746          .721
BIG17          .782          .739          .695          .739          .717          .673
REIT           .778          .778          .791          .785          .812          .765
INDEXES        .774          .784          .79           .795          .774          .763
HOMEBLDG       .764          .764          .882          .882          .941          .941
CHEM           .759          .74           .777          .777          .796          .796
TRANSP         .75           .75           .75           .75           .75           .7
BIOTECH        .73           .711          .708          .716          .687          .666
MILITARY       .709          .709          .709          .774          .774          .741
COMPUTER       .681          .681          .727          .727          .681          .727
BEVERAGE       .666          .722          .611          .611          .555          .666
EDU            .666          .666          .666          .666          .666          .666
GOLD           .666          .725          .725          .803          .784          .705
GUNS           .647          .647          .647          .647          .647          .647
RETAIL         .641          .641          .603          .754          .716          .716
COMODITY       .585          .56           .56           .634          .56           .585
FOOD           .574          .555          .5            .592          .537          .518
AUTO           .564          .538          .487          .641          .641          .615
=============================================================================================
HOSPITAL       .5            .458          .458          .416          .416          .375
JETS           .5            .5            .5            .5            .5            .5
=============================================================================================
COAL           .428          .428          .571          .571          .571          .428
GAMING         .416          .5            .458          .458          .5            .583
|
| |
===========================================================================
3/15/2019 The operative Peerless
January B4 and last week's Buy B18 should,
if history repeats, take the DJI to new 12-month highs. Seasonality in the third
year
of the 4-year Presidential cycle is particularly bullish, provided the FED does not rates
over 3%. Right now, the DJI is wrestling with the remnants of a potential
Head/Shoulders
pattern which seems to have developed because of Michael Cohen's damaging testimony
about Trump and because of Boeing's potential threat to the DJI-30 stemming from the two
similar
crashes of its new MAX 737. While
the DJI struggles, the NYSE A/D Line is close to a 12-
month high, something which the DJ-15 (Utilities) has achieved. Recovery-new highs
were
made this week by the Transports, the NASDAQ, SOXL, TECL, QQQ and the SP-500.
Still lagging is IWM and MDY. So, the rally still looks good despite the DJIA's
lagging.
A rally tomorrow by the DJI will destroy its
potential larger Head/Shoulders pattern. The
red high volume shows churning and the need
for the DJI to breakout over 26000, if it wants
destroy its potential H/S pattern.

SOXL (below) now shows a falling IP21 and a Closing Power non-confirmation.
This is not fatal, but it is a sign that we must wait to see what happens next.
That its Closing Power is still in an uptrend should give us hope of still
higher prices.


The day after triple-witch day often seems to increase volatility. So the start of
this
week will be important to see if the leading ETFs can keep moving up to their 12-month
highs even as the DJI copes with its unpleasant looking head/shoulders. I think we
should patiently hold our long positions. Most of the Closing Powers are
rising. So,
Professionals are predominately bullish. I see no signs that the FED wants to raise
interest rates. The 1950s, which bears many similarities to 2019, did not produce
a 19% decline until the Discount Rate and the Federal Funds Rates rose over 3%.
Deep March declines of more than 4% from March peak to nadir are rare in the third
year. The last one was back in 1955. We should study these see what
might bring on
such a decline.
March DJI Tops and
Declines of More than 4%
in the third year
of a Presidential Election.
Top
Decline
Factors
Bottom
----------------------------------------------------------------------------
3/20/1923 18.5% Corruption in Harding's Cabinet.
10/30/1923
Fed Raises Discount Rate
1923-01-01,4.00 1923-02-01,4.11 1923-03-01,4.50 ....
----------------------------------------------------------------------------
3/9/1939 19% Hitler annexes Bohemia and Moravia. April
Discount Rate stays at 1% all year
----------------------------------------------------------------------------
3/6/1947
10% FBI Director Hoover
tell Congress
May
that Communists nearly dominate Hollywood.
Red Scare - https://en.wikipedia.org/wiki/Red_Scare
Discount Rate stays at 1% all year
-----------------------------------------------------------------------------
3/4/1955 7%
Pres. Eisenhower says US will
use nuclear weapons. 3/14/1955
Discount Rate starts rising in mid March to 1.5% to 1.63%. (Note the St. Louis
Fed only shows the rates at the end of the month. But key meetings of FOMC are
in middle of month.)
1955-03-01,1.50
1955-04-01,1.63
1955-05-01,1.75 ...
1955-08-01,1.97
1955-09-01,2.18
1955-10-01,2.25
1955-11-01,2.36
1955-12-01,2.50 ...
1956-04-01,2.65
1956-05-01,2.75...
1956-08-01,2.81
1956-09-01,3.00...
1957-08-01,3.15
In mid-July 1957, the FED took the Discount Rate over 3%.
This and Sputnik's success brought a 20% drop in the DJIA.
Fed Funds rate also then rose over 3% for first time to 3.24%
Marginal Breakouts

Charts 3/15/2019
2018 PEERLESS DJI, Signals,
Indicators Daily DJI Volume 10-DayUp/Down Vol
Hourly DJIA A/D Line for All Stocks
Inverted Traders Index
NASDAQ S&P OEX NYSE COMPQX DJI-15 DJI-20 DJI-30
DIA SPY QQQ MDY IWM TNA
Short-Term Rates
USO-CrudeOil DBO FAS GLD BBH IBB JETS JNUG KOL NUGT OIH OIL RSX RETL
SDS AGQ SLV SOXL TECL TLT TMF TNA UGA (gasoline) XIV YINN
Commodities: CANE
CORN DBC JJC, NIB, CHOC CORN, CUT (paper)
MOO, SOYB WEAT UUP (Dollar) LIT
(Lithium)
AAPL ADBE ALXN AMAT AMGN AMD AMZN BA BABA BAC BIDU CAT CVX DE
FB GOOG GS HD IBM INTU JPM M (Macy's) MSFT NFLX NVDA QCOM TSLA TXN
XOM WMT CMG , LRCX, SWKS, MDGL
SPPI WATT SQ TOWN
3/15/19 (Click
on Underlined link.)
Bullish MAXCPs - http://tigersoft.com/MAXCPS/Mar-15/BULLISH.htm
Bearish MAXCPs - http://tigersoft.com/MINCPs/Mar-15/BEARISH.htm
|
Table 1 QUICKSILVER on ETFS - 3/15/19
ETF      CLOSE   CHANGE     PIVOT-PT    5-dma AROC  CL-PWR   CANDLE  IP21   ITRS
---------------------------------------------------------------------------------------------
DIA       258.34     .8      256.76         70.8%   -------    BLUE .179   ----
---------------------------------------------------------------------------------------------
BA        378.99    5.69     400.01       -558.8%   Bullish    BLUE .175   .063
---------------------------------------------------------------------------------------------
SPY       281.31    .15      278.44        122.8%   -------    BLUE .142   .017
---------------------------------------------------------------------------------------------
QQQ       178.35    1.64     174.73        205.1%   Bullish    BLUE .16    .044
---------------------------------------------------------------------------------------------
MDY       344.75   -.57      343.71        80.5%    Bearish    BLUE .05    .036
---------------------------------------------------------------------------------------------
IWM       154.76    .41      154.29        101.3%   Bearish    BLUE .025   .042
---------------------------------------------------------------------------------------------
FAS       65.16    .88       61.82         434.4%   Bullish    BLUE .117   .343
---------------------------------------------------------------------------------------------
RETL      28.87   -.22       30.02         60.7%    Bearish    RED  .016   .083
---------------------------------------------------------------------------------------------
SOXL      137.79    10.93    126.03        803.3%   Bullish    BLUE .013   .504
                                                                           ^^^^
---------------------------------------------------------------------------------------------
TECL      134.35    4.65     124.39        701.7%   Bullish    BLUE .21    .473
                                                                    ^^^^
---------------------------------------------------------------------------------------------
IBB       114.2    1.21      110.93        250.6%   Bullish    BLUE .091   .064
---------------------------------------------------------------------------------------------
GLD       122.97    .56      122.24        5.3%     Bearish    RED  .036  -.094
---------------------------------------------------------------------------------------------
OIH       16.99    -.13       16.53        275.2%   Bearish    RED -.057   .075
---------------------------------------------------------------------------------------------
GASL      7.17     -.16        6.57        621.2%   Bearish    --- -.012   .169
---------------------------------------------------------------------------------------------
UGA       7.17   -.16        6.57          621.2%   Bullish    --- -.056  -.813
---------------------------------------------------------------------------------------------
YINN      25.8   -.04        25.93        -36.7%    Bearish    ---  .114   .06
---------------------------------------------------------------------------------------------
RSX       20.87    .25       20.49         170.8%   -------    BLUE .073  -.01
|
TABLE 2    Count of Stocks in Key Directories
           2019-03-15
-------------------------------
NEWHIGHS       192
NEWLOWS        22
MAXCP          65
MINCP          20
TTTNH          26
TTTNL          40
FASTUP         134
FASTDOWN       47
CPCROSSA       171
CPCROSSD       75
BIGVOLUP       11
BIGVODN        40
ACCUMVER       21
HIGHIP21       18
HIUPPCT        8
VHIP21         37
LOWACCUM       197
REDSELL        40
AUGSELS7       20
TRAPDOOR       21
|
Table 3  RANKING OF KEY DIRECTORIES BASED PCT.OF STOCKS ABOVE 65-DMA
              3/15/19
              Bullish = 42
              Bearish = 2
---------------------------------------------------------------------------------------
Directory     Current       day-1         day-2         day-3         day-4         day-5
----------------------------------------------------------------------------------------
BIGBANKS       1             1             1             1             1             .857
BONDFUND       .98           .98           .98           .98           .99           .99
REGBANKS       .964          .928          .928          .928          .928          .892
SOLAR          .941          .941          .941          .882          .941          .882
UTILITY        .925          .95           .95           .975          .95           .95
DJI-13         .923          .923          .923          .923          .923          .846
ETFS           .913          .844          .879          .879          .879          .672
NIFTY          .912          .877          .877          .877          .877          .824
FINANCE        .888          .877          .866          .855          .844          .8
FIDSTKS        .87           .854          .859          .854          .827          .789
NASD-100       .87           .84           .83           .82           .79           .75
DOWJONES       .866          .866          .866          .866          .866          .833
HACKERS        .863          .818          .818          .818          .818          .772
SP-100         .86           .86           .87           .838          .827          .741
SP500          .848          .84           .848          .836          .824          .779
SEMI           .836          .836          .862          .836          .862          .801
CHINA          .83           .762          .779          .762          .796          .694
GREEN          .826          .826          .826          .826          .826          .826
SOFTWARE       .809          .793          .746          .761          .809          .73
INSURANC       .8            .766          .8            .8            .8            .733
RUS-1000       .798          .797          .803          .793          .78           .732
ELECTRON       .796          .802          .827          .808          .814          .777
INDEXES        .784          .79           .795          .774          .758          .731
REIT           .778          .791          .785          .812          .765          .704
INFRA          .777          .777          .833          .805          .777          .75
HOMEBLDG       .764          .882          .882          .941          .941          .941
INDMATER       .759          .772          .784          .746          .721          .721
TRANSP         .75           .75           .75           .75           .7            .6
CHEM           .74           .777          .777          .796          .814          .759
BIG17          .739          .695          .739          .717          .673          .652
OILGAS         .734          .748          .748          .685          .622          .566
GOLD           .725          .725          .803          .784          .705          .745
BEVERAGE       .722          .611          .611          .555          .666          .555
MILITARY       .709          .709          .774          .774          .741          .741
BIOTECH        .708          .708          .716          .687          .666          .608
COMPUTER       .681          .727          .727          .681          .727          .727
EDU            .666          .666          .666          .666          .666          .666
GUNS           .647          .647          .647          .647          .647          .647
RETAIL         .641          .603          .754          .716          .716          .679
COMODITY       .56           .56           .634          .56           .536          .512
FOOD           .555          .5            .592          .537          .481          .481
AUTO           .538          .487          .641          .641          .615          .538
===============================================================================================
GAMING         .5            .458          .458          .5            .583          .5
JETS           .5            .5            .5            .5            .5            .3
===============================================================================================
HOSPITAL       .458          .458          .416          .416          .375          .375
COAL           .428          .571          .571          .571          .428          .428
|
======================================================================
3/14/2019 A new, augmenting Peerless Buy B18 resulted from today's trading. It should
help bring a breakout by the SP-500 above its flat overhead resistance at 2825,
by the NYSE above 12800 and by the NASDAQ above 7670. We also
need to see it destroy the potential head/shoulders patterns in the DJI by
moving above 25900, in IWM by surpassing 156 (1.65 higher) and in SOXL
by breaking above 134.


The market keeps slowly advancing despite the dangers that bearish news about
Boeing, from the Chinese tariff reports or the Muller Report might bring. It is also
bullishly climbing a wall of worry even though the last Jobs' Report was anemic.
This means the market is in relatively tight hands and should go higher.
The Buy B18 simply tells us that the P-Indicator (the
21-day ma of NYSE advances)
minus declines has been rising 42 straight day. The link is to the study that was
done
in 2013. The list of all the B18s now is virtually the same, except that there are
a few more cases than before chiefly because the current program allows the B18
when the V-I is slightly negative. (More on this Sunday night).
Below is a list of all the previous March B18s. There have been 13. The median
gain for then is 5.5% on the DJI at the time of the next Peerless Sell. The median
paper loss is 1.2%. Seven of the 13 March 18s occurred in the third year of a
Presidential Election year. The biggest gain was 39.1% and the lowesr gain was
3.2%. The biggest paper loss in all 13 March B18s was only 1.6%. The signal
should help us stay bullish.
March Peerless B18 s
Gain
Paper Loss
19540318
B18 300.1
.561 296.4
-.012 3/25
19650315 B18 899.9
.043 887.8
-.013 3/29
19670303
B18 846.6
.032 842.43
-.005 4/10
3rd Year in 4-year cycle.
19710329
B18 903.48
.038 none 0
3rd Year in 4-year cycle.
19750305
B18 752.82
.149 742.88
-.013 4/07 3rd Year in 4-year cycle.
19830308
B18 1119.78
.111 1113.49 -.006
4/6
3rd Year in 4-year cycle.
19860303 B18 1696.67
.076 1686.30 -.006
3/4
19870310
B18 2280.09
.055 2248.44 -.014
3/16
3rd Year in 4-year cycle.
19910326
B18 2914.85
.039 2873.02 -.014
4/9
19930317 B18 3426.74
.158 3370.81 -.016
4/2
19950303
B18 3989.61
.391 3979.23 -.003
3/8
19980317 B18 8749.99
.050 none
0
20060315 B18 11209.77
.033 11073.7 -.012
4/17 |
| |
Table 1 QUICKSILVER on ETFS - 3/14/19
ETF      CLOSE   CHANGE     PIVOT-PT      5-dma AROC   CL-PWR   CANDLE  IP21   ITRS
---------------------------------------------------------------------------------------------
DIA       257.54    .19      254.71        53.3%       -------   BLUE  .157    -----
---------------------------------------------------------------------------------------------
BA        373.3   -3.84      422.54       -616.5%      Bullish   RED   .156   .053
---------------------------------------------------------------------------------------------
SPY       281.16   -.18      274.46        110.7%      -------   RED   .126   .021
---------------------------------------------------------------------------------------------
QQQ       176.71   -.3       171.17        151.7%      Bullish   RED   .114   .041
---------------------------------------------------------------------------------------------
MDY       345.32   -.42      339.22        74.9%       -------   RED   .11    .037
---------------------------------------------------------------------------------------------
IWM       154.35   -.63      151.64        87%         Bearish   RED   .063   .048
                                                                     big drop
---------------------------------------------------------------------------------------------
FAS       64.28    .66       59.74         366%        Bullish   BLUE  .075   .331
---------------------------------------------------------------------------------------------
RETL      29.09   -1.38      28.51        -20.2%       Bearish   RED   .034   .151
---------------------------------------------------------------------------------------------
SOXL      126.86   -2.2      117.64        365.3%      -------   RED  -.047   .418
---------------------------------------------------------------------------------------------
TECL      129.7    .71       116.77        520.8%      Bullish   RED   .148   .422
---------------------------------------------------------------------------------------------
IBB       112.99   -.31      108.61        173.8%      Bullish   RED   .038   .067
---------------------------------------------------------------------------------------------
GLD       122.41   -1.43     122.84        36.7%       Bearish   BLUE  .043  -.095
---------------------------------------------------------------------------------------------
OIH       17.12    .05       16.07         195.9%      Bearish   ----- .044   .116
---------------------------------------------------------------------------------------------
RSX       20.62   -.02       20.17         75.9%       Bearish   ----- .103  -.005
|
 Table 3   Count of Stocks in Key Directories
           2019-03-14
-------------------------------
NEWHIGHS       167  Bullish
NEWLOWS        16
MAXCP          35
MINCP          12
TTTNH          21
TTTNL          20
FASTUP         83
FASTDOWN       67
CPCROSSA       65
CPCROSSD       62
BIGVOLUP       5
BIGVODN        14
ACCUMVER       15
HIGHIP21       8
HIUPPCT        8
VHIP21         36
LOWACCUM       153
REDSELL        43
AUGSELS7       23
TRAPDOOR       21
|
 Table 1
 RANKING OF KEY DIRECTORIES BASED PCT.OF STOCKS ABOVE 65-DMA
              3/14/19
 Bullish = 42
 Bearish = 3
---------------------------------------------------------------------------------------
Directory     Current       day-1         day-2         day-3         day-4         day-5
----------------------------------------------------------------------------------------
BIGBANKS       1             1             1             1             .857          .857
BONDFUND       .98           .98           .98           .99           .99           .98
UTILITY        .95           .95           .975          .95           .95           .9
SOLAR          .941          .941          .882          .941          .882          .823
REGBANKS       .928          .928          .928          .928          .857          .821
DJI-13         .923          .923          .923          .923          .846          .923
HOMEBLDG       .882          .882          .941          .941          .941          .941
FINANCE        .877          .866          .855          .844          .788          .755
NIFTY          .877          .877          .877          .877          .824          .824
DOWJONES       .866          .866          .866          .866          .833          .866
SP-100         .86           .87           .838          .827          .741          .784
FIDSTKS        .854          .859          .854          .827          .783          .805
ETFS           .844          .879          .879          .879          .672          .706
NASD-100       .84           .83           .82           .79           .75           .77
SP500          .84           .848          .836          .824          .775          .797
SEMI           .836          .862          .836          .862          .793          .801
GREEN          .826          .826          .826          .826          .826          .826
HACKERS        .818          .818          .818          .818          .772          .772
ELECTRON       .802          .827          .808          .814          .771          .771
RUS-1000       .797          .803          .792          .781          .727          .747
SOFTWARE       .793          .746          .761          .809          .73           .698
REIT           .791          .785          .812          .765          .704          .684
INDEXES        .79           .795          .774          .758          .725          .736
CHEM           .777          .777          .796          .814          .777          .796
INFRA          .777          .833          .805          .777          .75           .75
INDMATER       .772          .784          .746          .721          .721          .734
INSURANC       .766          .8            .8            .8            .733          .733
CHINA          .762          .779          .762          .796          .694          .762
OILGAS         .753          .753          .69           .626          .563          .647
TRANSP         .75           .75           .75           .7            .55           .65
COMPUTER       .727          .727          .681          .727          .681          .727
GOLD           .725          .803          .784          .705          .745          .568
BIOTECH        .706          .716          .687          .666          .605          .611
BIG17          .695          .739          .717          .673          .652          .652
MILITARY       .687          .75           .75           .718          .718          .718
EDU            .666          .666          .666          .666          .666          .666
GUNS           .647          .647          .647          .647          .647          .647
BEVERAGE       .611          .611          .555          .666          .555          .555
RETAIL         .603          .754          .716          .716          .679          .698
COAL           .571          .571          .571          .428          .428          .428
COMODITY       .56           .634          .56           .536          .512          .487
===========================================================================================
JETS           .5            .5            .5            .5            .3            .3
===========================================================================================
FOOD           .49           .581          .527          .472          .472          .436
AUTO           .487          .641          .641          .615          .538          .589
GAMING         .458          .458          .5            .583          .5            .5
HOSPITAL       .458          .416          .416          .375          .375          .375
|
All Previous Peerless Buy B18s - 3/14/2018
(C) 2019  www.tigersoft.com
--------------------------------------------------------------------------------------------
                                                Gain                 Paper Loss
19420804      B18       105.6      .348       none       0
19421015      B18       113.3      .257       131.1     .0157    10/28
19430219      B18       126.7      .124       none       0
19430420      B18       128.5      .108       none       0
19440103      B18       135.9      .207       134.2    -.013    2/7
19441016      B18       148.1      .107       145.6    -.017    11/14
19450214      B18       157.1      .044       155.5    -.010    3/23
19450511      B18       163.2      .005       none       0
19451011      B18       185.7      .073       none       0
19451213      B18       193.5      .029       189.1    -.023    12/21
19490829      B18       177.8      .241       none       0
19501013      B18       228.5      .134       222.3    -.027     12/2
19510110      B18       240.4      .078       none       0
19540318      B18       300.1      .561       296.4    -.012     3/25
19540802      B18       349.6      .340       335.8    -.039     8/31
19550110      B18       400.9      .168       388.2    -.032    1/17
19580801      B18       505.4      .287       502.7    -.005    8/18
19581003      B18       533.7      .218       none       0
19581203      B18       558.8      .164       none       0
19610201      B18       649.3      .08        637.00   -.019     2/13
19650315      B18       899.9      .043       887.8    -.013     3/29
19670303      B18       846.6      .032       842.43   -.005     4/10
19710128      B18       865.14     .084       none       0
19710329      B18       903.48     .038       none       0
19750305      B18       752.82     .149       742.88   -.013      4/07
19780512      B18       840.70     .031       none       0
19821201      B18      1031.09     .025       none       0
19830308      B18      1119.78     .111       1113.49  -.006      4/6
19851220      B18      1543.00     .183       none       0
19860303      B18      1696.67     .076       1686.30  -.006      3/4
19870310      B18      2280.09     .055       2248.44  -.014      3/16
19910326      B18      2914.85     .039       2873.02  -.014      4/9
19930317      B18      3426.74     .158       3370.81  -.016      4/2
19950303      B18      3989.61     .391       3979.23  -.003       3/8
19950525      B18      4412.23     .258       4369.00  -.010       5/26
19950801      B18      4700.37     .181       4580.62  -.025       8/24
19961009      B18      5930.62     .156       none       0
19980317      B18      8749.99     .050       none       0
20020103      B18      10172.14   -.006       9618.24  -.054       1/29
20030514      B18      8647.82     .134       8491.36  -.018       5/20
20031217      B18      10145.26    .047       none       0
20041221      B18      10759.43    .014       none       0
20060111      B18      11043.44    .048       10667.3  -.034       1/20
20060315      B18      11209.77    .033       11073.7  -.012       4/17
20061005      B18      11866.69    .045       none       0
20061204      B18      12283.85    .009       none       0
20070518      B18      13556.53    .026       13266.7  -.021       6/7
20130201      B18      14009.79    .083       13784.1  -.016       2/15
20130502      B18      14831.58    .023       none       0
20140423      B18      16501.65    .029       16374.3  -.008       5/20
|
======================================================================
3/13/2019 The Buy B4 and the
V-formation are still in place. Their history suggests
strongly that the DJI will move above 26000 and then reach 27000. But there
is no doubt that a stock market rally would be a lot easier if Boeing's vulnerability
were not so potentially large. The DJI needs to advance from here to continue
to destroy its potential H/S. Avoid DIA for now. I would prefer to hold SOXL
and IWM.

Boeing's potential liability is very big. The present support at its 65-dma is
important. Watch to see if 365 holds up. If not, it will likely fall to
300.
This, by itself would drop the DJI by more than 400 points.

One development that might mitigate BA's financial responsibility would be if it turns out
that the two crashes were were mostly due to pilot error. As I understand it, the
new
type of 747 jet, the one involved in the two "MAX" crashes, must take off at a
lower
angle of ascent than the older 747s. And if a pilot, who might have gotten most of
his training in the older 747s, does not make the proper adjustment to the demands
of flying the new 747, then they could try to angle the plane up more steeply than
keeps the plane rising safely and that then the automatic anti-stall programs will kick in
and try to take over the flying of the plane with the consequence that the plane's nose
is then pointed dangerously downward too soon after take-off. The cockpit recording
device ought to show us if this is the case. Then the question becomes why did the
BA
software not anticipate this pilot error sufficiently, either in the training or in the
software.
And how reliable is the plane's speed sendor?
Here are two warnings sent by two pitlots to the FAA and Boeing before the Ethiopian
Crash.
"In one incident, an airline pilot reported that immediately after engaging
the Max 8’s
autopilot, the co-pilot shouted “DESCENDING,” followed by an audio cockpit
warning,
“DON’T SINK! DON’T SINK!” “I immediately disconnected AP
(Autopilot)
(it WAS engaged as we got full horn etc.) and resumed climb,” the pilot writes in the
report,
which is available in a database
compiled by NASA. “Now, I would generally assume it
was my automation error, i.e., aircraft was trying to acquire a miss-commanded speed/no
autothrottles, crossing restriction etc., but frankly neither of us could find an
inappropriate
setup error (not to say there wasn’t one).”
"Another pilot said it was “unconscionable that a manufacturer, the FAA, and the
airlines
would have pilots flying an airplane without adequately training, or even providing
available resources and sufficient documentation to understand the highly complex
systems that differentiate this aircraft from prior models...I am left to wonder: what
else
don’t I know? The Flight Manual is inadequate and almost criminally insufficient. All
airlines that operate the MAX must insist that Boeing incorporate ALL systems in their
"
manual" "
( Source: https://www.theverge.com/2019/3/13/18263751/boeing-737-max-8-pilot-complaint-autopilot-mcas
)
The most bullish thing the market can do now is to continue to show very good breadth,
have the Dollar stay strong, have interest rates fall and have SPY (or the SP-500)
and SOXL move past the resistance lines shown below.
SPY

SOXL

Charts 3/13/2019
2018 PEERLESS DJI, Signals,
Indicators Daily DJI Volume 10-DayUp/Down Vol
Hourly DJIA A/D Line for All Stocks
Inverted Traders Index
NASDAQ S&P OEX NYSE COMPQX DJI-15 DJI-20 DJI-30
DIA SPY QQQ MDY IWM TNA
Short-Term Rates
USO-CrudeOil DBO FAS GLD BBH IBB JETS JNUG KOL NUGT OIH OIL RSX RETL
SDS AGQ SLV SOXL TECL TLT TMF TNA UGA (gasoline) XIV YINN
Commodities: CANE
CORN DBC JJC, NIB, CHOC CORN, CUT (paper)
MOO, SOYB WEAT UUP (Dollar) LIT
(Lithium)
AAPL ADBE ALXN AMAT AMGN AMD AMZN BA BABA BAC BIDU CAT CVX DE
FB GOOG GS HD IBM INTU JPM M (Macy's) MSFT NFLX NVDA QCOM TSLA TXN
XOM WMT CMG , LRCX, SWKS, MDGL
SPPI WATT SQ TOWN
3/13/19 (Click
on Underlined link.)
Bullish MAXCPs - http://tigersoft.com/MAXCPS/Mar-13/BULLISH.htm
Bearish MAXCPs - http://tigersoft.com/MINCPs/Mar-13/BEARISH.htm
|
Table 1 QUICKSILVER on ETFS - 3/13/19
ETF       CLOSE   CHANGE     PIVOT-PT  5-dma AROC   CL-PWR    CANDLE  IP21   ITRS
---------------------------------------------------------------------------------------------
DIA       257.35    1.49     254.81         9.4%    -------      BLUE .167    -----
---------------------------------------------------------------------------------------------
BA        377.14    1.73     422.56      -578.5%    Bullish      RED  .237   .075
---------------------------------------------------------------------------------------------
SPY       281.34    1.85     275.01        72.4%    Bullish      BLUE .145   .019
---------------------------------------------------------------------------------------------
QQQ       177.01    1.32     171.43        99.5%    Bullish      BLUE .177   .041
---------------------------------------------------------------------------------------------
MDY       345.74    1.54     340.19        39%      Bullish      BLUE .116   .038
---------------------------------------------------------------------------------------------
IWM       154.98    .61      151.68        64.1%    -------      BLUE .117   .05
---------------------------------------------------------------------------------------------
FAS       63.62    1.18      59.78         187.6%   Bullish      BLUE .077   .34
---------------------------------------------------------------------------------------------
RETL      30.47    .23       29.21        -11.8%    Bearish      BLUE .169   .216
---------------------------------------------------------------------------------------------
SOXL      129.06    1.56     117.83        289.7%   -------      RED  .013   .462
---------------------------------------------------------------------------------------------
TECL      128.99    2.53     116.92        358.8%   Bullish      BLUE .184   .443
---------------------------------------------------------------------------------------------
IBB       113.3     1.46     109.14        155.8%   Bullish      BLUE .082   .078
---------------------------------------------------------------------------------------------
GLD       123.84    .86      121.51        91.2%    Bearish      BLUE .033  -.094
---------------------------------------------------------------------------------------------
OIH       17.07    .27       16.47         87.7%    Bearish      BLUE-.052   .092
---------------------------------------------------------------------------------------------
YINN      25.76   -.12       26.07        -15.4%    Bearish      RED -.006   .105
---------------------------------------------------------------------------------------------
RSX       20.64    .08       20.31         4.9%     Bearish      BLUE-.14   -.016
|
 Table 2   Count of Stocks in Key Directories
           2019-03-13
-------------------------------
NEWHIGHS       206  Bullish ratio.
NEWLOWS        14
MAXCP          50
MINCP          8
TTTNH          21
TTTNL          21
FASTUP         87
FASTDOWN       60
CPCROSSA       132
CPCROSSD       41
BIGVOLUP       6
BIGVODN        12
ACCUMVER       15
HIGHIP21       14
HIUPPCT        9
VHIP21         32
LOWACCUM       162
REDSELL        31
AUGSELS7       24
TRAPDOOR       20
|
Table 3 RANKING OF KEY DIRECTORIES BASED PCT.OF STOCKS ABOVE 65-DMA
              3/13/19
 Bullish = 43
 Bearish = 2
---------------------------------------------------------------------------------------
Directory     Current       day-1         day-2         day-3         day-4         day-5
----------------------------------------------------------------------------------------
BIGBANKS       1             1             1             .857          .857          1
BONDFUND       .98           .98           .99           .99           .98           .971
UTILITY        .95           .975          .95           .95           .9            .925
SOLAR          .941          .882          .941          .882          .823          .882
REGBANKS       .928          .928          .928          .857          .821          .892
DJI-13         .923          .923          .923          .846          .923          .923
HOMEBLDG       .882          .941          .941          .941          .941          .823
ETFS           .879          .879          .879          .672          .706          .844
NIFTY          .877          .877          .877          .824          .824          .877
SP-100         .87           .838          .827          .741          .784          .806
DOWJONES       .866          .866          .866          .833          .866          .833
FINANCE        .866          .855          .844          .788          .755          .844
SEMI           .862          .836          .862          .793          .801          .853
FIDSTKS        .859          .854          .827          .783          .8            .816
SP500          .848          .836          .824          .775          .793          .812
INFRA          .833          .805          .777          .75           .75           .75
NASD-100       .83           .82           .79           .75           .75           .81
ELECTRON       .827          .808          .814          .771          .771          .808
GREEN          .826          .826          .826          .826          .826          .826
HACKERS        .818          .818          .818          .772          .772          .772
GOLD           .803          .784          .705          .745          .568          .549
RUS-1000       .803          .792          .78           .729          .745          .767
INSURANC       .8            .8            .8            .733          .7            .766
INDEXES        .795          .774          .758          .725          .725          .747
REIT           .785          .812          .765          .704          .684          .744
INDMATER       .784          .746          .721          .721          .734          .734
CHINA          .779          .762          .796          .694          .762          .864
CHEM           .777          .796          .814          .777          .814          .796
RETAIL         .754          .716          .716          .679          .698          .716
OILGAS         .753          .69           .626          .563          .64           .64
MILITARY       .75           .75           .718          .718          .718          .75
TRANSP         .75           .75           .7            .55           .6            .7
SOFTWARE       .746          .761          .809          .73           .698          .746
BIG17          .739          .717          .673          .652          .652          .63
COMPUTER       .727          .681          .727          .681          .727          .772
BIOTECH        .714          .687          .666          .605          .608          .608
EDU            .666          .666          .666          .666          .666          .666
GUNS           .647          .647          .647          .647          .647          .647
AUTO           .641          .641          .615          .538          .589          .641
COMODITY       .634          .56           .536          .512          .487          .512
BEVERAGE       .611          .555          .666          .555          .555          .611
FOOD           .581          .527          .472          .472          .418          .436
COAL           .571          .571          .428          .428          .428          .428
=============================================================================================
JETS           .5            .5            .5            .3            .3            .4
=============================================================================================
GAMING         .458          .5            .583          .5            .5            .625
HOSPITAL       .416          .416          .375          .375          .333          .375
|
====================================================================
3/12/2019 The Buy B4 and the V-formation
are still in place. But the DJI is being
held back by Boeing and by the technical problems created by its
potential head and shoulders pattern. A closing by the DJI below the
H/S would have to be judged a Sell S10. But that could also bring a
nullifying Buy B9 since the P-I would likely be positive a the lower
band.... The DJI will be doing well just to rally given Boeing's situation
and the uncertainties that introduces. Each 10 points that Boeing falls
drops the DJI by 70.
Fortunately, the V-formation and the January Buy B4 argue for a move
to 27000. Signals on the DJI chart are shown just below. It does show a
potential H/S. But understand that very often a bearish-looking head/shoulders
pattern becomes short-term bullish when prices go above the apex of the right
shoulders. (Presumably, it is at this point that shorts become very nervous.)
The NYSE A/D Line remains bullish and 87% of all the trading instruments
we follow are above their 65-dma. Seasonality is bullish and so are most stocks.
Assuming the DJI can stay above 25000, it will next challenge
26100 and when that is conquered, we will see a move to 27000.
If the FED cooperates and BA is exonerated, we should see an
exciting move past 27000 to 30000.
Right now, there is still a certain amount of caution. But I take it as a
good sign about interest rates that the DJI-Untilities Index has just made a new
12-month high and the interest rates on 10-year bonds have just made a
new low.


I would prefer to stay long the tech ETFs, SOXL or TECL. They will
hold up better than the DJI. So should IWM. Each of these shows a
rising Closing Power.
It is very rare for the DJI to lead the rest of the market lower. There
are only a handful of cases, most notably 1977 and 2001. Much
more likely would for Peerless to give a Buy B9 based on positive
breadth (P-I) as the DJI tags the lower band. But US intervention
in Venezuela could create a whote batch of new uncertainties that would
likely hold back the market in what should be a normally bullish period of time.
SPY - 281-282 is important overhead resistance.

IWM - working on surpassing its 21-dma

SOXL- Very close to breaking downtrend
and bullishly destroying a potential H/S/

TECL - Big Move up Today

Charts 3/12/2019
2018 PEERLESS DJI, Signals,
Indicators Daily DJI Volume 10-DayUp/Down Vol
Hourly DJIA A/D Line for All Stocks
Inverted Traders Index
NASDAQ S&P OEX NYSE COMPQX DJI-15 DJI-20 DJI-30
DIA SPY QQQ MDY IWM TNA
Short-Term Rates
USO-CrudeOil DBO FAS GLD BBH IBB JETS JNUG KOL NUGT OIH OIL RSX RETL
SDS AGQ SLV SOXL TECL TLT TMF TNA UGA (gasoline) XIV YINN
Commodities: CANE
CORN DBC JJC, NIB, CHOC CORN, CUT (paper)
MOO, SOYB WEAT UUP (Dollar) LIT
(Lithium)
AAPL ADBE ALXN AMAT AMGN AMD AMZN BA BABA BAC BIDU CAT CVX DE
FB GOOG GS HD IBM INTU JPM M (Macy's) MSFT NFLX NVDA QCOM TSLA TXN
XOM WMT CMG , LRCX, SWKS, MDGL
SPPI WATT SQ TOWN
3/12/19 (Click
on Underlined link.)
Bullish MAXCPs - http://tigersoft.com/MAXCPS/Mar-12/BULLISH.htm
Bearish MAXCPs - http://tigersoft.com/MINCPs/Mar-12/BEARISH.htm
|
Table 1 QUICKSILVER on ETFS - 3/12/19
ETF       CLOSE   CHANGE     PIVOT-PT  5-dma AROC   CL-PWR       CANDLE  IP21   ITRS
---------------------------------------------------------------------------------------------
DIA       255.86   -.9       256.87       -45.5%    Bullish      RED    .138    ------
---------------------------------------------------------------------------------------------
BA        375.41   -24.6     424.46      -651.4%    Bullish      RED    .158    .077
---------------------------------------------------------------------------------------------
SPY       279.49   1.05      277.33         8.5%    Bullish      BLUE   .154    .02
---------------------------------------------------------------------------------------------
QQQ       175.69    .96      173.56        32.9%    Bullish      BLUE   .179    .042
---------------------------------------------------------------------------------------------
MDY       344.2     .49      343.07       -51.8%    Bullish      BLUE   .175    .042
---------------------------------------------------------------------------------------------
IWM       154.37    .08      153.02       -55.8%    Bullish      ----   .18     .059
---------------------------------------------------------------------------------------------
FAS       62.44     .62       61.33        -3.3%    Bullish      BLUE   .09     .321
---------------------------------------------------------------------------------------------
SOXL      127.5    1.47     121.98        -30.7%    -------      BLUE   .058    .486
---------------------------------------------------------------------------------------------
TECL      126.46   2.07     120.31        172.7%    Bullish      BLUE   .185    .408
---------------------------------------------------------------------------------------------
IBB       111.84    .91      109.87       -71.6%    Bullish      BLUE   .086    .069
---------------------------------------------------------------------------------------------
GLD       122.98    .74      121.61        51.6%    Bearish      BLUE   .006   -.086
---------------------------------------------------------------------------------------------
OIH       16.8      .27       16.78        -159.3%  -------      BLUE  -.022    .094
---------------------------------------------------------------------------------------------
GASL      7.03      .46        7.12        -463.1%  -------      BLUE   .017    .203
---------------------------------------------------------------------------------------------
RSX       20.56     .07       20.62        -17.1%   -------      ----  -.165    .005
|
Table 2
Count of Stocks in Key Directories
2019-03-12
-------------------------------
NEWHIGHS 195 Bullish
NEWLOWS 12
MAXCP 53
MINCP 6
TTTNH 16
TTTNL 11
FASTUP 50
FASTDOWN 90
CPCROSSA 107
CPCROSSD 42
BIGVOLUP 5
BIGVODN 8
ACCUMVER 24
HIGHIP21 8
HIUPPCT 11
VHIP21 31
LOWACCUM 152
REDSELL 32
AUGSELS7 17
TRAPDOOR 20 |
 Table 3
      RANKING OF KEY DIRECTORIES BASED PCT.OF STOCKS ABOVE 65-DMA
              3/12/19
      Bullish 43
      Bearish  1
---------------------------------------------------------------------------------------
Directory     Current       day-1         day-2         day-3         day-4         day-5
----------------------------------------------------------------------------------------
BIGBANKS       1             1             .857          .857          1             1
BONDFUND       .98           .99           .99           .98           .971          .971
UTILITY        .975          .95           .95           .9            .925          .95
HOMEBLDG       .941          .941          .941          .941          .823          .941
REGBANKS       .928          .928          .857          .821          .892          1
DJI-13         .923          .923          .846          .923          .923          .923
SOLAR          .882          .941          .882          .823          .882          .882
ETFS           .879          .879          .672          .706          .827          .896
NIFTY          .877          .877          .824          .824          .877          .877
DOWJONES       .866          .866          .833          .866          .8            .833
FINANCE        .855          .844          .788          .755          .855          .877
FIDSTKS        .854          .827          .783          .8            .816          .837
SP-100         .838          .827          .741          .784          .795          .838
SEMI           .836          .862          .793          .801          .853          .87
SP500          .836          .824          .775          .793          .81           .844
GREEN          .826          .826          .826          .826          .826          .826
NASD-100       .82           .79           .75           .75           .81           .82
HACKERS        .818          .818          .772          .772          .772          .818
REIT           .812          .765          .704          .684          .738          .785
ELECTRON       .808          .814          .771          .771          .808          .839
INFRA          .805          .777          .75           .75           .75           .861
INSURANC       .8            .8            .733          .7            .766          .766
CHEM           .796          .814          .777          .814          .814          .796
RUS-1000       .792          .78           .727          .747          .767          .811
GOLD           .784          .705          .745          .568          .588          .803
INDEXES        .768          .758          .725          .725          .747          .784
CHINA          .762          .796          .694          .762          .864          .847
SOFTWARE       .761          .809          .73           .698          .73           .746
MILITARY       .75           .718          .718          .718          .75           .781
TRANSP         .75           .7            .55           .6            .7            .75
INDMATER       .746          .721          .721          .734          .734          .848
BIG17          .717          .673          .652          .652          .63           .695
RETAIL         .716          .716          .679          .698          .716          .754
OILGAS         .687          .624          .56           .638          .638          .73
BIOTECH        .685          .666          .605          .608          .605          .695
COMPUTER       .681          .727          .681          .727          .772          .772
EDU            .666          .666          .666          .666          .833          .833
GUNS           .647          .647          .647          .647          .647          .764
AUTO           .641          .615          .538          .589          .641          .692
COAL           .571          .428          .428          .428          .428          .428
COMODITY       .56           .536          .512          .487          .56           .609
BEVERAGE       .555          .666          .555          .555          .611          .722
FOOD           .527          .472          .472          .418          .49           .527
==============================================================================================
GAMING         .5            .583          .5            .5            .625          .625
JETS           .5            .5            .3            .3            .4            .4
==============================================================================================
HOSPITAL       .416          .375          .375          .333          .375          .5
|
====================================================================
3/11/2019 The Buy B4 and the V-formation
still rule our market. The first
shallow 3% decline in a V-formation has three times before been followed
by an upside breakout which leads to new 12-month highs. A continued
rally now would destroy an appearance of a possible bearish head/shoulders
pattern now in DIA and SOXL. Following my suggestions of last night,
traders should have retaken long positions in IWM and SOXL. TECL
also looks quite bullish. I would stay away from DIA for now. Boeing's
bearish news is apparently not over and Day-traders will be whipping it
around wildly for now.

The emotional stock selling induced by Friday's weak Jobs' report and the
Boeing jet crash on Sunday in Ethiopia seems to have left shares in much
stronger hands, namely those Professionals who sense the extra power of
the stock market in the third year of a Presidential Election.
Of interest, for
us was how the decline from the DJI's February peak to yesterday's low closely
matched the 3% to 3.5% declines after each of the three previous V-formation
bottoms after a larger decline of 18% or more in the DJI. We can these three
cases below: 1942, 1949 and 1971. In each case, the first decline in the
fast-up rallies of these earlier cases of V-formations was between 3% and 3.5%.
There buyers were eagerly waiting to buy on the first pull-back and the turn
upwards sent the DJI quickly much higher. We should
expect that now.
1941-1942

1949

1971-1972

Buy IWM,
SOXL and TECL.

The high volume ETFs in Table 1 had their Closing
Power downtrends broken
today. This shows Professionals are done with the downside for now and are
aggressively buying again. Last night, I suggested that this action should get
us
to purchase the ETFs with the highest IP21 and the highest ITRS in Table 1.
Using Sunday night's Hotline that would have meant buying MDY or IWM and
SOXL. Using the Table 1 tonight, that would mean buying SOXL and TECL.
If you are using TigerSoft charts, you should have taken the positions in IWM
and SOXL when you saw intra-day the clear breaks in the Closing Power
downtrends. This is much preferable to waiting to buy the next day. Below
are the enlarged CP charts of IWM, SOXL and TECL.


Table 1 QUICKSILVER on ETFS - 3/11/19
ETF       CLOSE   CHANGE     PIVOT-PT  5-dma AROC   CL-PWR       CANDLE  IP21   ITRS
---------------------------------------------------------------------------------------------
DIA       256.76    2.05     258.19       -29.6%    Bullish      BLUE   .223   -----
---------------------------------------------------------------------------------------------
BA        400.01   -22.53    430.12       -383.1%   Bullish      BLUE   .359   .152
---------------------------------------------------------------------------------------------
SPY       278.44    3.98     279.02       -17.3%    Bullish      BLUE   .196   .008
---------------------------------------------------------------------------------------------
QQQ       174.73    3.56     174.55        9%       Bullish      BLUE   .207   .023
---------------------------------------------------------------------------------------------
MDY       343.71    4.49     347.75       -80.1%    Bullish      BLUE   .196   .031
---------------------------------------------------------------------------------------------
IWM       154.29    2.65     156.08       -81.9%    Bullish      BLUE   .214   .047
---------------------------------------------------------------------------------------------
FAS       61.82     2.08      62.48       -84.9%    Bullish      BLUE   .141   .327
---------------------------------------------------------------------------------------------
RETL      30.02     1.51      31.23       -80%      -------      BLUE   .157   .193
---------------------------------------------------------------------------------------------
SOXL      126.03    8.39     128.25       -165.6%   Bullish      BLUE   .082   .481
                                                                               ^^^^^
---------------------------------------------------------------------------------------------
TECL      124.39    7.62     122.31        36.3%    Bullish      BLUE   .232   .408
                                                                        ^^^^
---------------------------------------------------------------------------------------------
IBB       110.93    2.32     113.42       -138.7%   Bullish      BLUE   .121   .047
---------------------------------------------------------------------------------------------
GLD       122.24   -.6       121.72        27.9%    Bearish      RED   -.018  -.101
---------------------------------------------------------------------------------------------
OIH       16.53    .46       17.33        -282.3%   Bearish      BLUE  -.041   .044
---------------------------------------------------------------------------------------------
RSX       20.49    .32       20.63        -2.4%     -------      BLUE  -.155  -.035
|
Table 2    Count of Stocks in Key Directories
           2019-03-11
-------------------------------
NEWHIGHS       166  Bullish 10x new lows.
NEWLOWS        14
MAXCP          49   Rising quickly.
MINCP          6
TTTNH          21
TTTNL          18
FASTUP         57
FASTDOWN       119
CPCROSSA       361  Bullish Ratio of 10x.
CPCROSSD       35
BIGVOLUP       8
BIGVODN        9
ACCUMVER       30
HIGHIP21       13
HIUPPCT        11
VHIP21         30
LOWACCUM       151
REDSELL        40
AUGSELS7       15
TRAPDOOR       24
|
Table 3   RANKING OF KEY DIRECTORIES BASED PCT.OF STOCKS ABOVE 65-DMA
              3/11/19
          Bullish = 42
          Bearish = 3
---------------------------------------------------------------------------------------
Directory     Current       day-1         day-2         day-3         day-4         day-5
----------------------------------------------------------------------------------------
BIGBANKS       1             .857          .857          1             1             1
BONDFUND       .99           .99           .98           .971          .971          .971
UTILITY        .95           .95           .9            .925          .925          .925
HOMEBLDG       .941          .941          .941          .823          .941          .941
SOLAR          .941          .882          .823          .882          .882          .882
REGBANKS       .928          .857          .821          .892          1             1
DJI-13         .923          .846          .923          .923          .923          .923
ETFS           .879          .672          .706          .827          .896          .896
NIFTY          .877          .824          .824          .877          .877          .859
DOWJONES       .866          .833          .866          .8            .833          .833
SEMI           .862          .793          .801          .853          .87           .896
FINANCE        .844          .788          .755          .855          .877          .888
FIDSTKS        .827          .783          .8            .816          .827          .832
SP-100         .827          .741          .784          .795          .827          .827
GREEN          .826          .826          .826          .826          .826          .869
SP500          .824          .775          .793          .81           .84           .846
HACKERS        .818          .772          .772          .772          .772          .818
CHEM           .814          .777          .814          .814          .814          .796
ELECTRON       .814          .771          .771          .808          .839          .864
SOFTWARE       .809          .73           .698          .73           .761          .809
INSURANC       .8            .733          .7            .766          .766          .766
CHINA          .796          .694          .762          .864          .847          .847
NASD-100       .79           .75           .75           .81           .82           .82
RUS-1000       .78           .727          .745          .769          .811          .816
INFRA          .777          .75           .75           .75           .861          .861
REIT           .765          .704          .684          .738          .785          .798
INDEXES        .763          .725          .725          .747          .784          .79
COMPUTER       .727          .681          .727          .772          .772          .772
INDMATER       .721          .721          .734          .734          .848          .848
MILITARY       .718          .718          .718          .75           .781          .781
RETAIL         .716          .679          .698          .716          .754          .754
GOLD           .705          .745          .568          .588          .803          .803
TRANSP         .7            .55           .6            .7            .7            .75
BIG17          .673          .652          .652          .63           .695          .695
BEVERAGE       .666          .555          .555          .611          .722          .722
EDU            .666          .666          .666          .833          .833          .666
BIOTECH        .664          .605          .608          .605          .685          .706
GUNS           .647          .647          .647          .647          .764          .764
OILGAS         .624          .56           .638          .638          .716          .751
AUTO           .615          .538          .589          .641          .692          .692
GAMING         .583          .5            .5            .625          .625          .666
COMODITY       .536          .512          .487          .56           .56           .585
=============================================================================================
JETS           .5            .3            .3            .4            .4            .4
=============================================================================================
FOOD           .472          .472          .418          .49           .49           .509
COAL           .428          .428          .428          .428          .428          .428
HOSPITAL       .375          .375          .333          .375          .458          .5
|
======================================================================
3/8/2019 Use any early weakness on
Monday to cover the short sales in FAS and SOXL.
When
their short-term Closing Power downtrends are broken, we will
consider
buying the highest ranked ETFs in Table 1, based on IP21 and ITRS.
There
should be very good support for the DJI between 24500 and 25000.
As
the P-I and IP21 are both positive, a 1.5% decline will probably bring
a
bullish Buy B9.

Boeing's stock is down 9% at this writing. By itself, a drop in a single DJI
stock of 52 points would make the DJI fall by more than 319 points. But
the DJI is down "only" 170 right now. So clearly, the rest of the DJI
stocks
are being bought by contrarians on this news that a second Boeing 737-max
has crashed shortly after take-off in Addis Ababa. The experts have hardly
begun to investigate and already these Boeing jets are being grounded and the
worst-case scenarios for BA's stock are being discussed. But what if the plane
went down because of terrorism? The US and Ethiopia are allies in a very active
and bloody campaign against Somalia. BA would go right back up. We
will watch BA's Closing Power downtrend and probably buy it when its CP
downtrend
ends. This worked very well in British Petroleum's case in 2010 after its big and
totally unexpected oil spill in the Gulf of Mexico.
Watch BA's Closing Power.

When BP's Closing Power's downtrend ended,
it again should have been bought back in 2010.

------------------------------------------------ Sources
---------------------------------------------
https://www.nytimes.com/2019/03/10/business/boeing-737-max.html?emc=edit_th_190311&nl=todaysheadlines&nlid=582238940311
www.africanews.com/.../ethiopia-air-force-bombards-al-shabaab-in-somalia-two-leade...
U.S.
Airstrikes Kill Hundreds in Somalia as Shadowy Conflict Ramps Up
--------------------------------------------------------------------------------------------------------
I take the operative Peerless signal to still be the January B4. Ordinarily,
this signal leads us to expect a move up by more than 10%. So, unless the
unexpected happens, the DJI should reach 27800. Peerless emphasizes
seasonality, the Federal Reserve and politics. Usually, because of politics,
the third year of a Presidential Election is nearly 3x more bullish more than
the year of the Election or the first year afterwards, or the second year
afterwards. Trump's contentious relationship with Congressional Democrats
could bring a decline. But Senate Republicans are not ready to vote
for impeachment and Bill Cinton's impeachment in 1999 did not stop
the DJI from rallying in a strong market when short-term interest rates were
falling.
So, I've suggested the FED is the most important element in the picture now.
Since Fed Chairman says short-term rates are, in effect, frozen, that he not worried
about an economic slow-down and that the Fed will only make decisions based
on what the economic data show, I would think the Buy B4 will produce signifiantly
higher prices.
A decline by SPY to 268 could set up
a new H/S pattern. The best support
here should be at 265.

We have just seen a "straight-up" advance of nearly 20% in a V-formation.
Such price action in 1942, 1949 and 1971-2 always brought new highs after
a 20% decline, I think we have to remain bullish. But seasonality needs to
be allowed to play out without bearish exogenous influences intruding.
The appearance of a quick head and shoulders pattern in the DJI is a warning
that the market has had to quickly adjust to some new unexpected bearish
non-economic and exogenous news. When past head/shoulders formations
have quickly appeared in the past - in under 15 days - most often they bring a
DJI
decline to the 65-dma. That is what seems most likely here. Keep in mind
that the rapid advance has left many traders and investors on the sideline
waiting for a pull-back to take their positions. In addition, any DJI close
near the 65-dma will almost certainly bring new Peerless Buys.
See the charts of all the DJI's H/S patterns since 1915 here.
http://tigersoft.com/H-S/H-S.htm
The Dollar remains very strong. One would think this that would give
the FED some room to lower interest rates if the economy weakens or
stocks go down.
Table 1 QUICKSILVER on ETFS - 3/8/19
ETF       CLOSE   CHANGE     PIVOT-PT  5-dma AROC   CL-PWR     CANDLE IP21   ITRS
---------------------------------------------------------------------------------------------
DIA       254.71   -.1       258.28       -110.8%   Bullish      BLUE .161   -----
---------------------------------------------------------------------------------------------
BA        422.54   -.02      432.69       -210.2%   Bullish      BLUE .094   .269
---------------------------------------------------------------------------------------------
SPY       274.46   -.55      279.4        -107.1%   Bullish      BLUE .164   .003
---------------------------------------------------------------------------------------------
QQQ       171.17   -.26      174.42       -92.7%    Bullish      BLUE .159   .025
---------------------------------------------------------------------------------------------
MDY       339.22   -.97      349.22       -168%     -------      BLUE .171   .023
                                                                      ^^^^
---------------------------------------------------------------------------------------------
IWM       151.64   -.04      156.81       -212.7%   Bullish      BLUE .171   .037
                                                                      ^^^^
---------------------------------------------------------------------------------------------
FAS       59.74   -.04       62.86        -328%     Bullish      BLUE .138   .423
---------------------------------------------------------------------------------------------
SOXL      117.64   -.19      130.11       -493.9%   -------      BLUE .027   .586
                                                                      ^^^^^
---------------------------------------------------------------------------------------------
TECL      116.77   -.15      123.52       -330.3%   Bullish      BLUE .165   .525
---------------------------------------------------------------------------------------------
IBB       108.61   -.53      114.01       -289.4%   -------      BLUE .041   .044
---------------------------------------------------------------------------------------------
GLD       122.84    1.33     121.56        39.5%    Bearish      BLUE-.013  -.144
---------------------------------------------------------------------------------------------
OIH       16.07   -.4        17.48        -394.8%   Bearish      --- -.086   .039
---------------------------------------------------------------------------------------------
GASL      6.31   -.57        7.83         -882.3%   -------      RED -.097   .303
---------------------------------------------------------------------------------------------
RSX       20.17   -.14       20.5         -65.9%    -------      --- -.188  -.074
|
Table 2   Count of Stocks in Key Directories
          20190308
-------------------------------
NEWHIGHS       94
NEWLOWS        36
MAXCP          22
MINCP          17
TTTNH          6
TTTNL          55
FASTUP         42
FASTDOWN       206
CPCROSSA       187
CPCROSSD       33
BIGVOLUP       6
BIGVODN        16
ACCUMVER       46
HIGHIP21       15
HIUPPCT        10
VHIP21         31
LOWACCUM       152
REDSELL        41
AUGSELS7       17
TRAPDOOR       25
|
Table 3  RANKING OF KEY DIRECTORIES BASED PCT.OF STOCKS ABOVE 65-DMA
               3/8/19
 Bullish = 41
 Bearish = 4
---------------------------------------------------------------------------------------
Directory     Current       day-1         day-2         day-3         day-4         day-5
----------------------------------------------------------------------------------------
BONDFUND       .99           .98           .971          .971          .971          .952
UTILITY        .95           .9            .925          .925          .925          .925
HOMEBLDG       .941          .941          .823          .941          .941          .882
SOLAR          .882          .823          .882          .882          .882          .882
BIGBANKS       .857          .857          1             1             1             1
REGBANKS       .857          .821          .892          1             1             1
DJI-13         .846          .923          .923          .923          .846          .923
DOWJONES       .833          .866          .8            .833          .8            .866
GREEN          .826          .826          .826          .826          .869          .826
NIFTY          .824          .824          .877          .877          .859          .912
SEMI           .793          .801          .853          .87           .896          .862
FINANCE        .788          .755          .855          .877          .888          .888
FIDSTKS        .783          .8            .816          .827          .821          .854
CHEM           .777          .814          .814          .814          .814          .833
SP500          .775          .793          .81           .84           .844          .869
HACKERS        .772          .772          .772          .772          .818          .863
ELECTRON       .771          .771          .808          .839          .864          .851
INFRA          .75           .75           .75           .861          .861          .861
NASD-100       .75           .75           .81           .82           .81           .83
GOLD           .745          .568          .588          .803          .803          .823
SP-100         .741          .784          .795          .827          .817          .881
INSURANC       .733          .7            .766          .766          .8            .866
SOFTWARE       .73           .698          .73           .761          .809          .873
RUS-1000       .727          .745          .767          .812          .815          .834
INDEXES        .724          .729          .751          .789          .8            .821
INDMATER       .721          .734          .734          .848          .848          .822
MILITARY       .718          .718          .75           .781          .781          .812
REIT           .704          .684          .738          .785          .791          .778
CHINA          .694          .762          .864          .847          .83           .813
COMPUTER       .681          .727          .772          .772          .772          .772
RETAIL         .679          .698          .716          .754          .754          .754
ETFS           .672          .706          .827          .896          .896          .913
EDU            .666          .666          .833          .833          .666          .833
BIG17          .652          .652          .63           .695          .695          .695
GUNS           .647          .647          .647          .764          .764          .882
BIOTECH        .603          .608          .605          .685          .703          .716
OILGAS         .56           .638          .638          .716          .751          .751
BEVERAGE       .555          .555          .611          .722          .722          .722
TRANSP         .55           .6            .7            .7            .75           .8
AUTO           .538          .589          .641          .692          .666          .794
COMODITY       .512          .487          .56           .56           .536          .585
GAMING         .5            .5            .625          .625          .666          .666
===============================================================================================
FOOD           .464          .41           .482          .482          .464          .517
COAL           .428          .428          .428          .428          .428          .714
HOSPITAL       .375          .333          .375          .458          .5            .583
JETS           .3            .3            .4            .4            .4            .5
|
           .533          .533          .6            .466
BIOTECH        .442          .413          .463          .407          .394          .413
COAL           .428          .428          .428          .285          .285          .285
HOSPITAL       .416          .458          .541          .5            .458          .416
OILGAS         .335          .28           .349          .26           .226          .239
EDU            .333          .5            .5            .5            .333          .333
BIG17          .282          .347          .369          .326          .369          .391
|


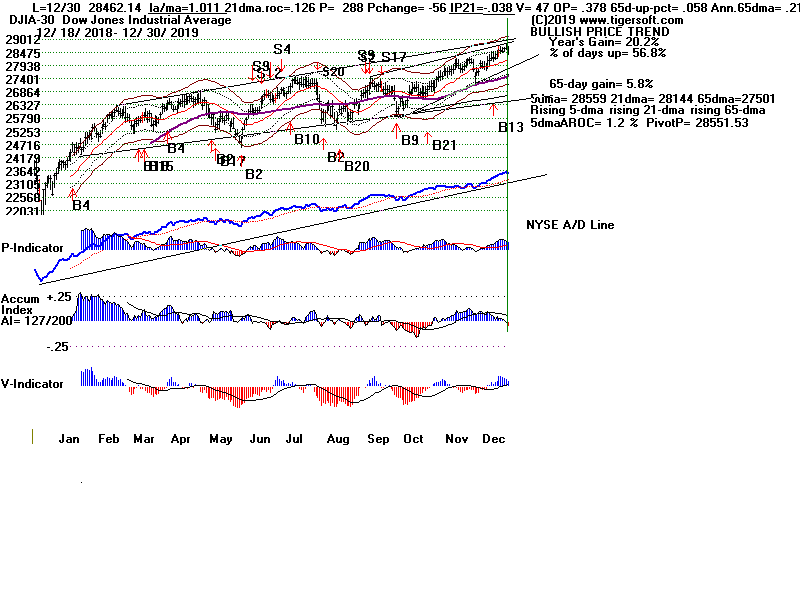
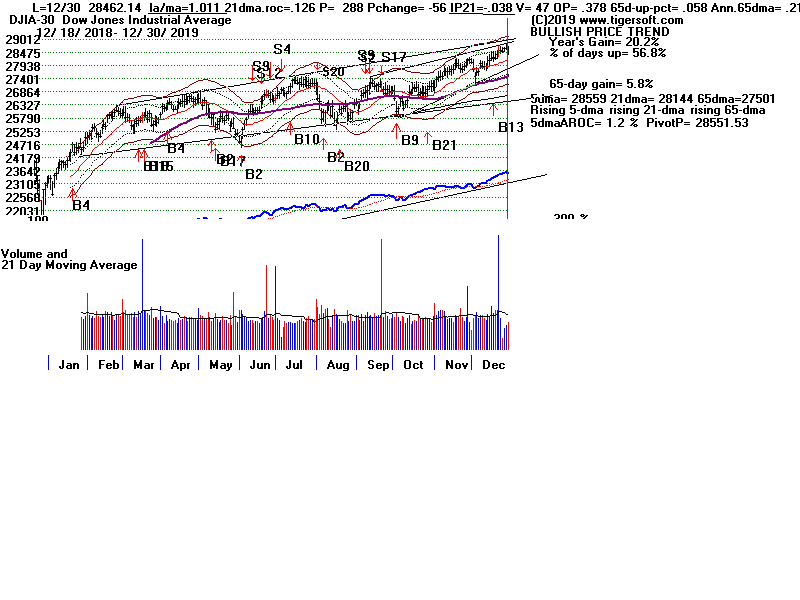
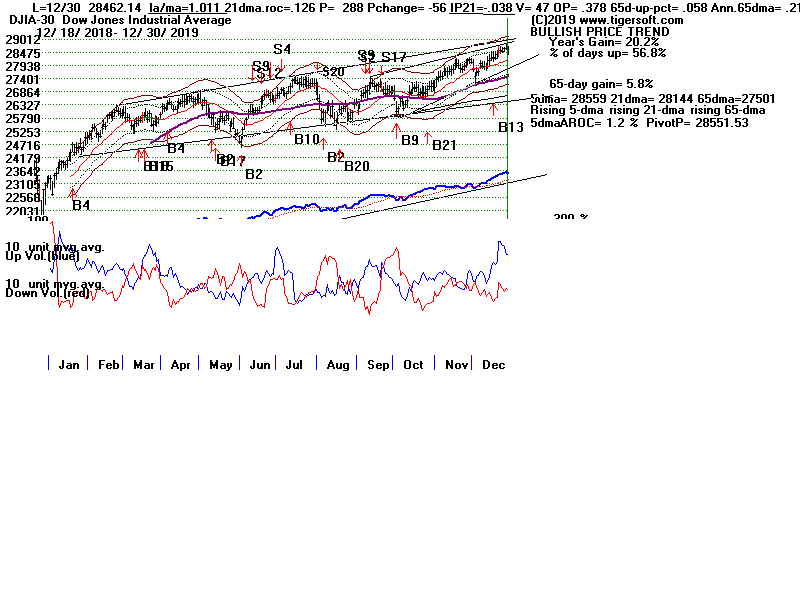
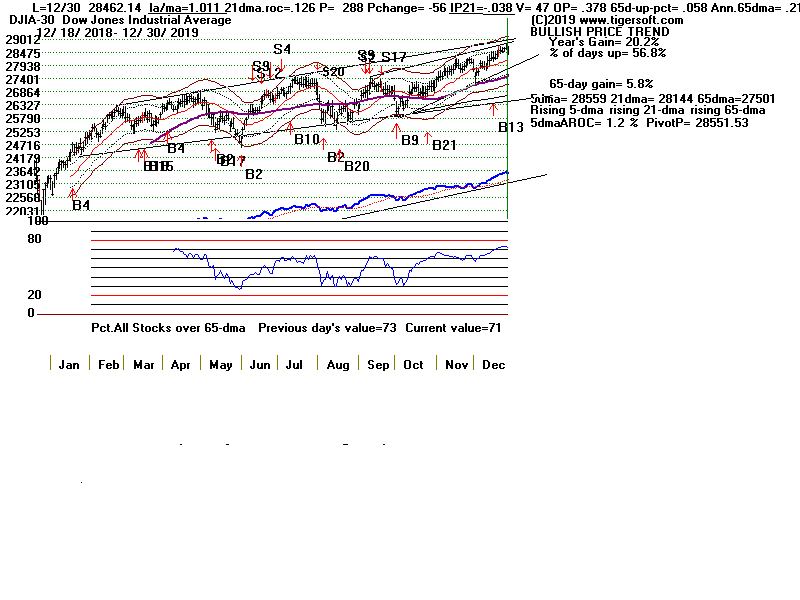
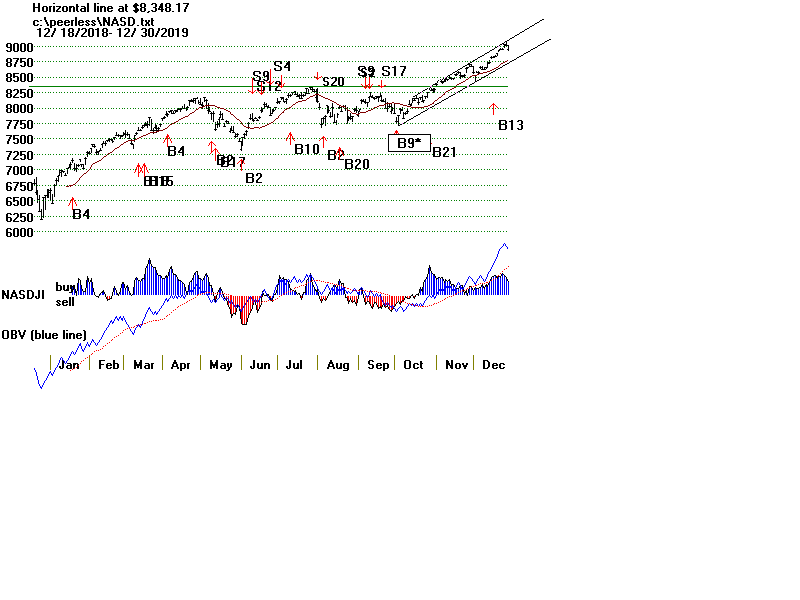
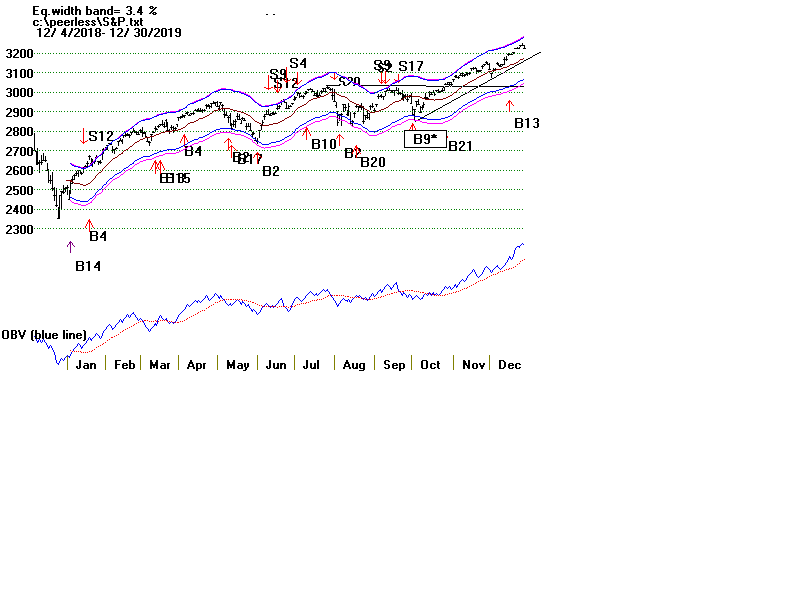
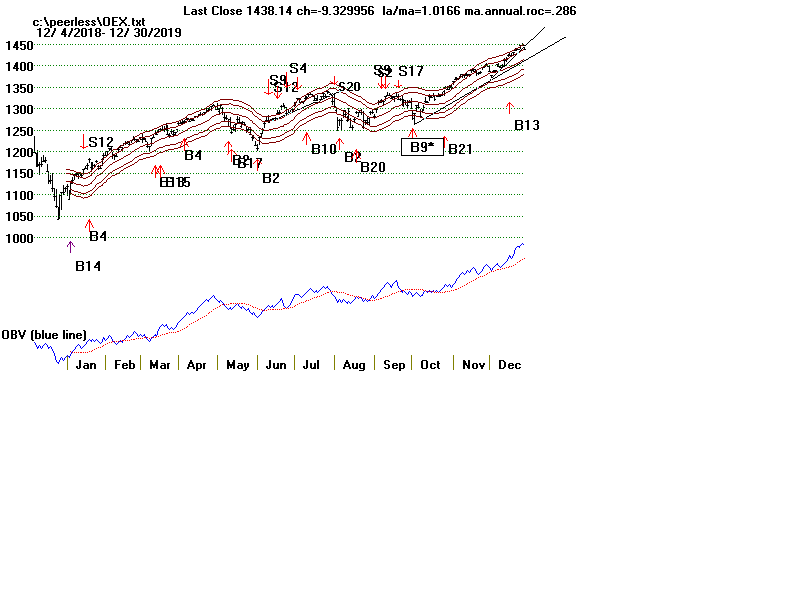
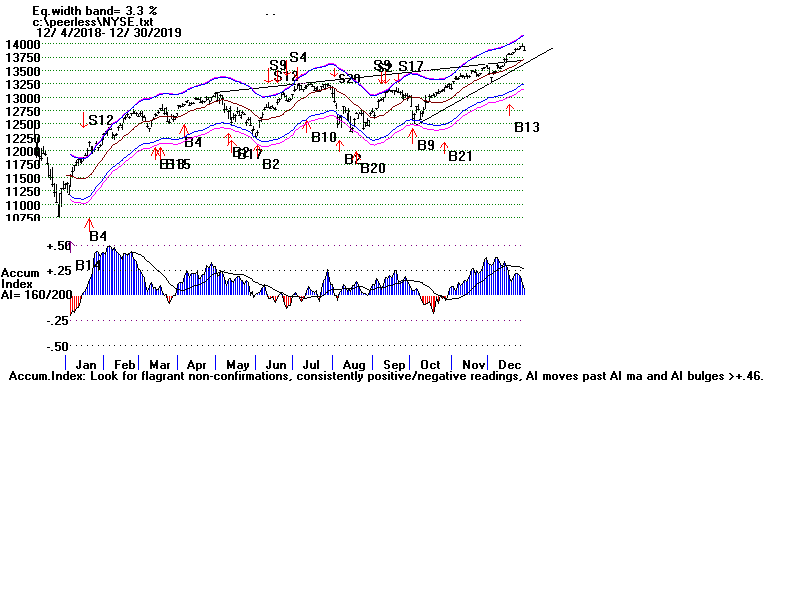
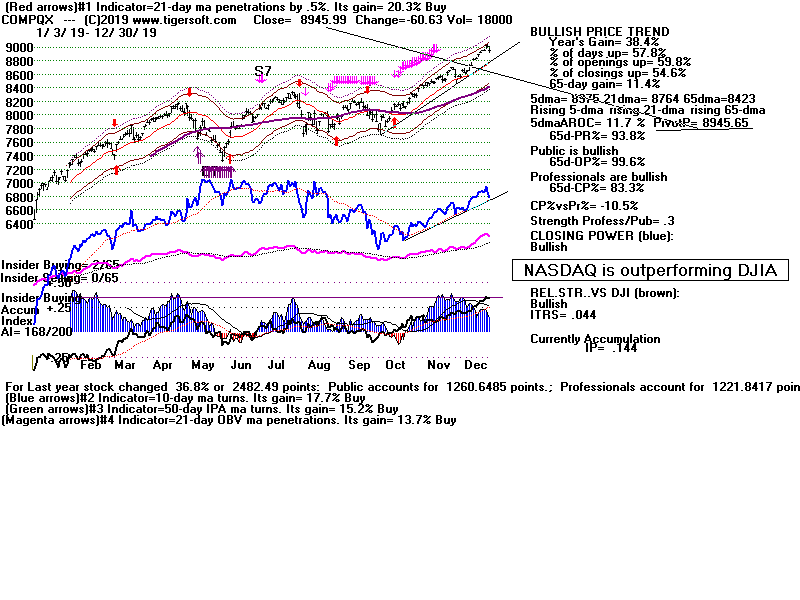
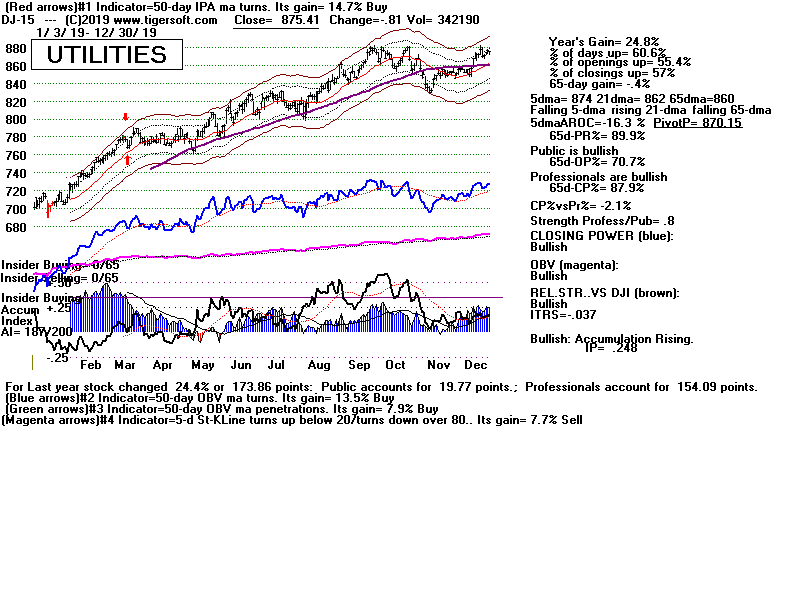
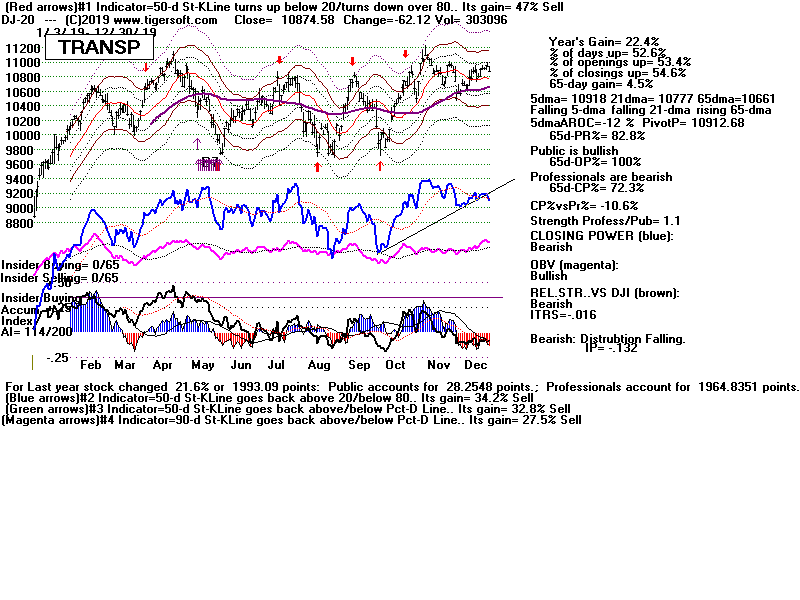
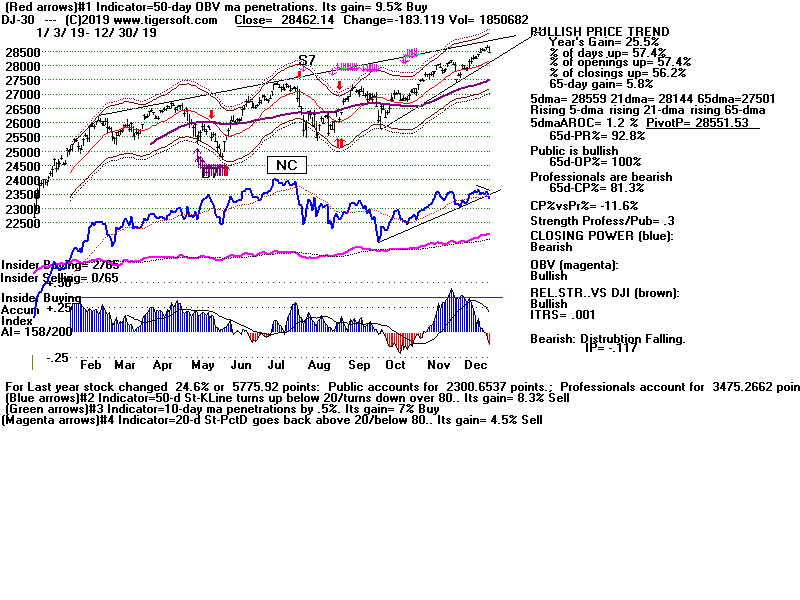
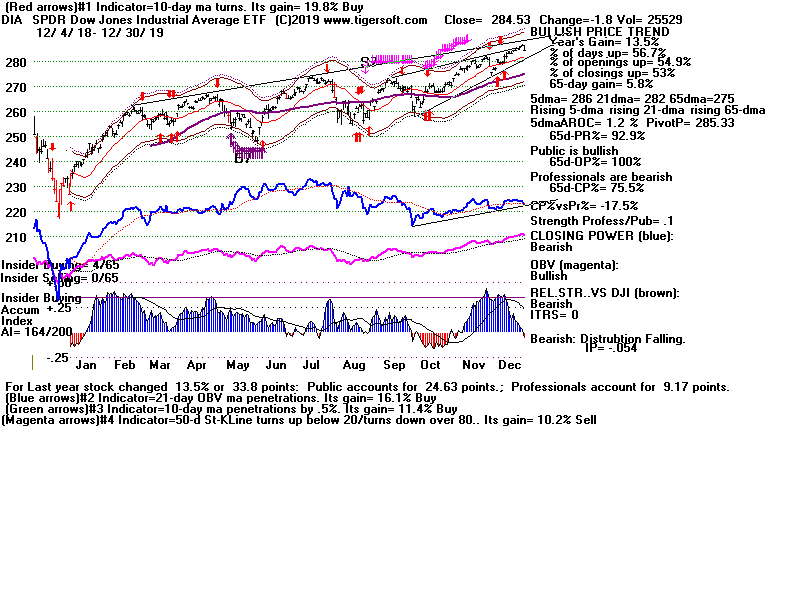
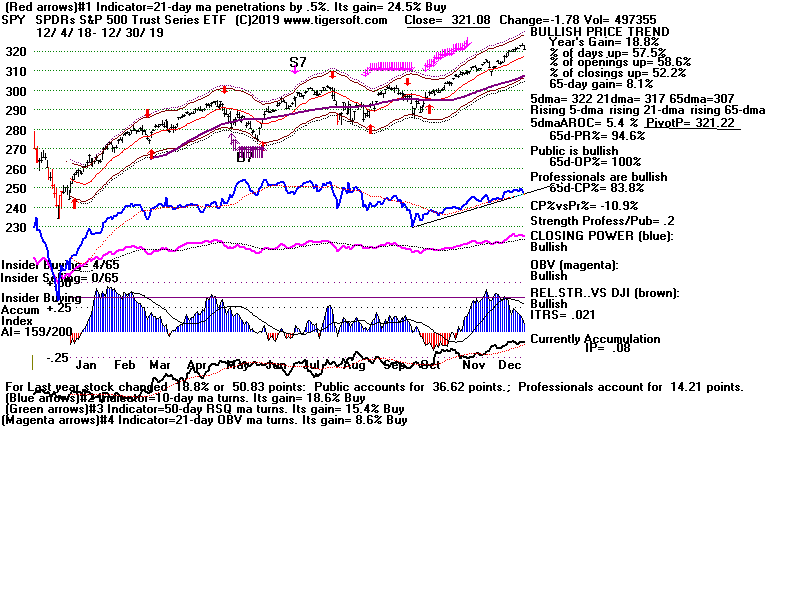
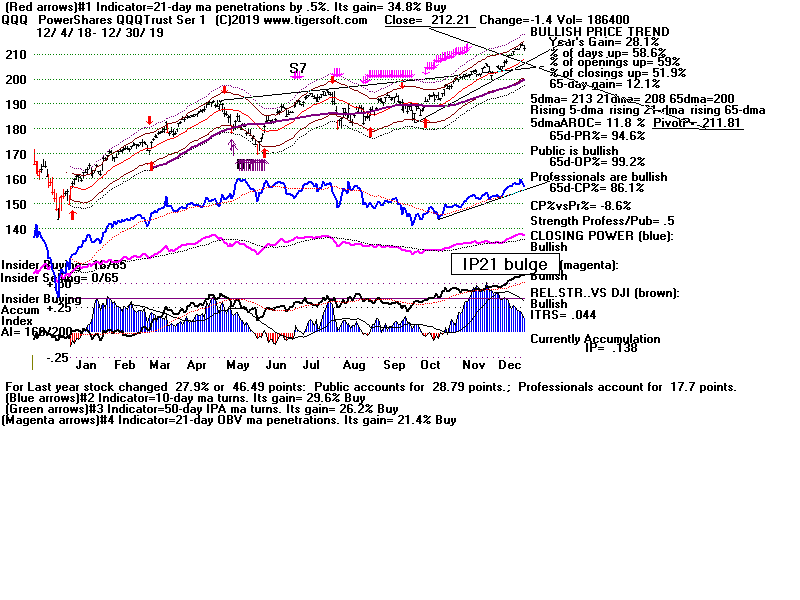
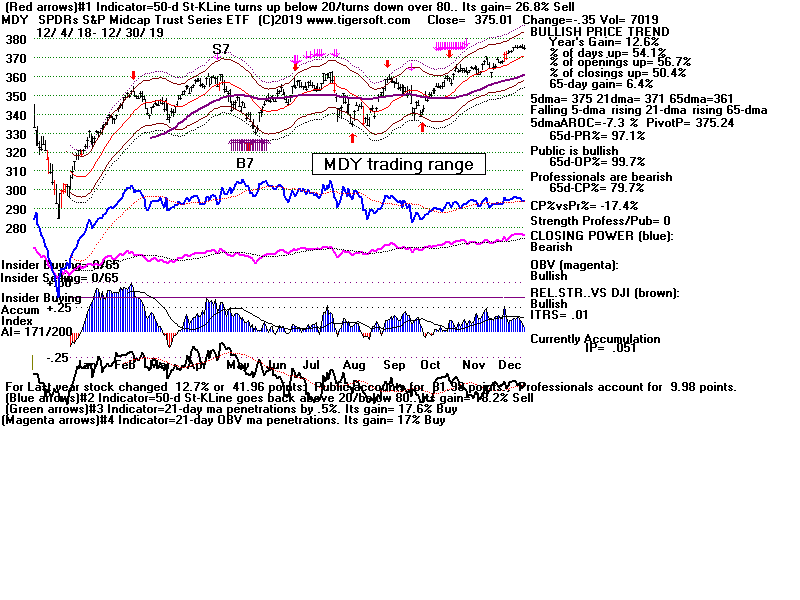
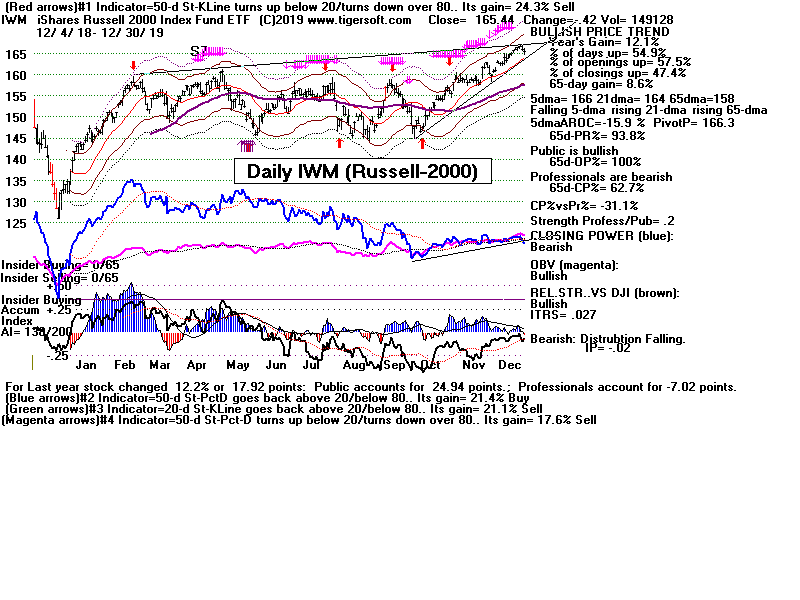
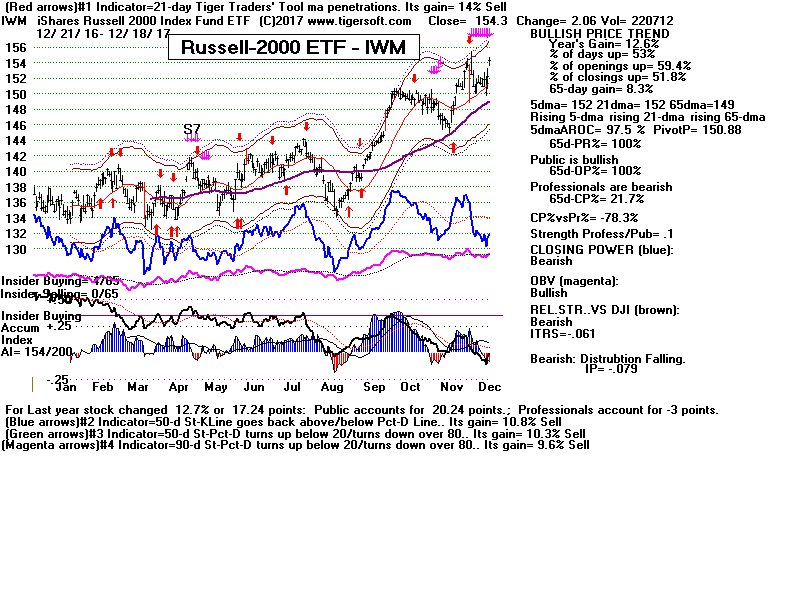
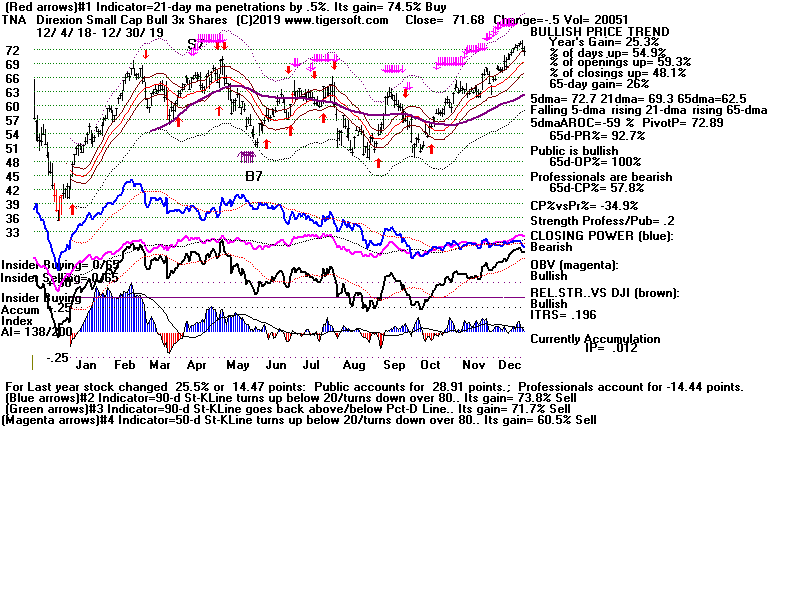
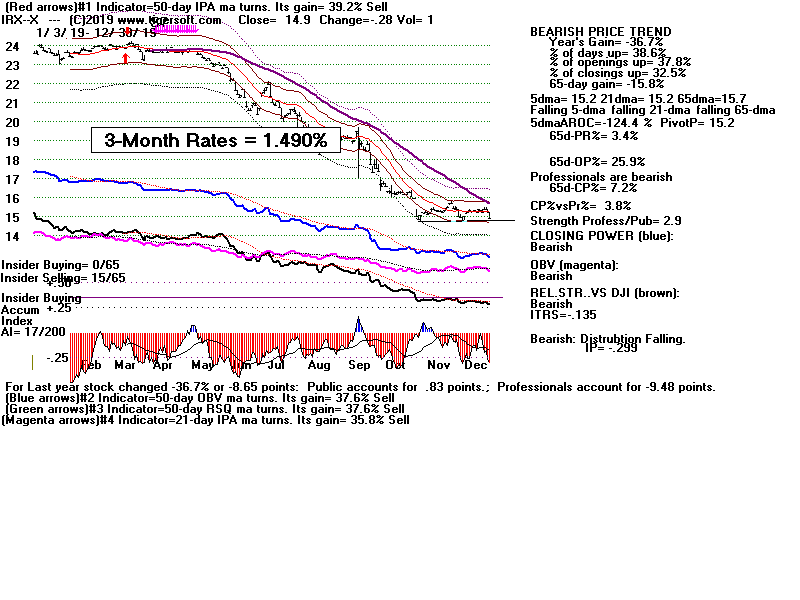
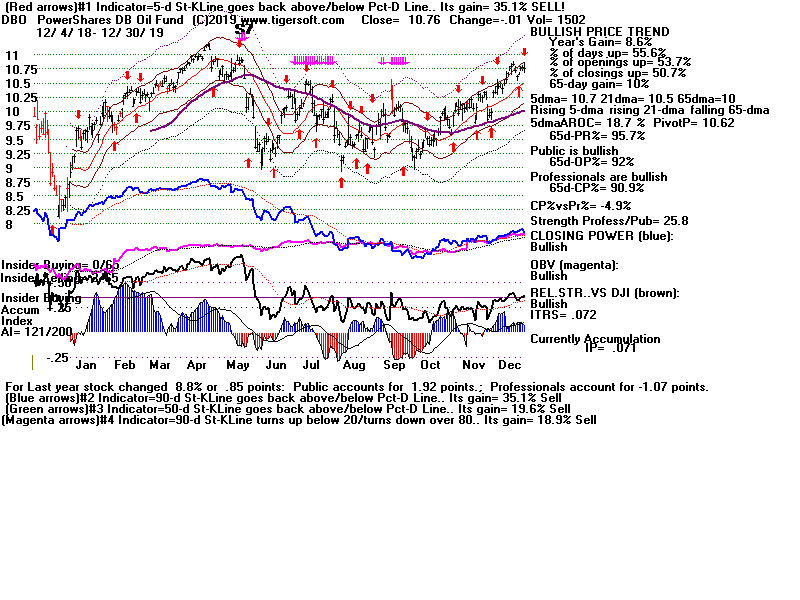
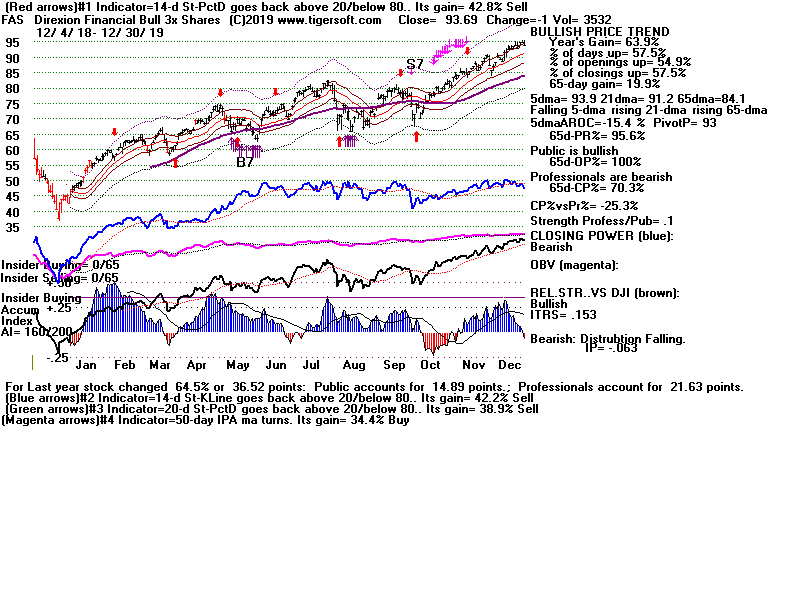
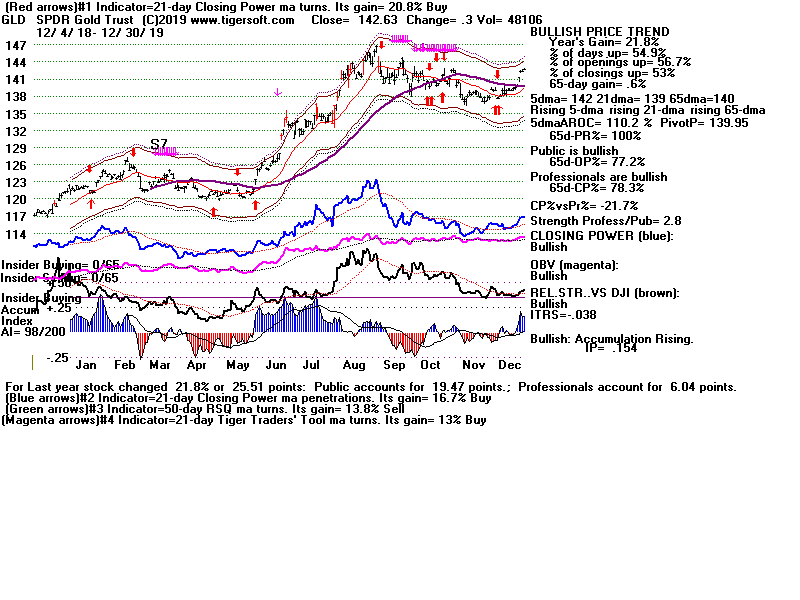
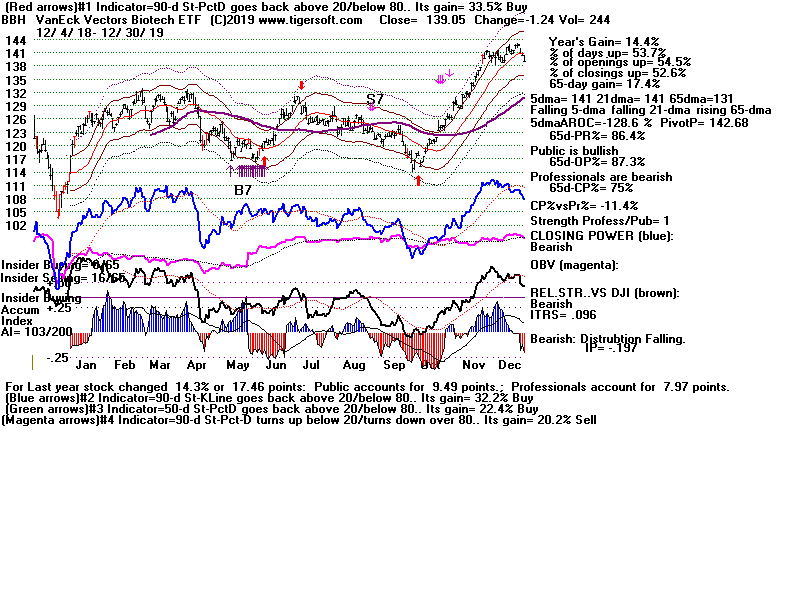
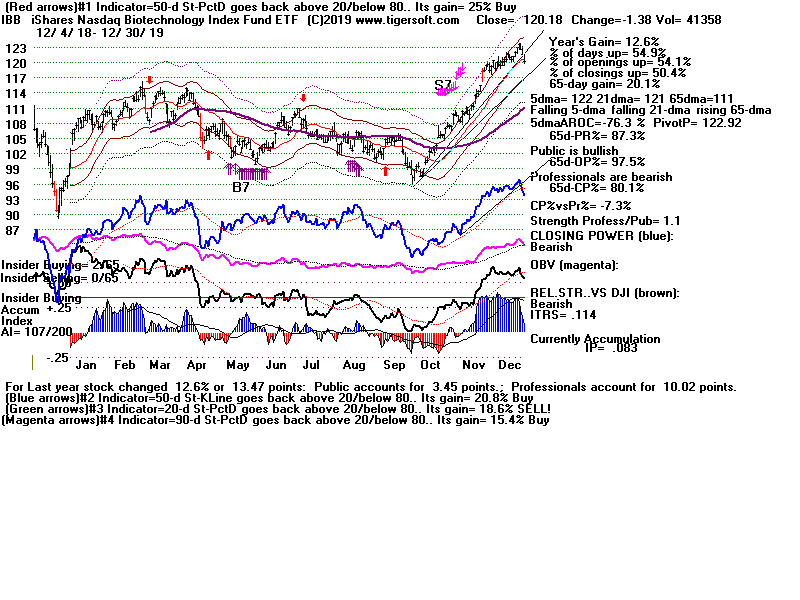
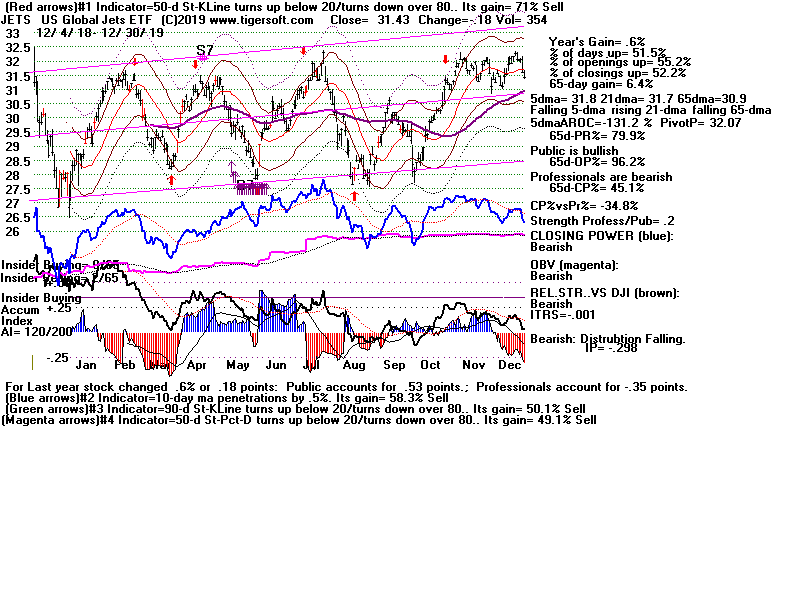
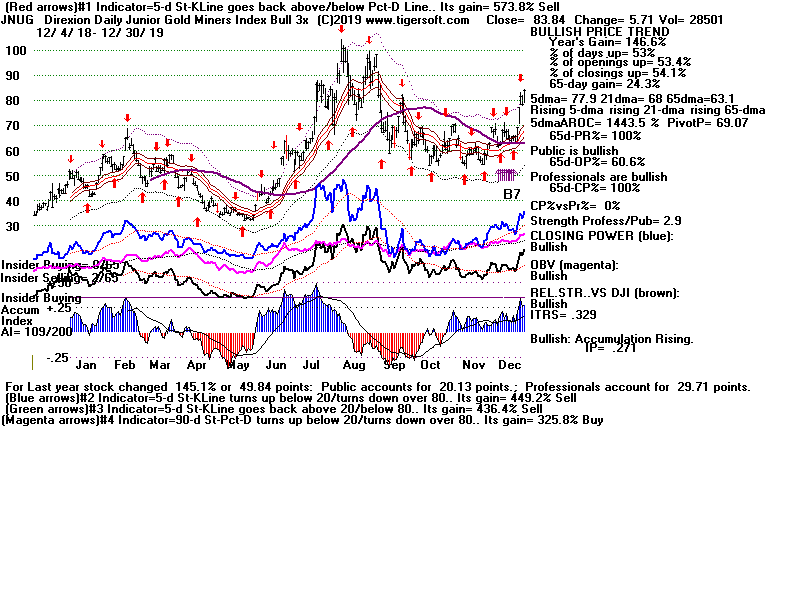
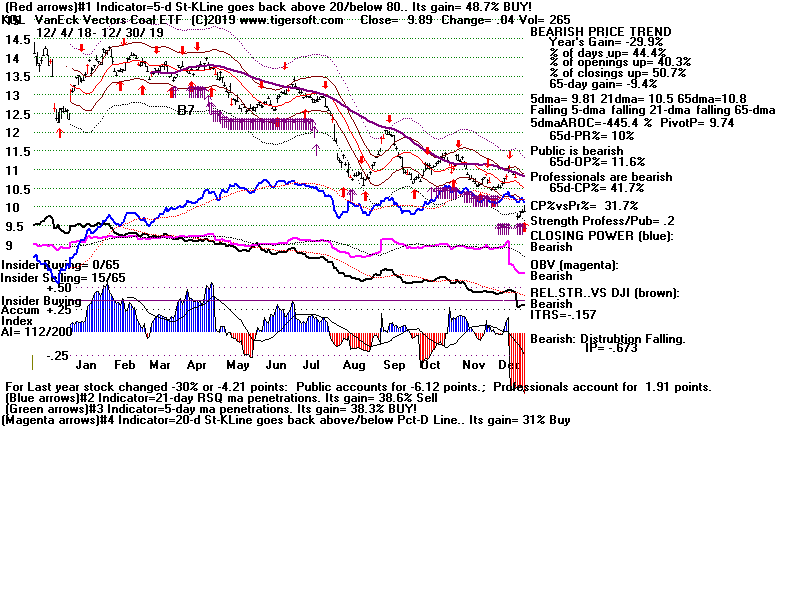
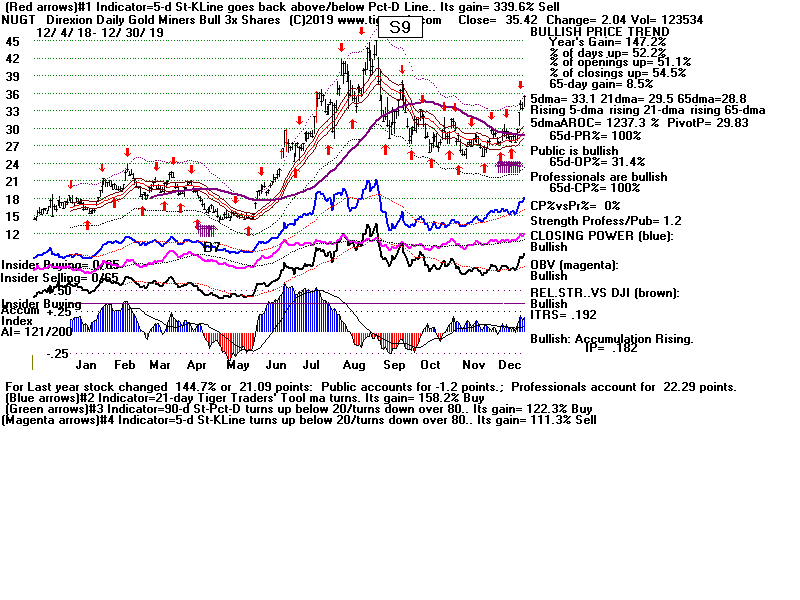
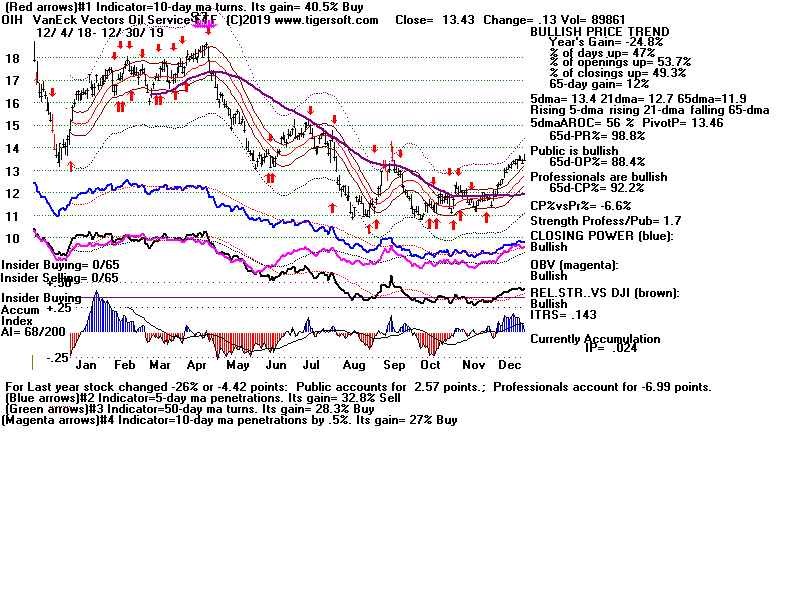
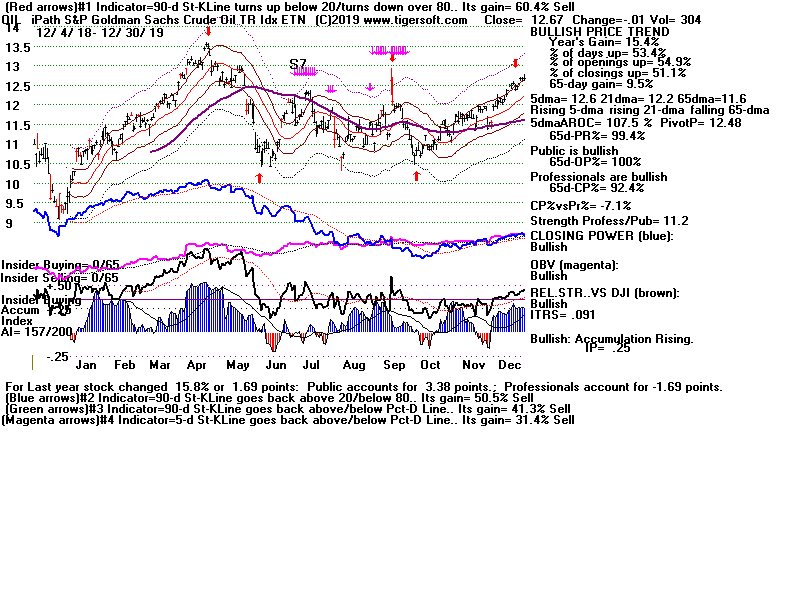
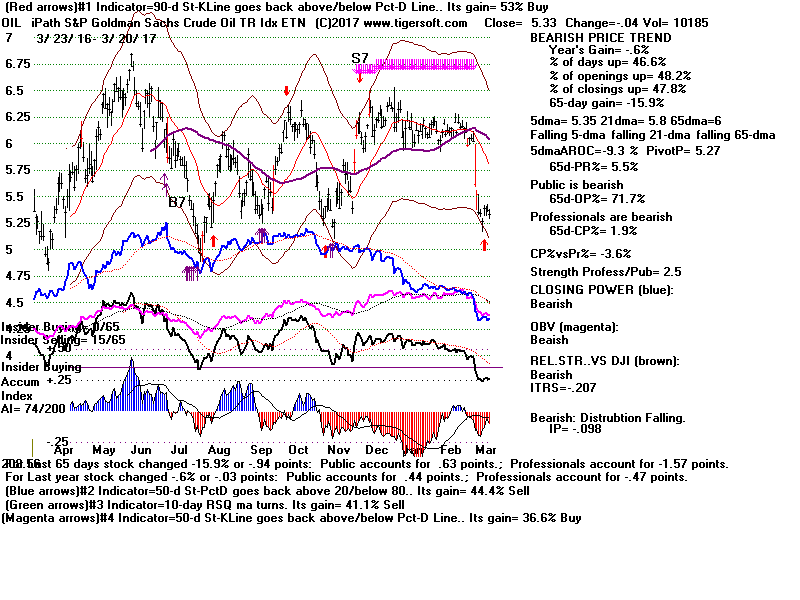
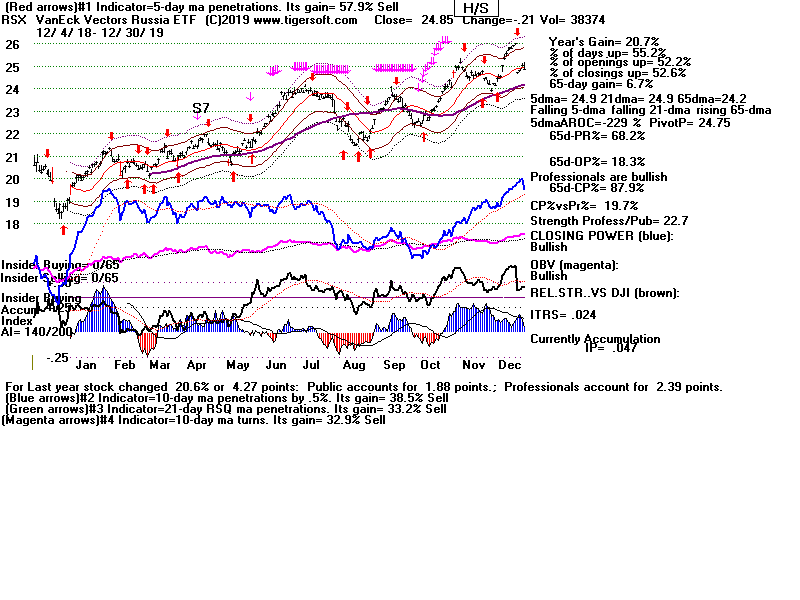
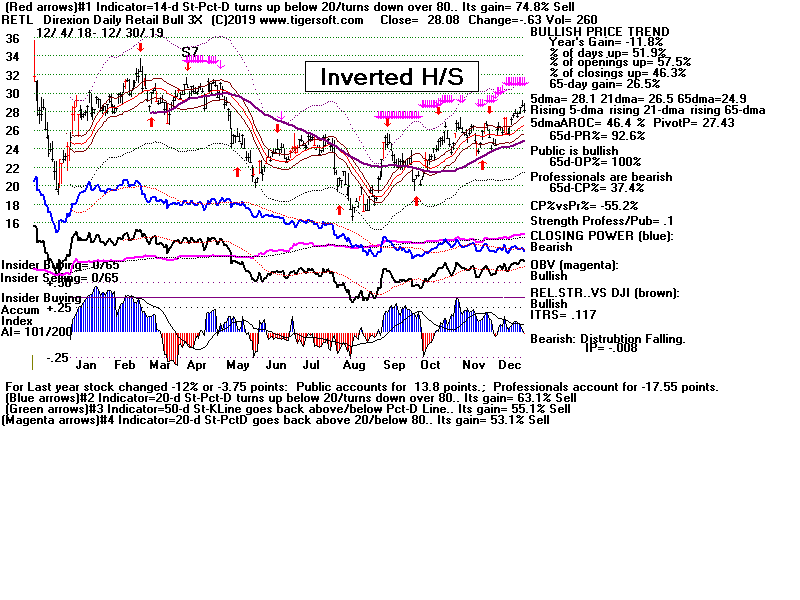
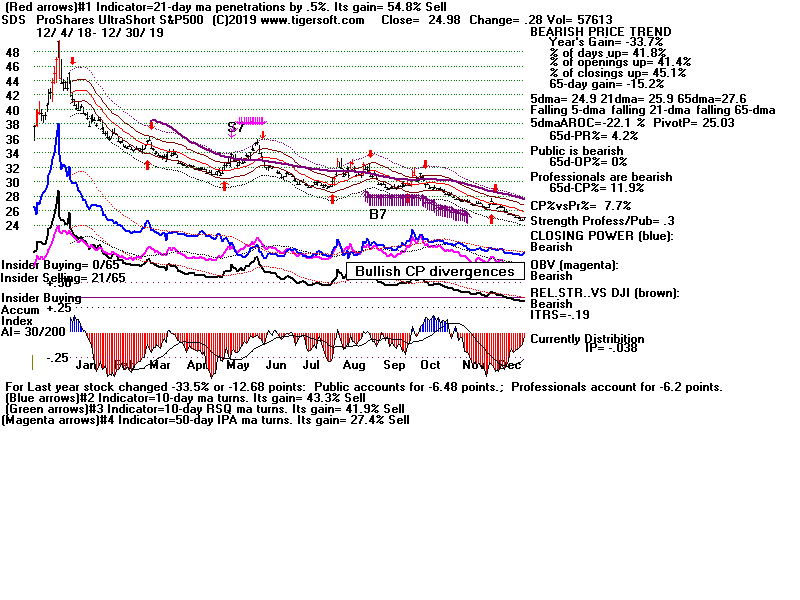
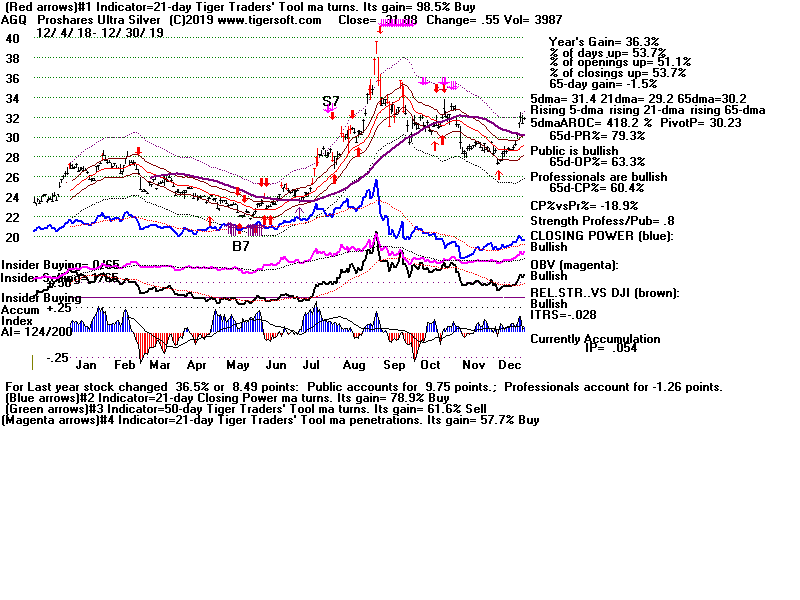
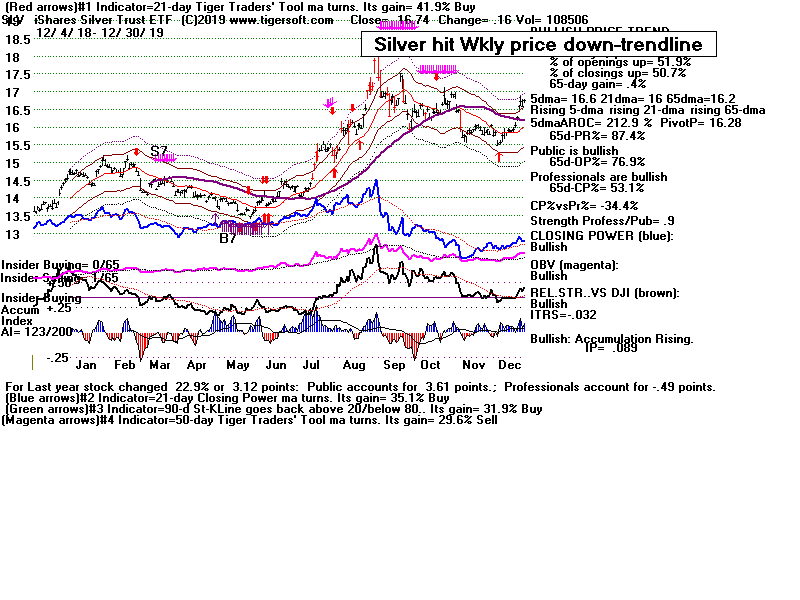
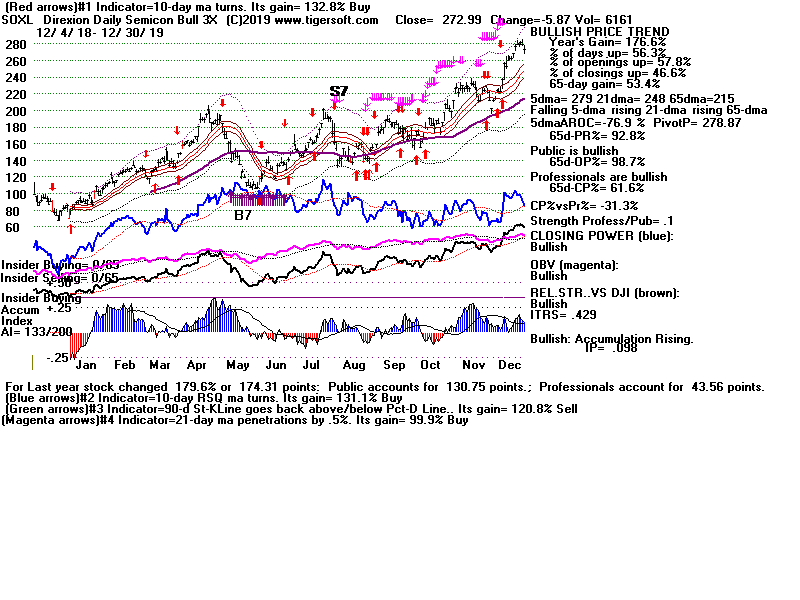
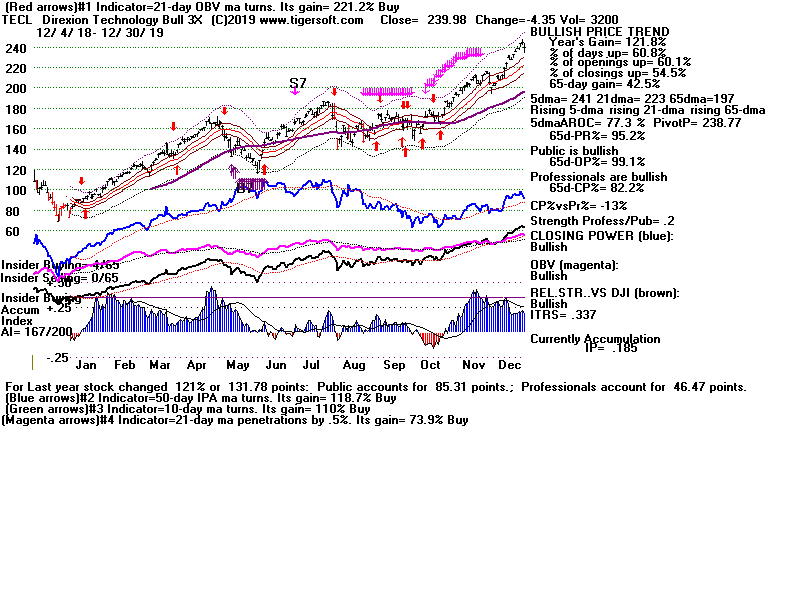
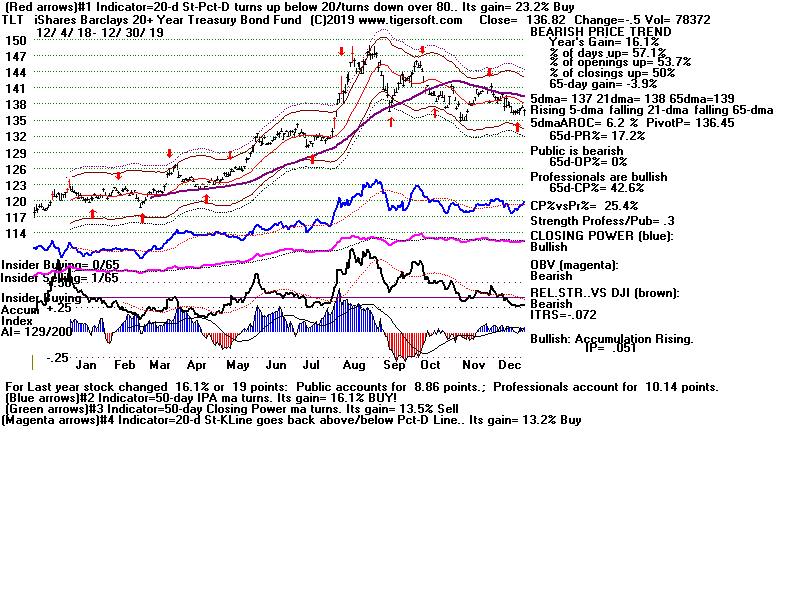
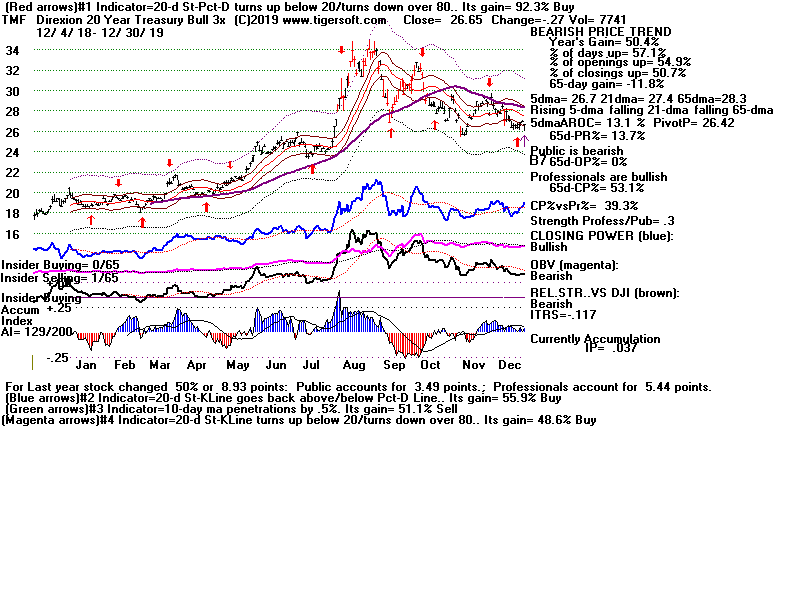
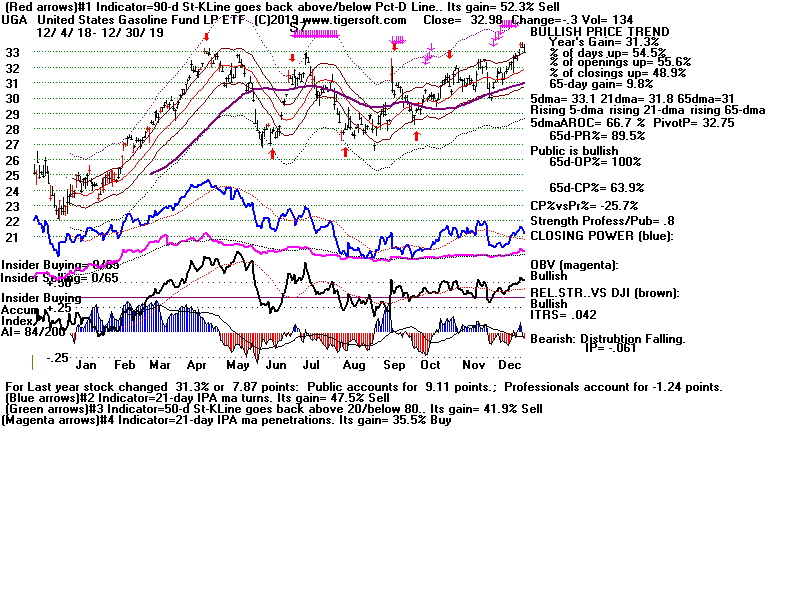
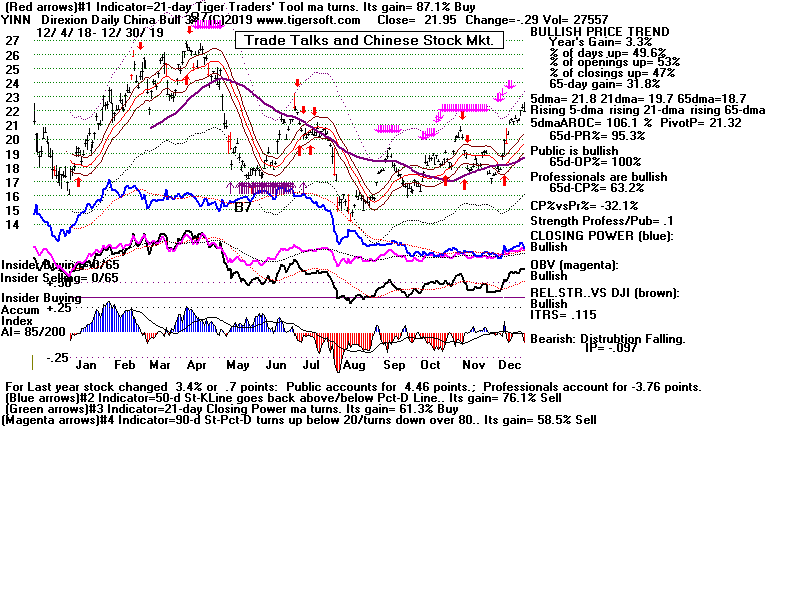
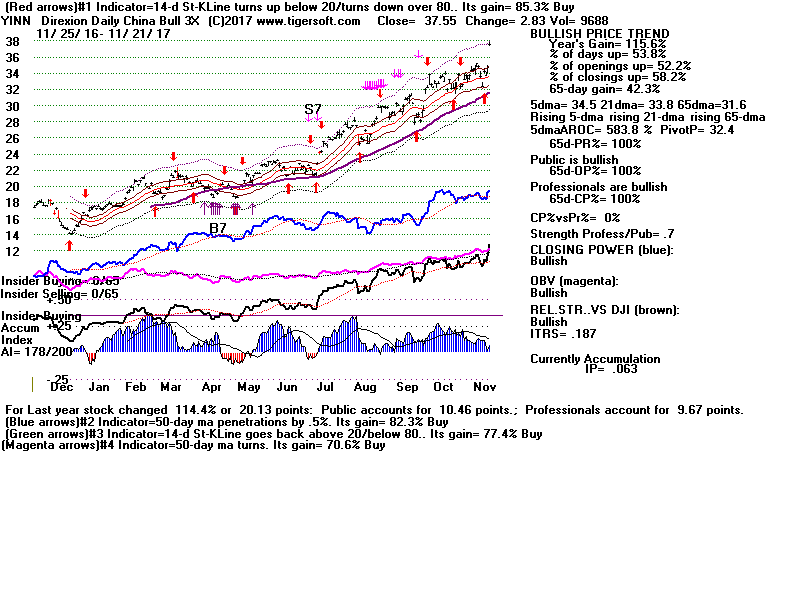
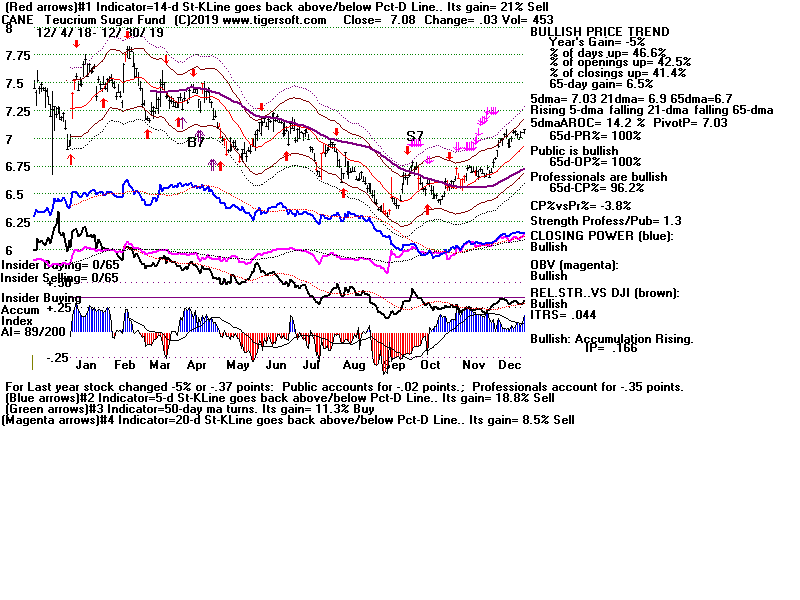
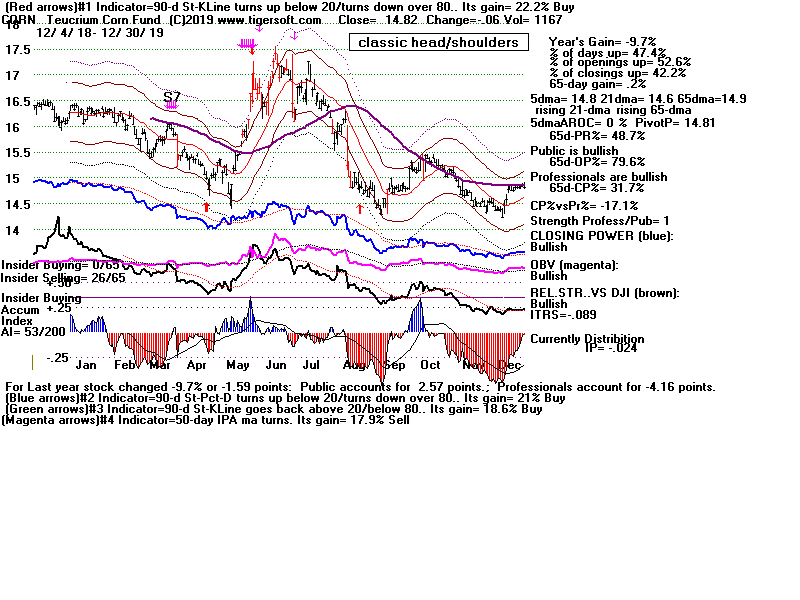
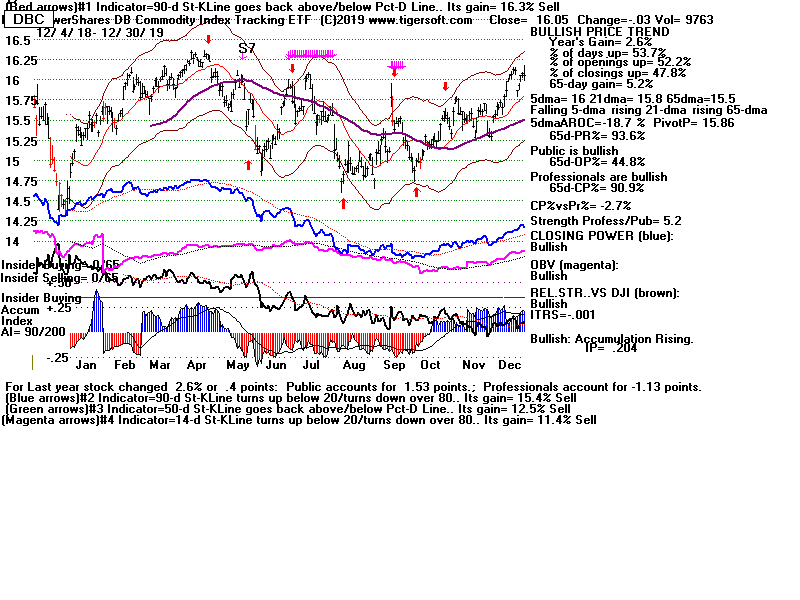
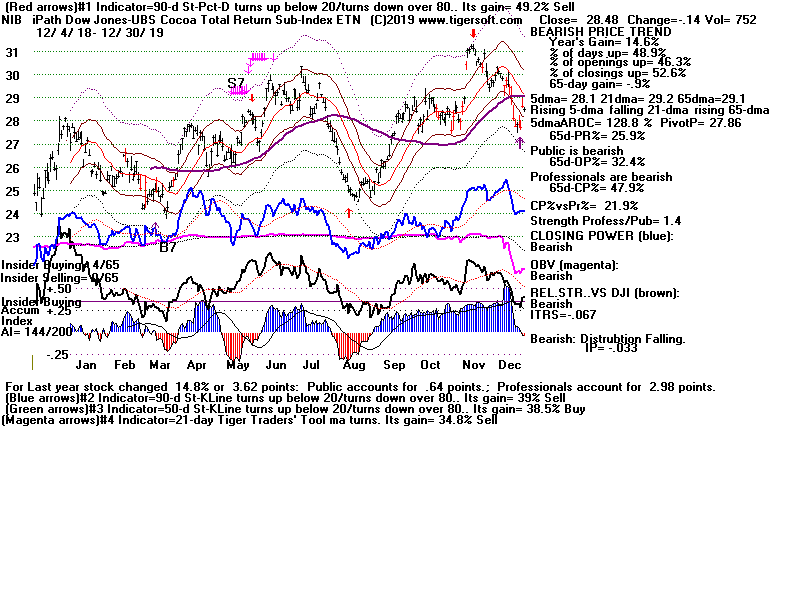
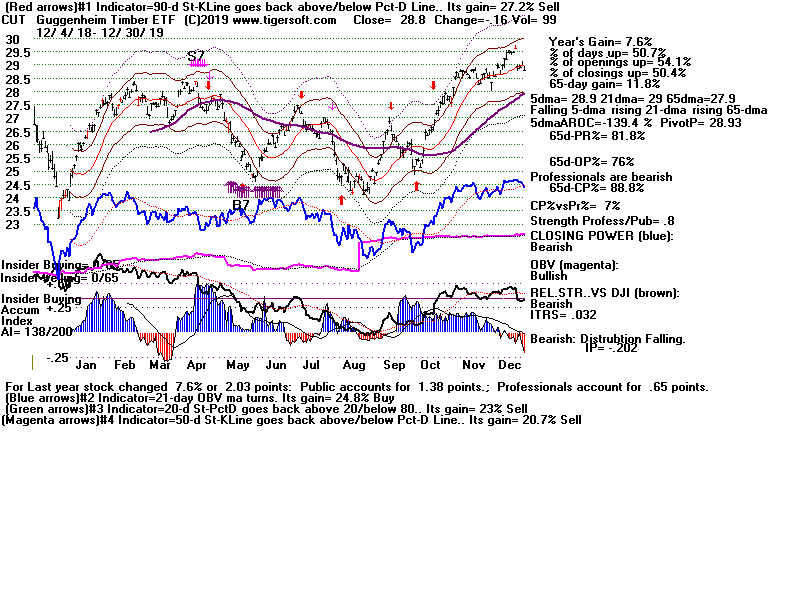
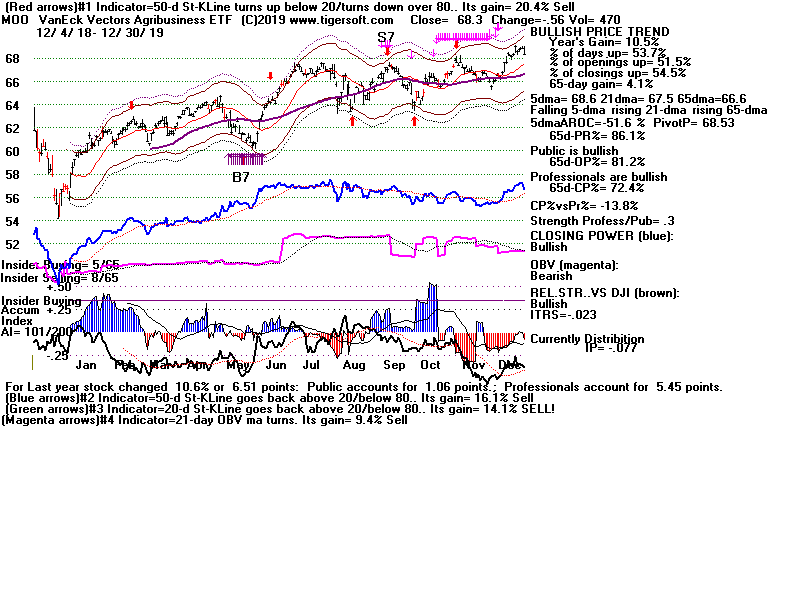
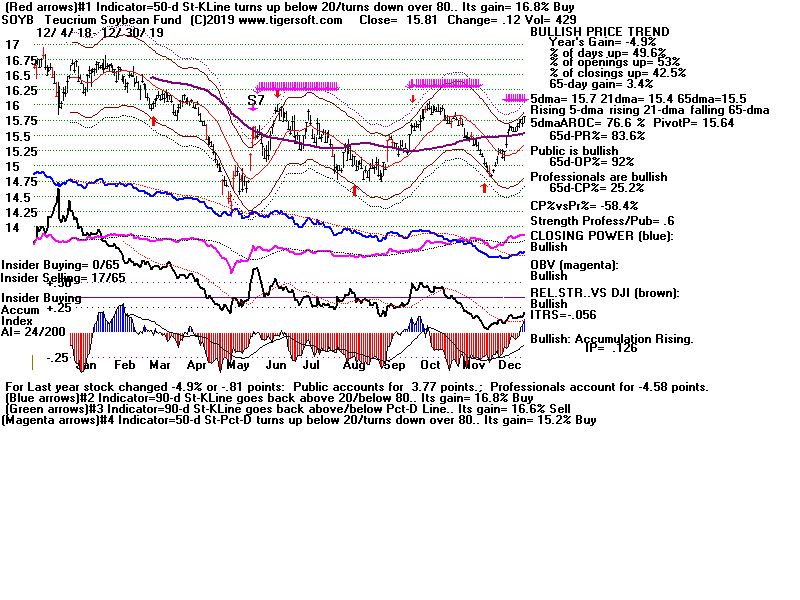
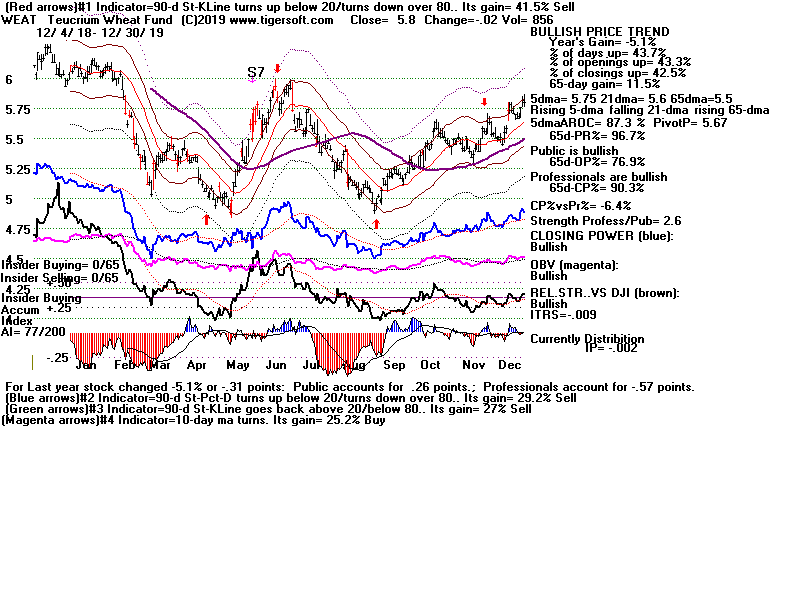
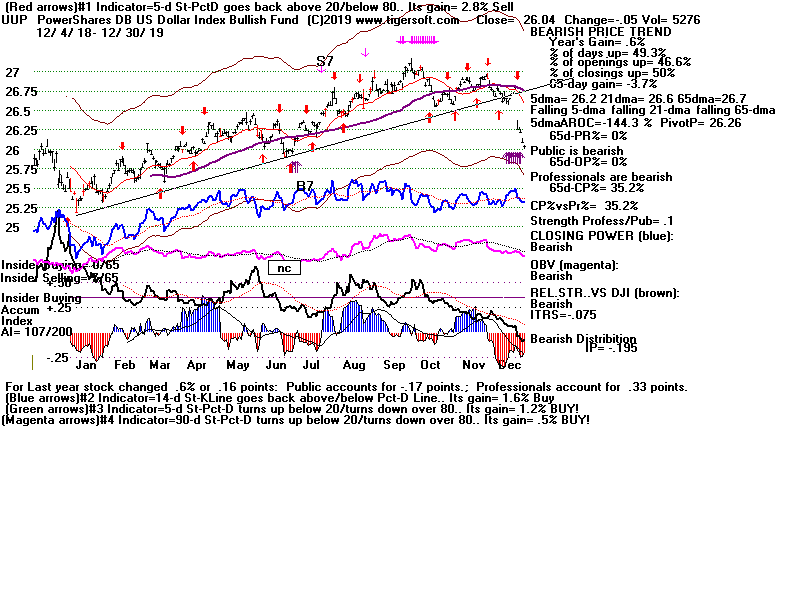
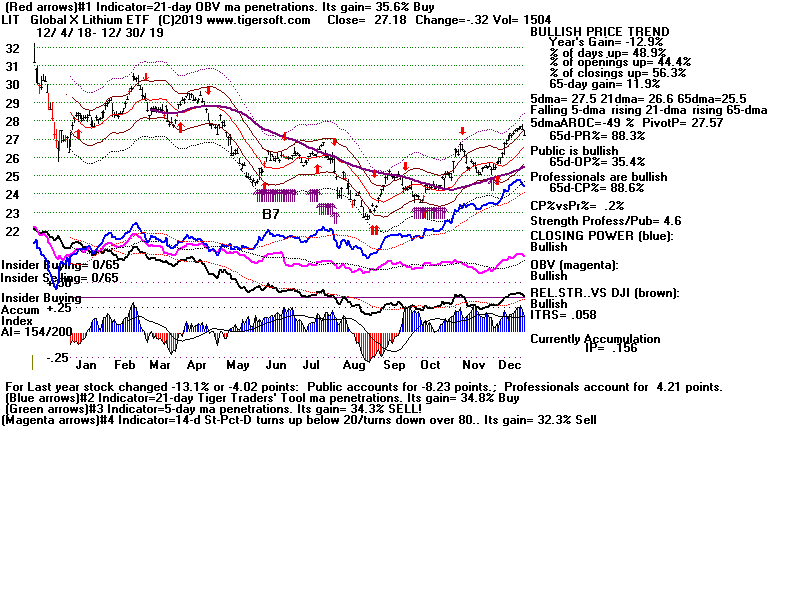
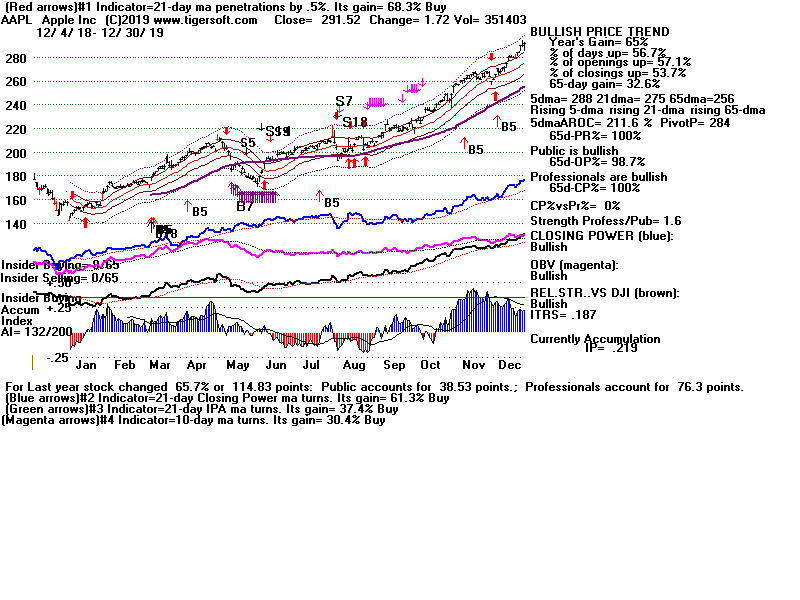
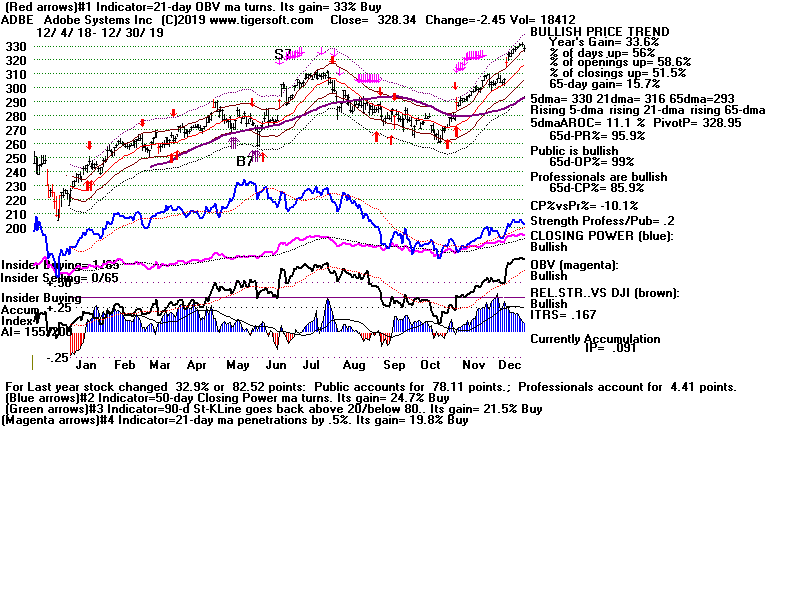
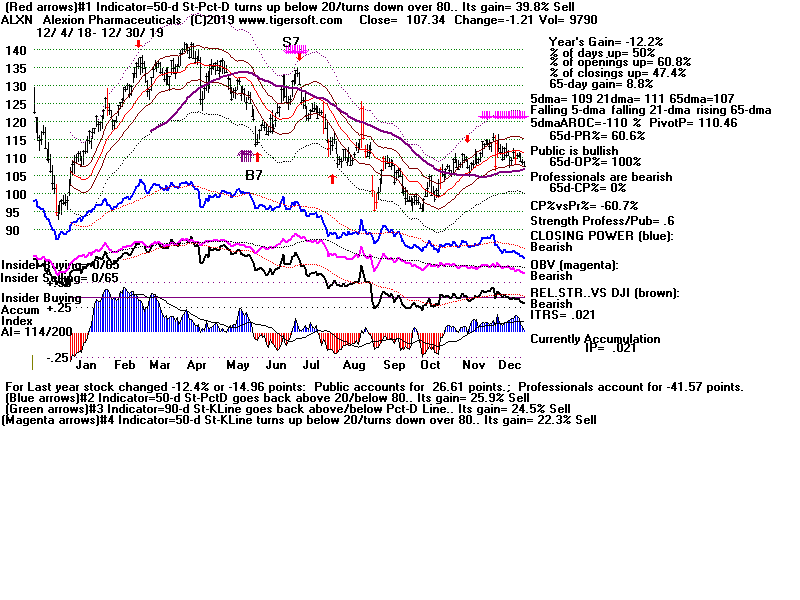
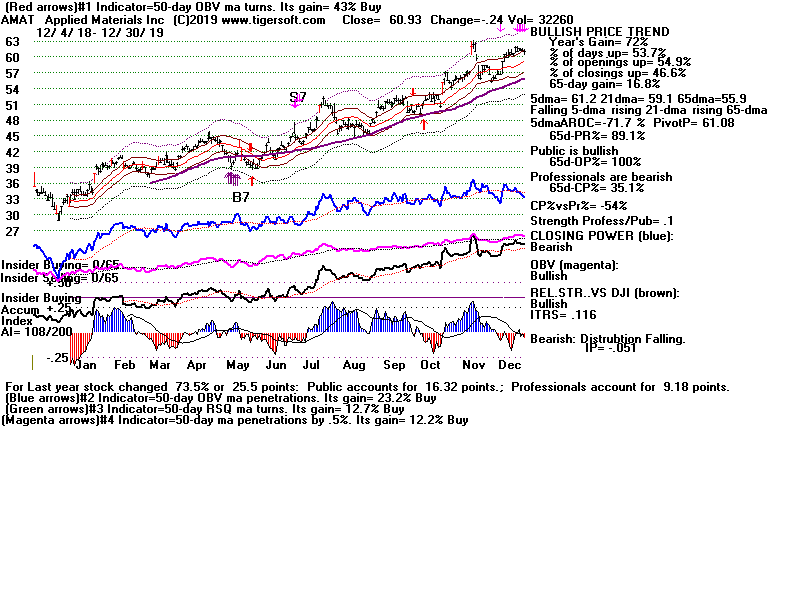
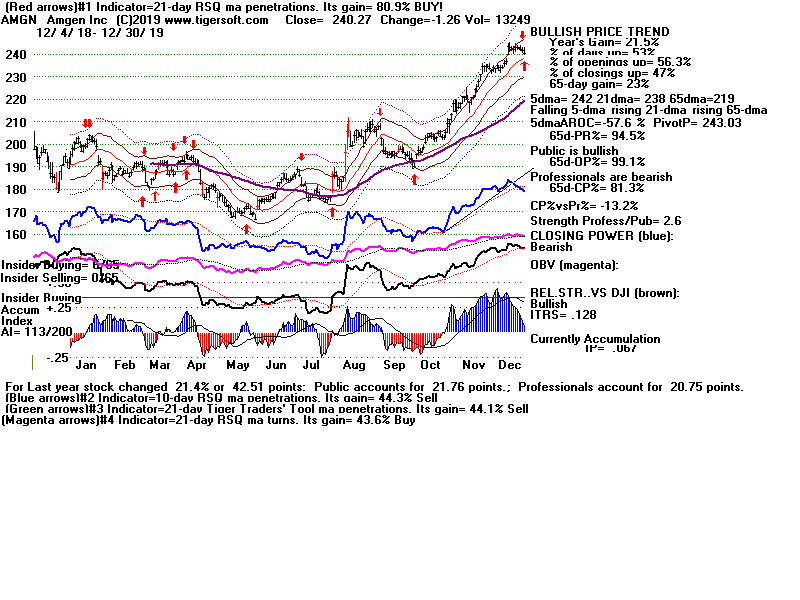
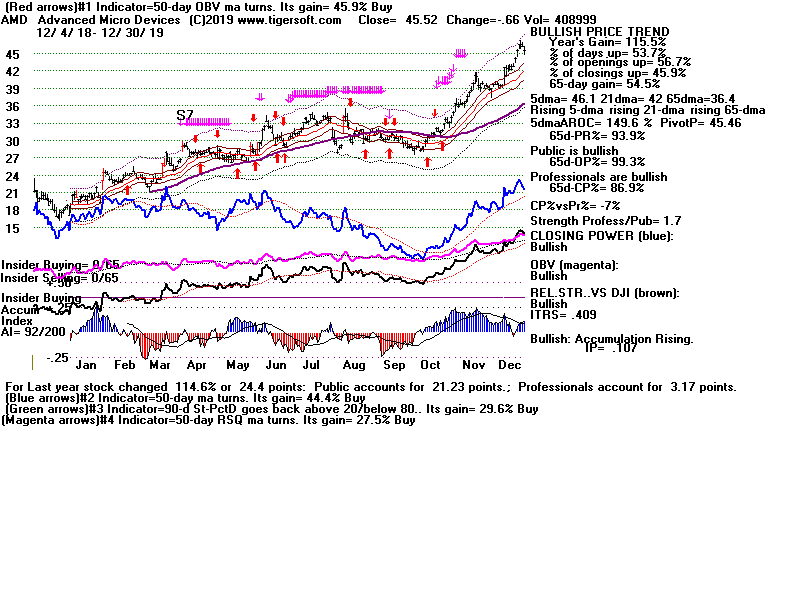
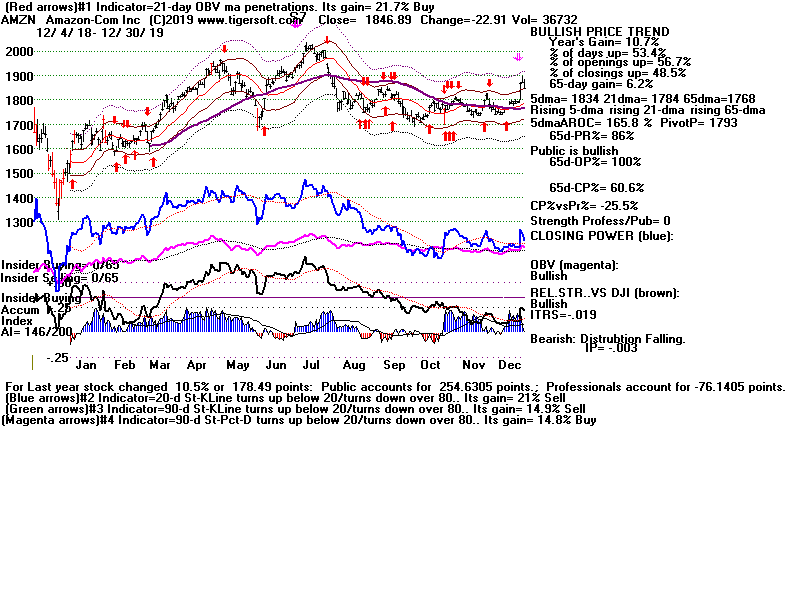
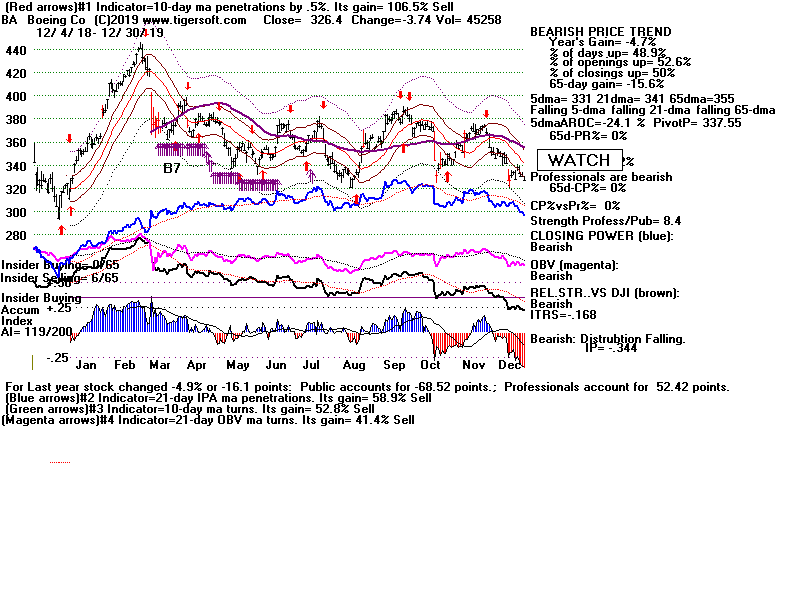
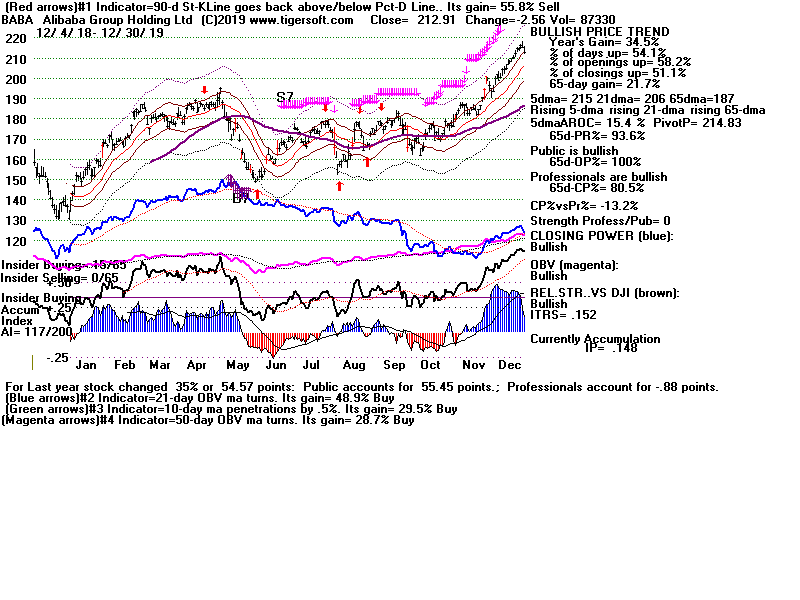
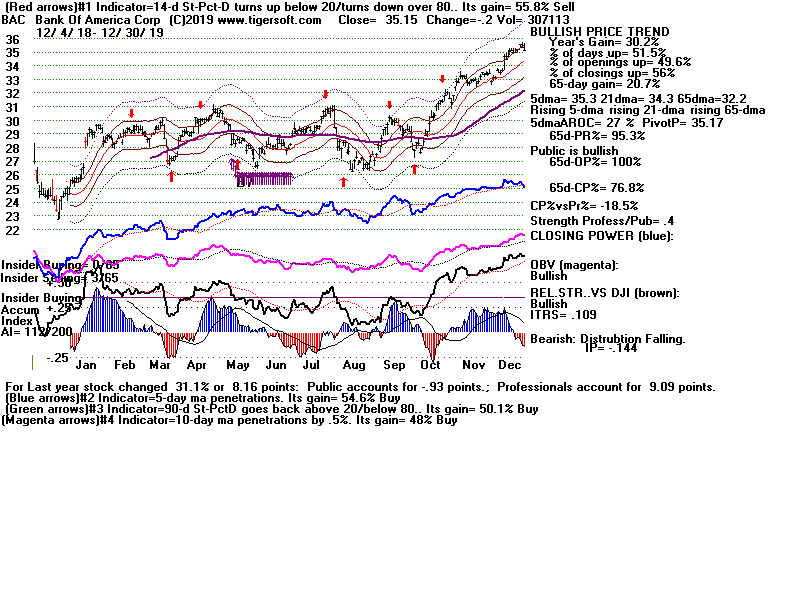
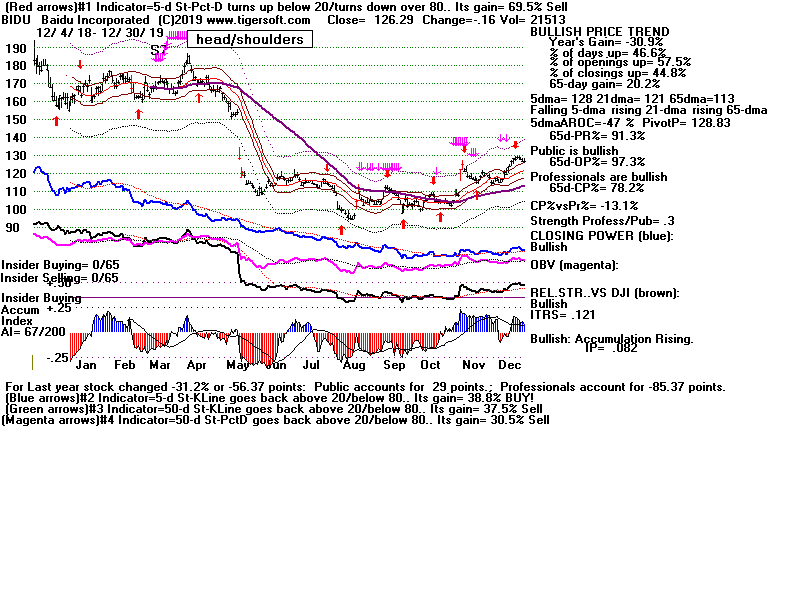
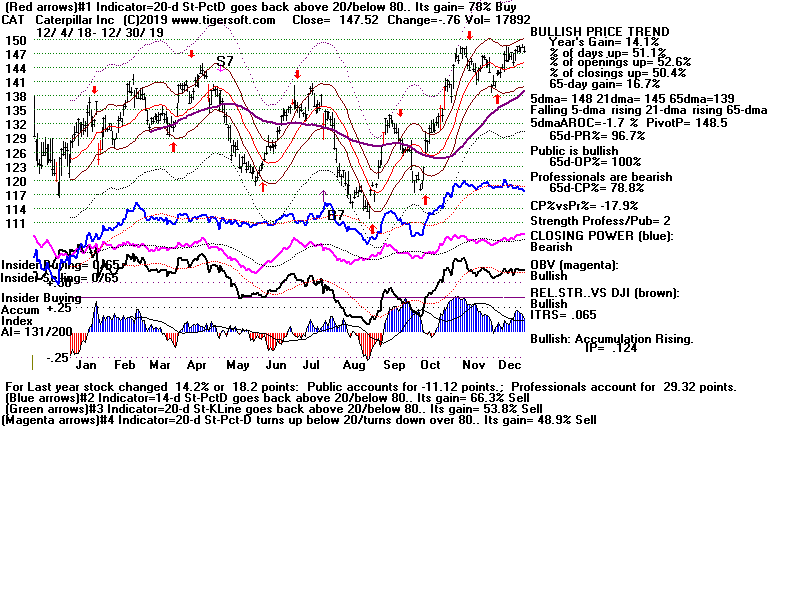
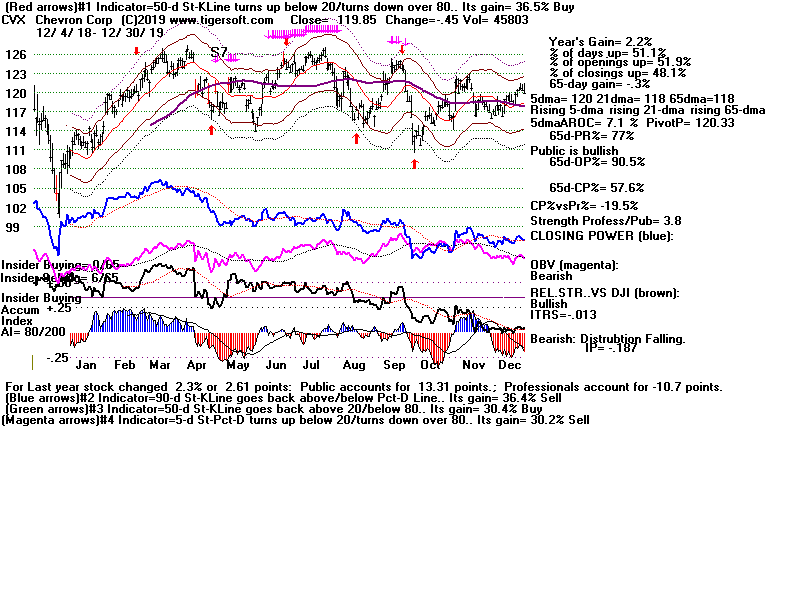
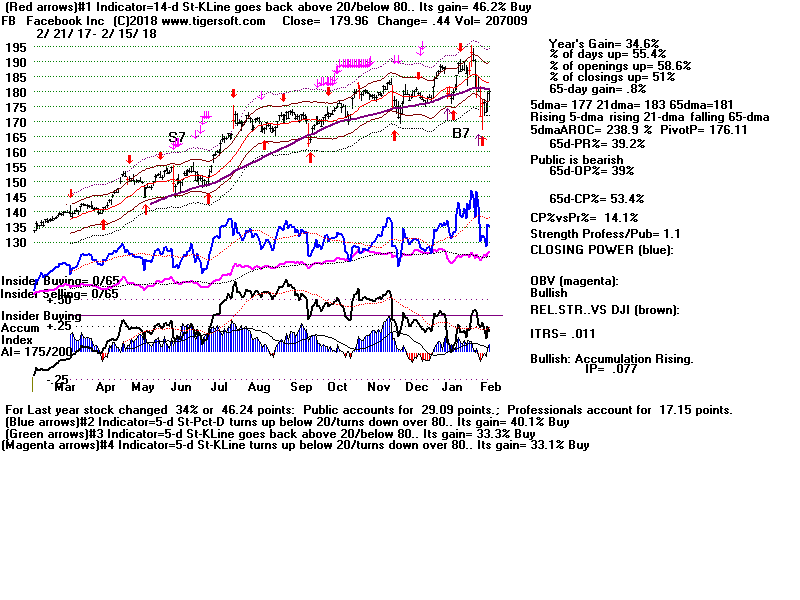
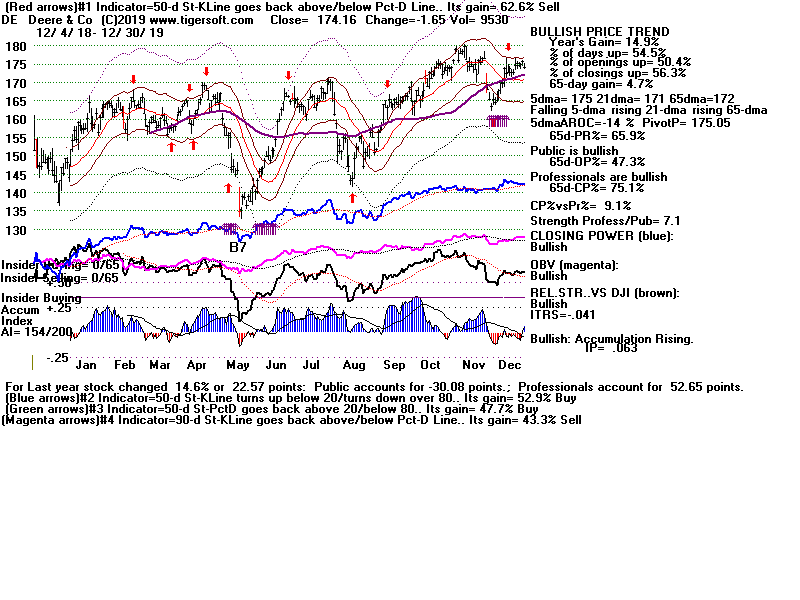
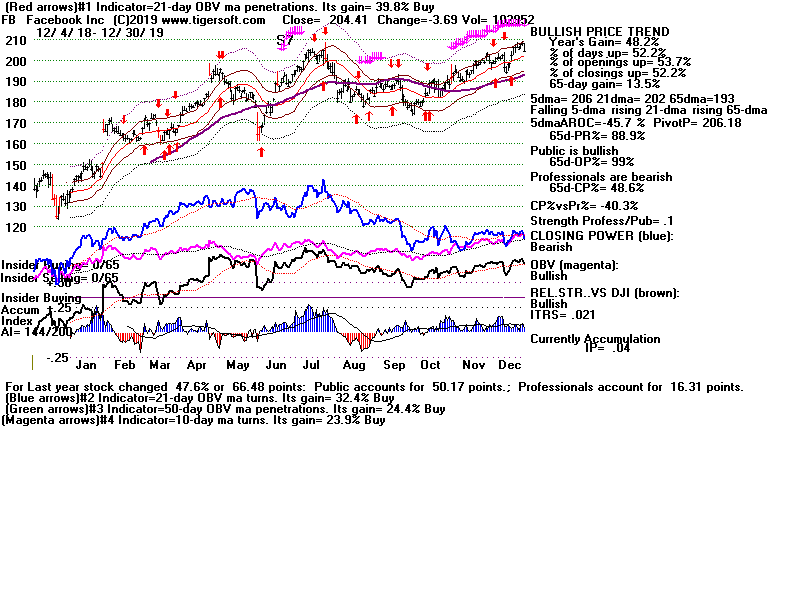
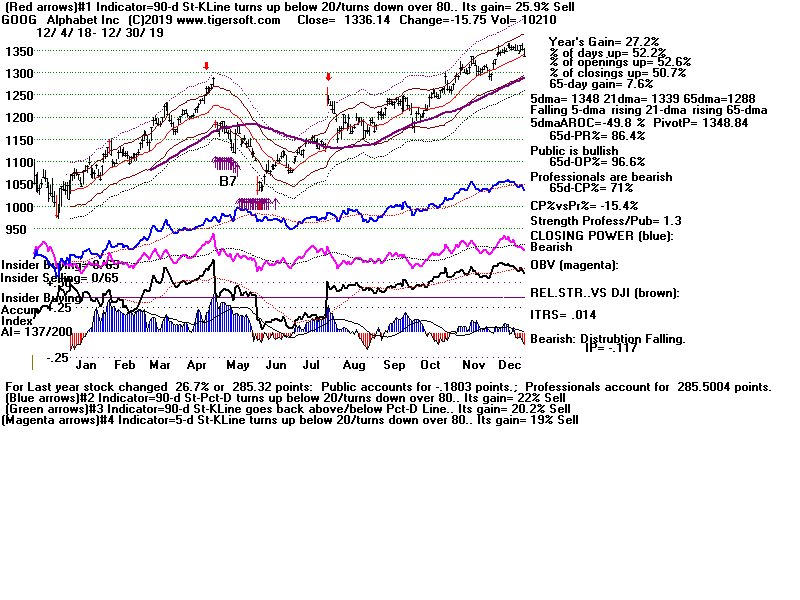
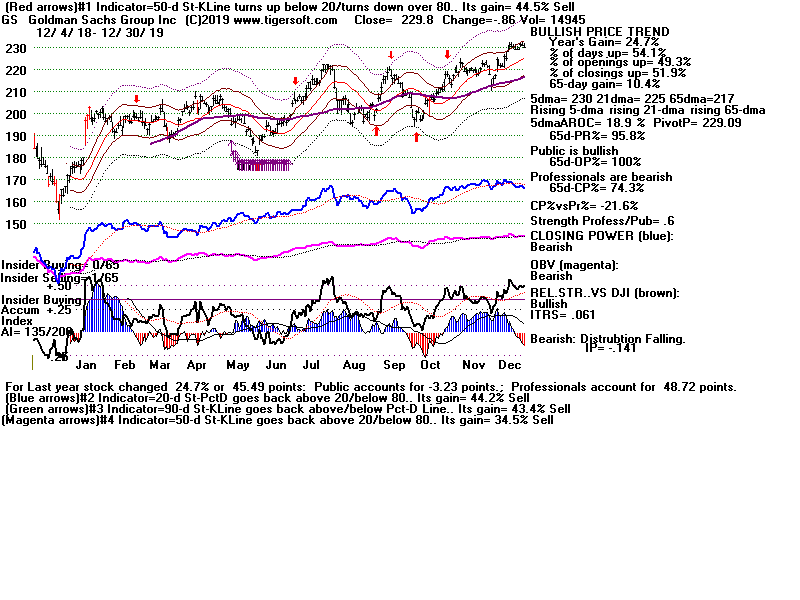
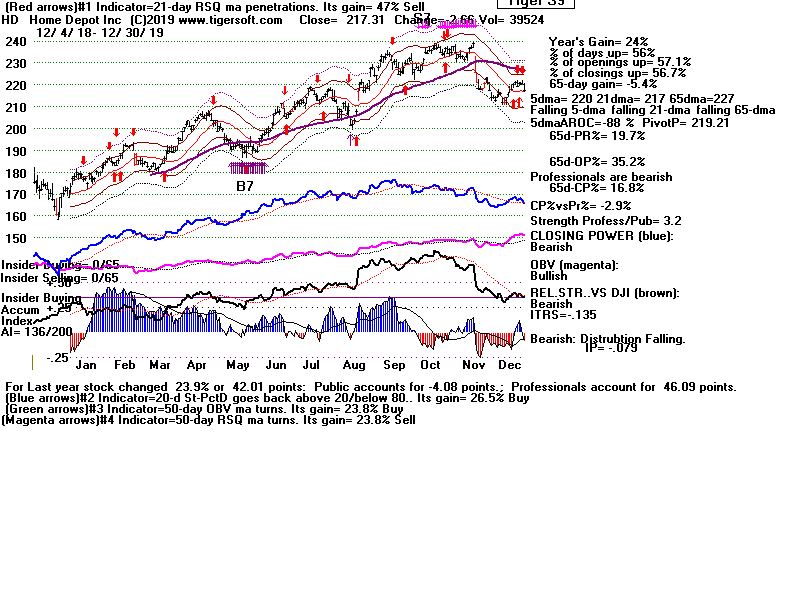
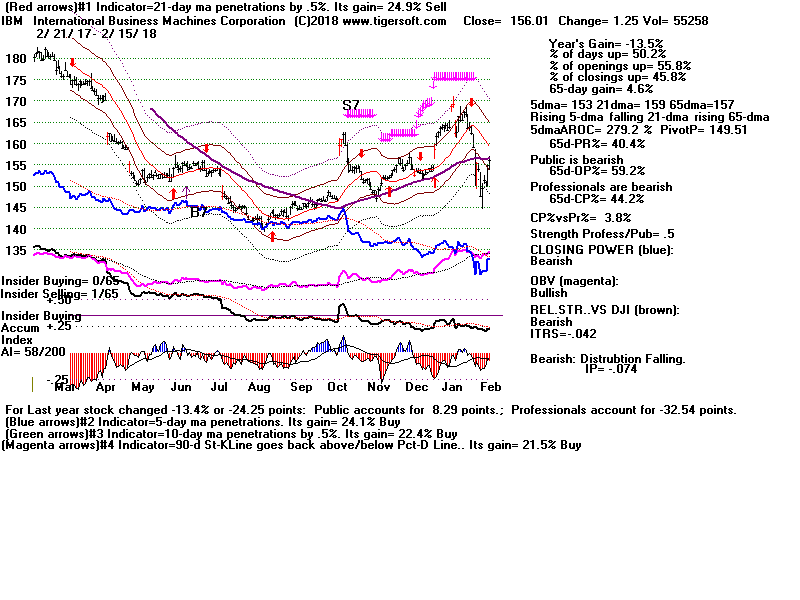
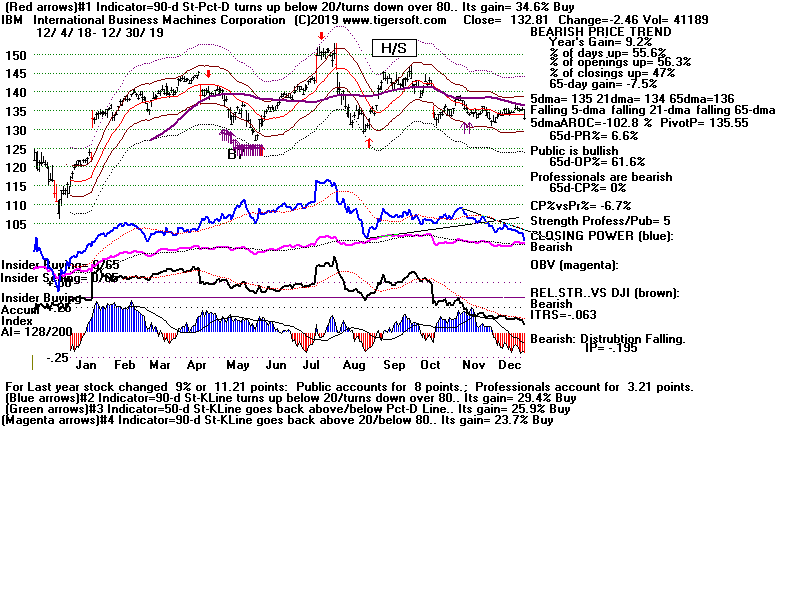
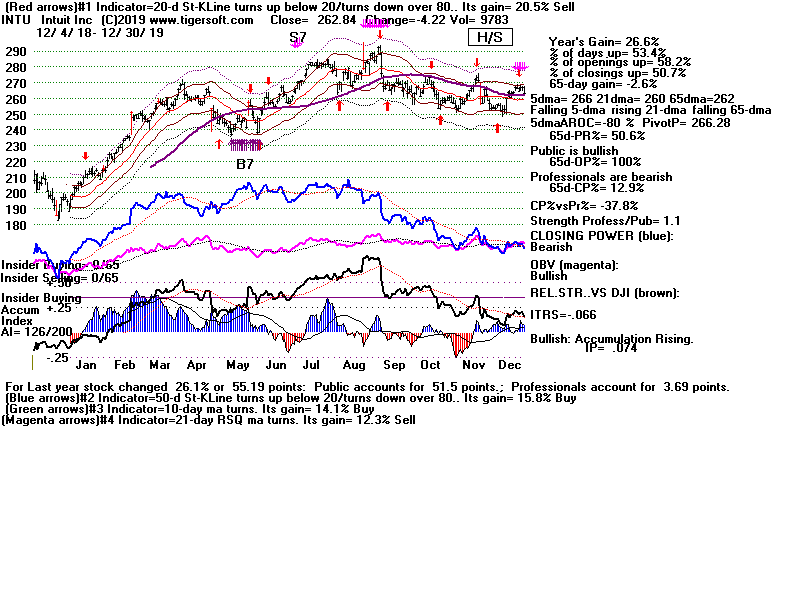
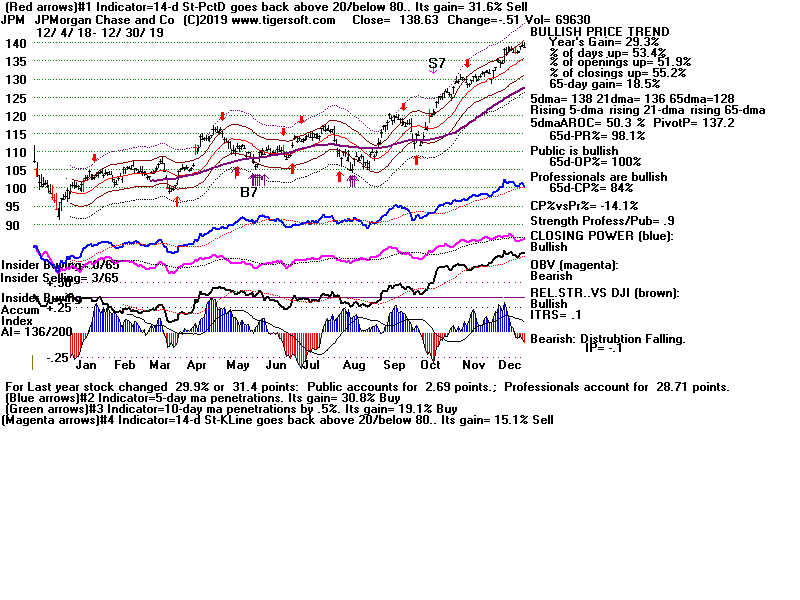
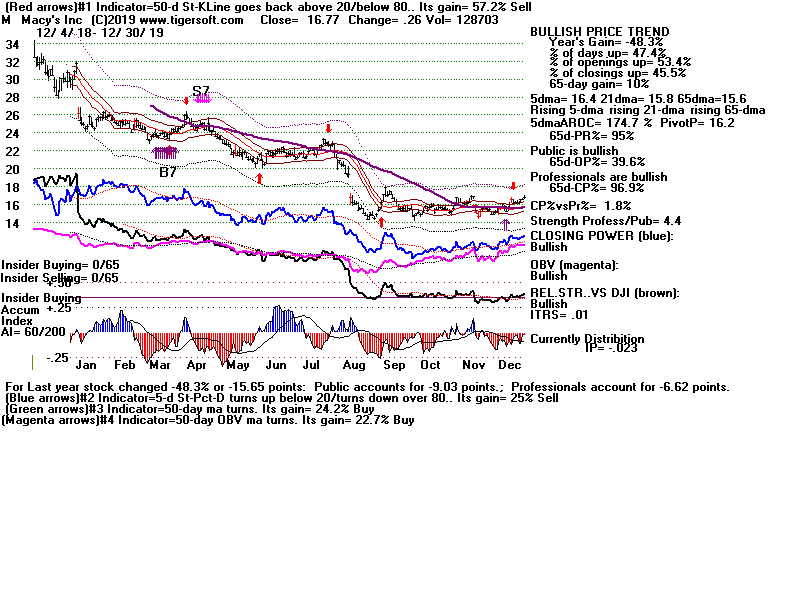
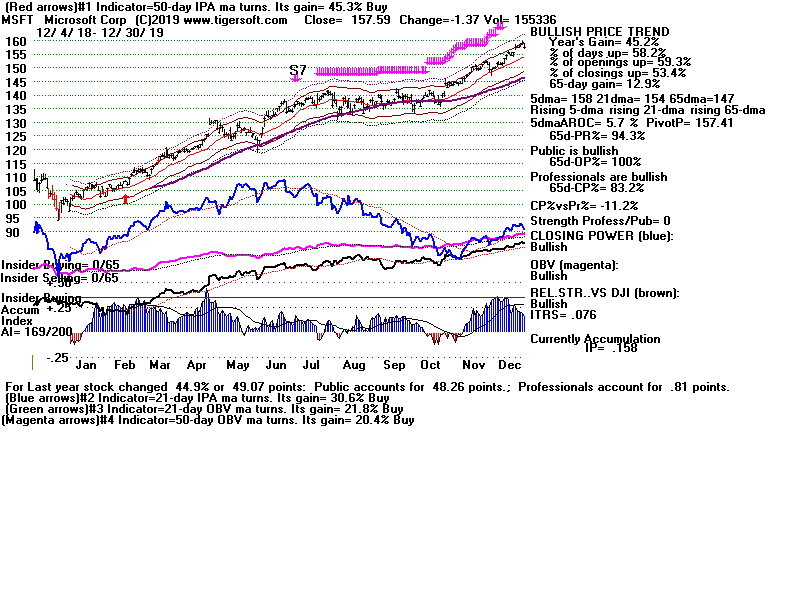
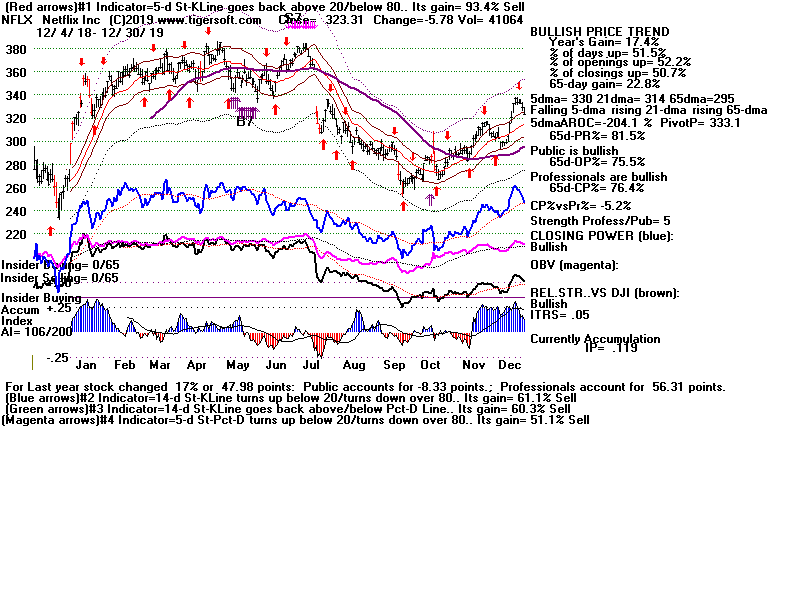
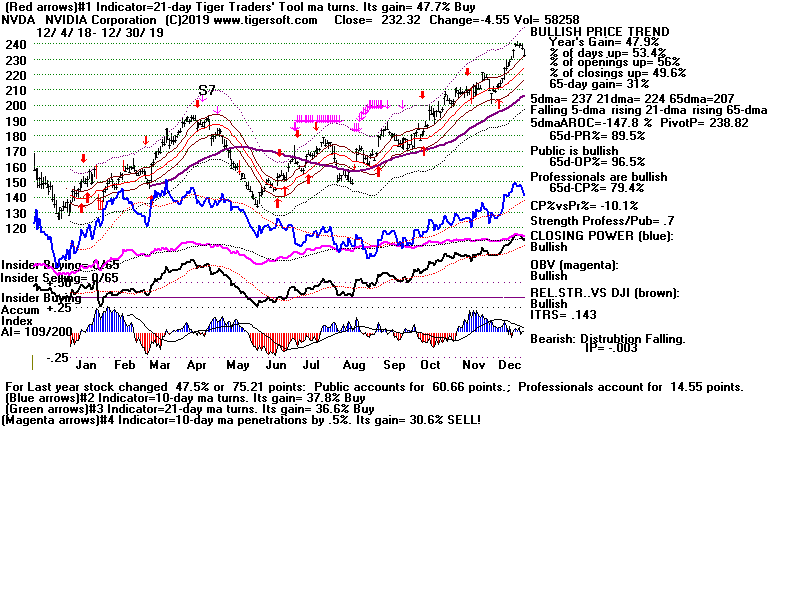
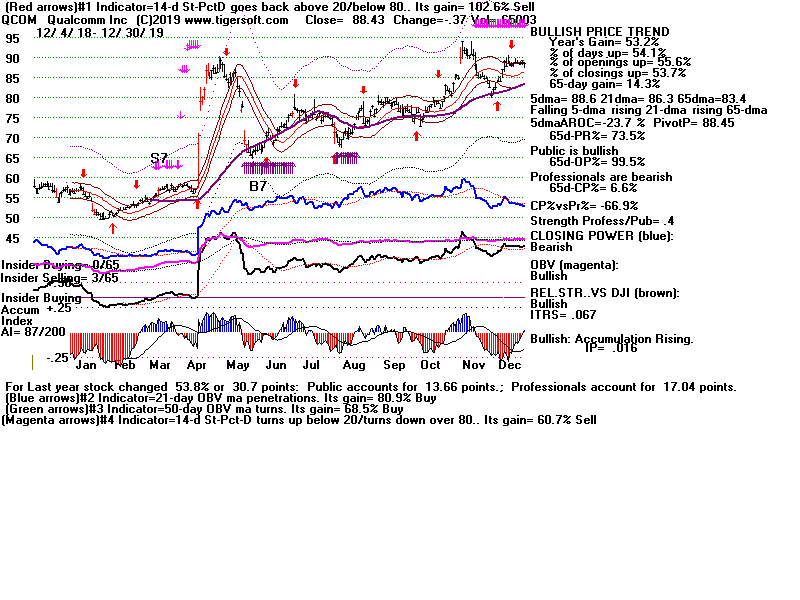
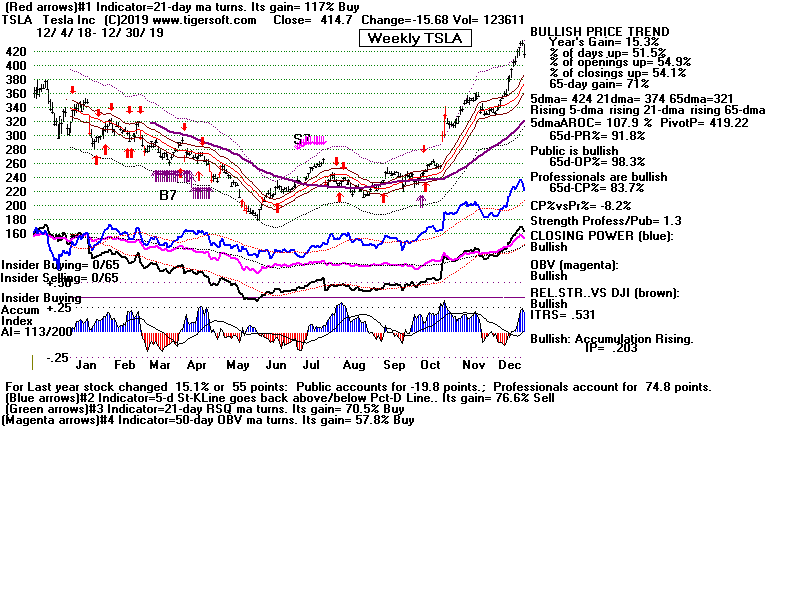
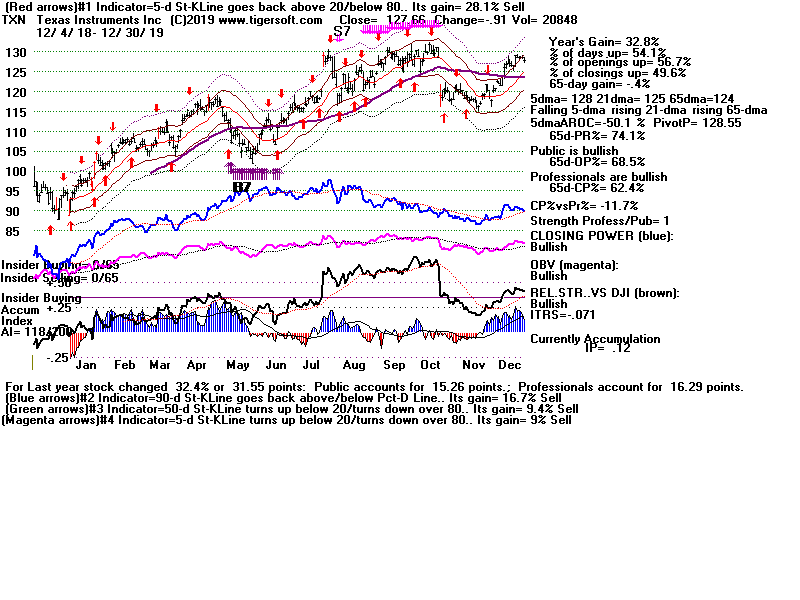
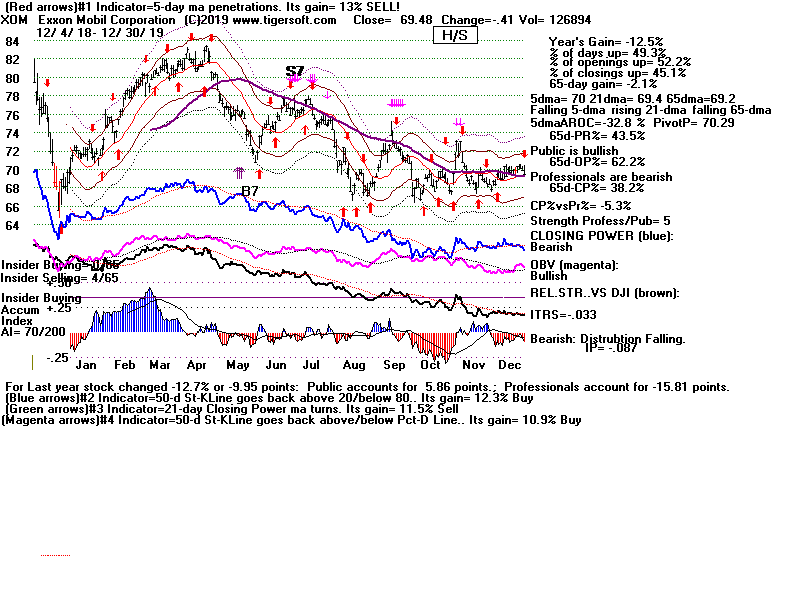
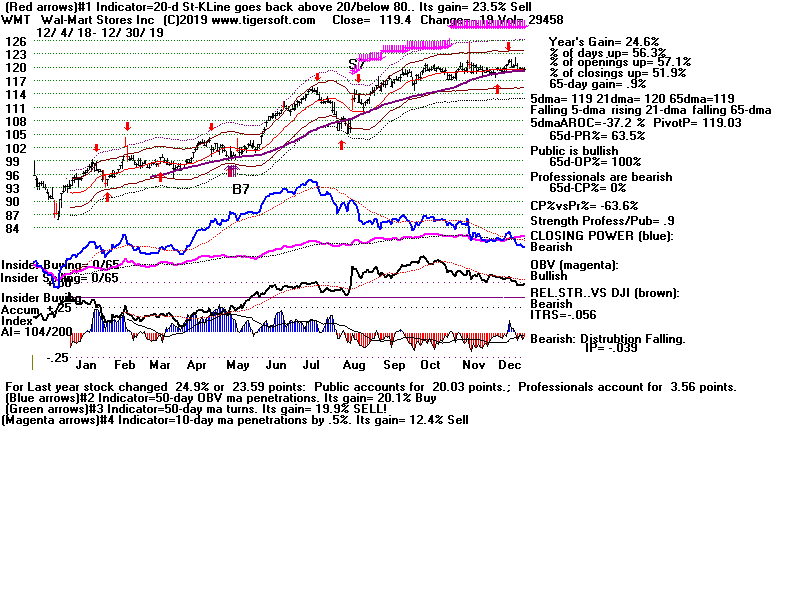
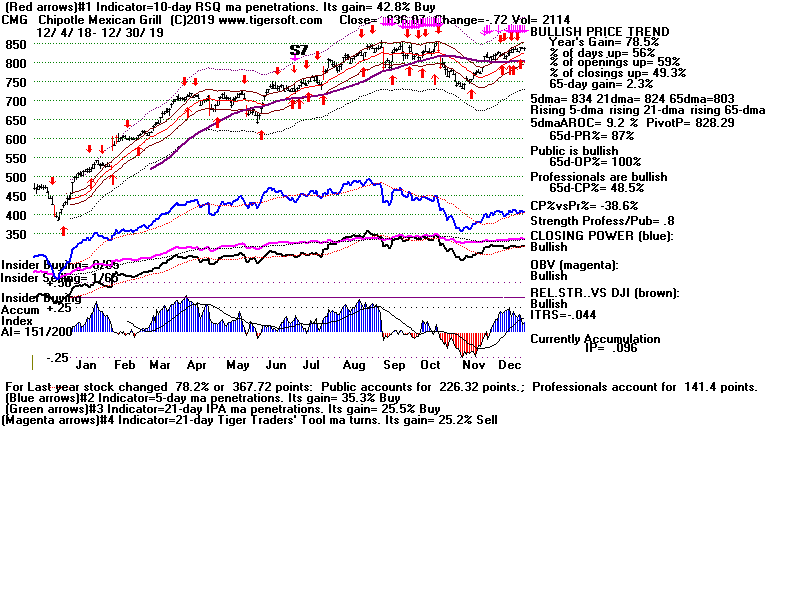
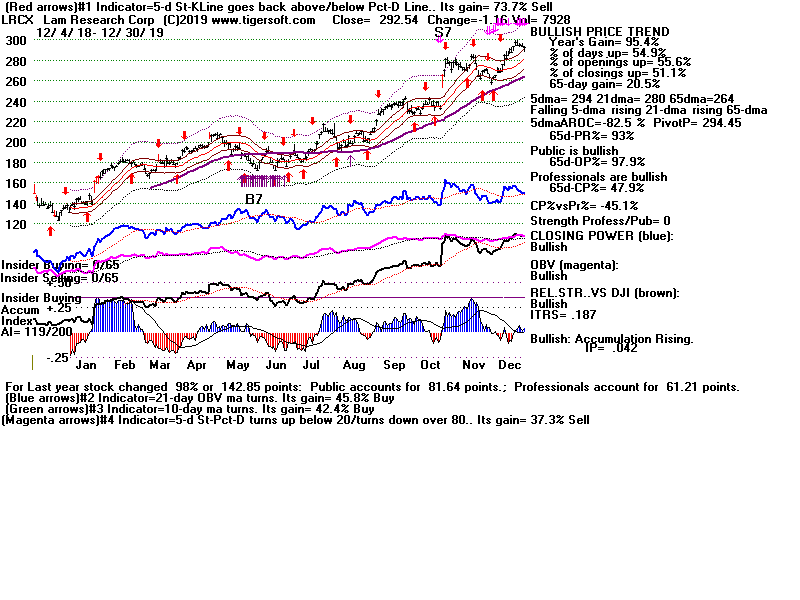
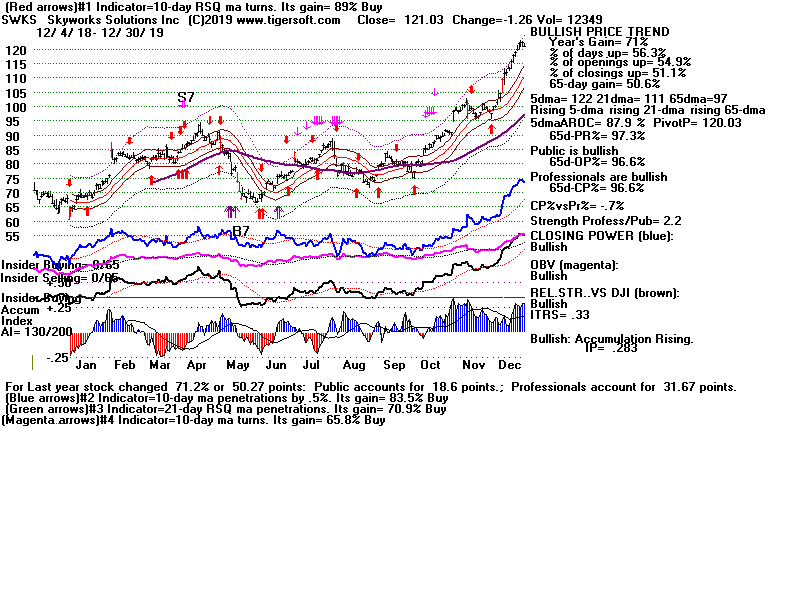
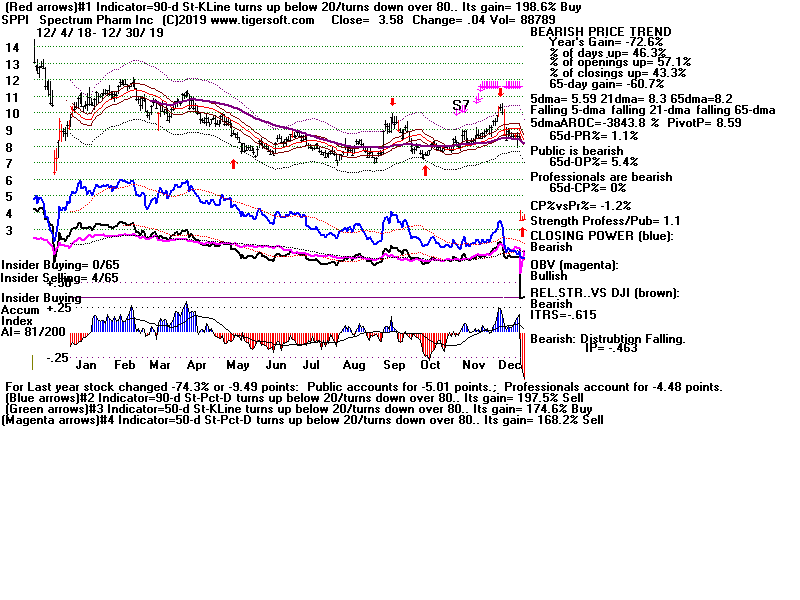
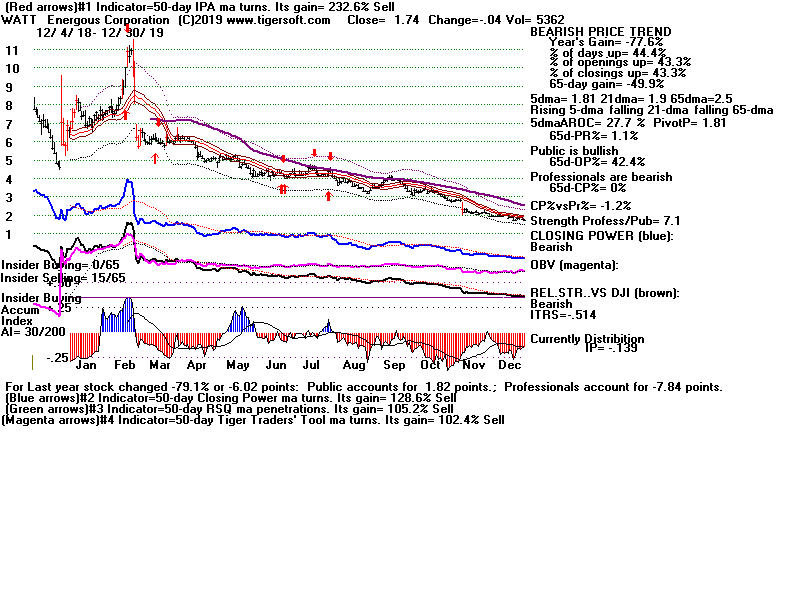
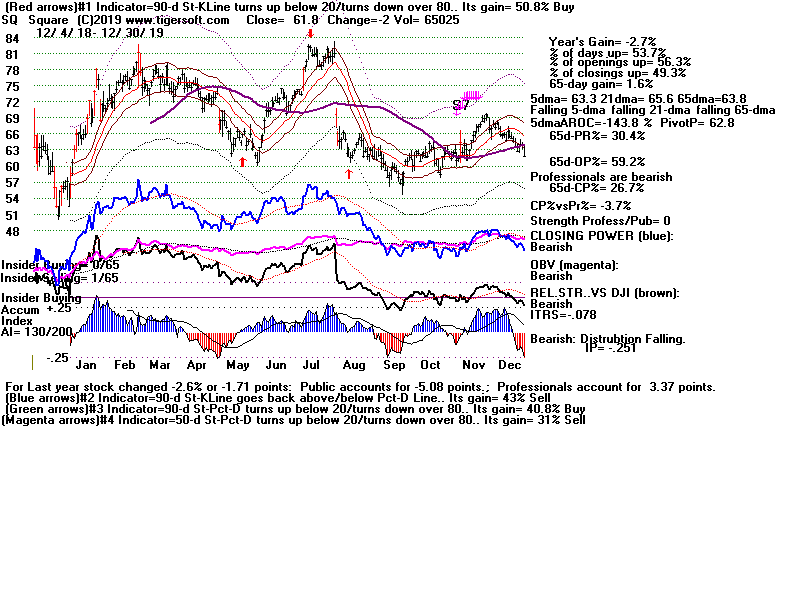
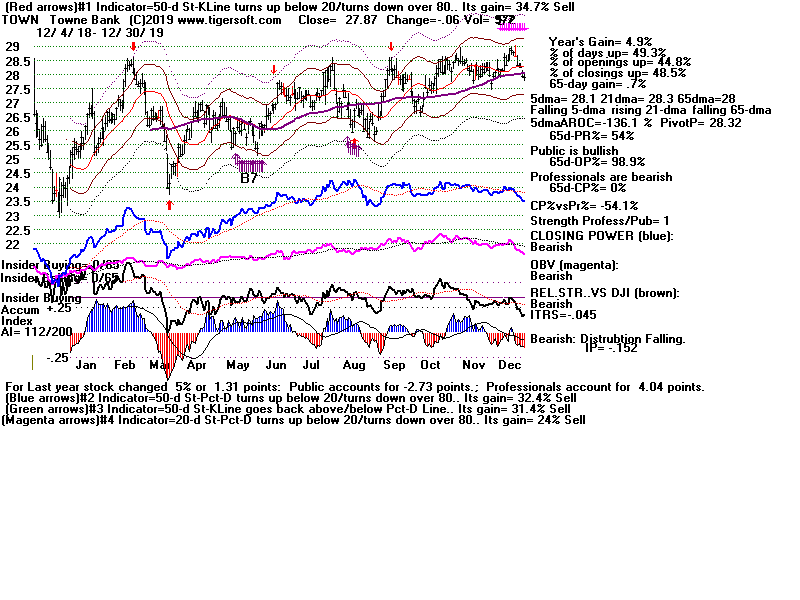