The Original Tiger Software
Return to Tiger Software's Home Page. Peerless Stock Market Timing: 1965-2006
 |
Compare 2007 Tops with TigerSoft's DJIA Charts of The Major Tops from 1928-1965, 1973, 1987 and 2002. (C) William Schmidt, 2007. This study will be part of our new book, Peerless Stock Market Timing: 1915-2010. 1/24/2007 |
By being negative or nearly so, as the DJI made a
new high or reached the upper band,
TIGER Software's invention, the Accumulation Index
would have called Every major top
from 1928 to 1966. There is insufficient data
before 1928 to compute the Accumulation
Index properly. Below are the Peerless
charts showing the biggest declines of this period.
They are:
1929,
1930, 1931, 1932, 1937, 1938,
1939, 1940, 1941,
1946, 1957, 1962,
1966
Until this year we did not have the data before
1965. Now that we have it, we can
validate and further refine the automatic Buys
and Sells that were built in 1981 based on
the data from 1972 and have since periodically been
refined and tested for the period
1965-2007. You will want to see also the Peerless Study of Major Tops and Bottoms
from 1965-2006.
Smart money somehow always seems to know before
their is a big move. Negative
Accumulation readings on a rally signifiy
Insider-Informed, Big Money Distribution,
preparatory to a decline. Get out book
and software for a much fuller account.
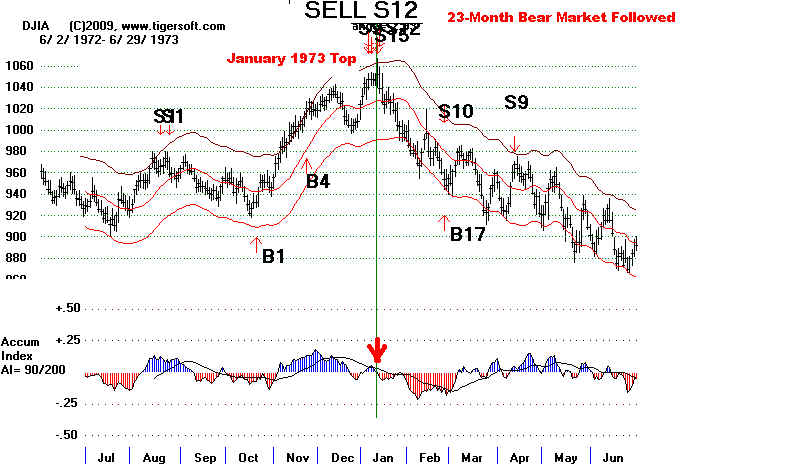
The same methodology called the tops of January 1973
before a 23 month bear market,
the major top of early October 1987 before the
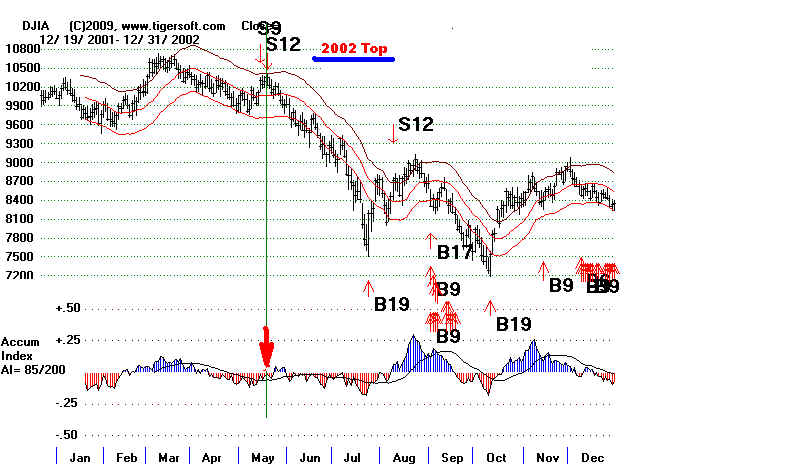
October Crash of 2007 and the top in 2001
before the 2001-2003 bear market.

January 1973
Early October 1987

March 2002
1929