

TigerSoft Serving All Investors since 1981. www.tigersoft.com
Peerless Stock Market Timing: 1915-2014: Software & Hotline
and TigerSoft Insider Trading, Charting Software
> Peerless Stock
Market Timing: 1915-2014
> Buying and
Hold? - Very Risky and So Unnecessary.
Bear Markets and Mini-Bears
from 1901-2014
Peerless is
PROOF that the
stock market can be profitably timed.
The short-seller will
make most of his money in bear markets. Peerless can help
you see the tops as
they are being made. Below are 35 bear markets and mini-bears
that Peerless timed
extremely well. There are many other smaller decline which
Peerless also would
have helped the short seller. All the Peerless charts since
1915 will be available
in a new book, Peerless Stock Market Timing: 1915-2014,
which will be available
soon.
6/17/1901 - 7/01/2008
----
Beginning ---- ------ Ending ------
Date
DJIA
Date
Dow % Loss
Days
06/17/1901 57.33 11/09/1903
30.88 -46.1 875
01/19/1906 75.45 11/15/1907
38.83 -48.5 665
11/19/1909 73.64 09/25/1911
53.43
-27.4
675
09/30/1912 68.97 07/30/1914
52.32
-24.1
668
11/21/1916 110.15 12/19/1917
65.95
-40.1
393
11/03/1919 119.62 08/24/1921
63.90
-46.6
660
03/20/1923 105.38 10/27/1923
85.76
-18.6 221
-------------------------------------------------------------------------------------------
PEERLESS HAS SUFFICIENT DATA TO GIVE SIGNALS
TIMELY PEERLESS SELL SIGNALS
--------------------------------------------------------------------------------------------
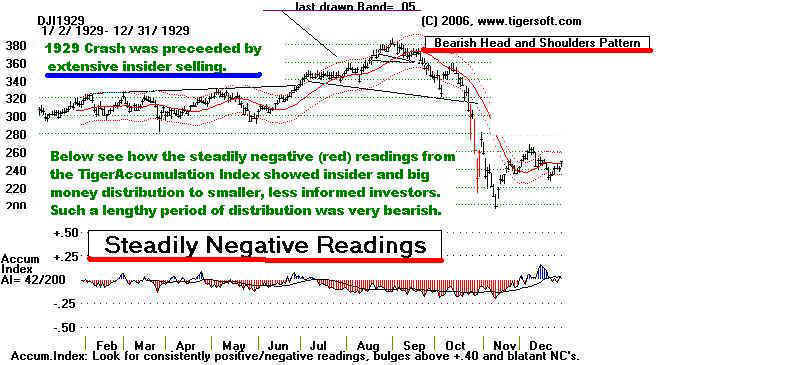
09/03/1929 381.17 11/13/1929
198.69 -47.9 71
8/1/1929 S7, 8/8/28 S12, 9/3/1929 S9
04/17/1930 294.07 07/08/1932
41.22
-86.0 813 4/2/1930, 4/17/1930 S9
09/07/1932 79.93 02/27/1933
50.16
-37.2
173 9/9/1932 S12
02/05/1934 110.74 07/26/1934
85.51
-22.8 171
2/5/1934
S12
03/10/1937 194.4
06/14/1937 165.50
-14.5
94 2/10/1937 S15, 2/11/1937 S9
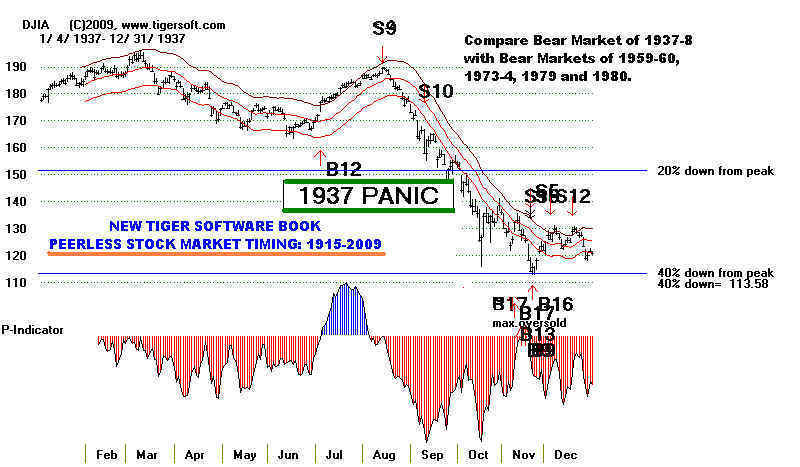
08/13/1937 189.30 03/31/1938
98.95
-47.1
166 8/3/1937 Sell S4, 8/10/1937 S7, 8/13/1937 S9
11/12/1938 158.41 04/08/1939
121.44
-23.3 14
11/10/1938 Sell S12
09/12/1939 155.92 04/28/1942
92.92 -40.4 959 9/13/1939 S9
05/29/1946 212.50 05/17/1947
163.21 -23.2
353 5/29/1946 S5, 7/11/1946 S4
06/15/1948 193.16 06/13/1949
161.60 -16.3
363 6/15/1948 S2
01/05/1953 293.79 09/14/1953
255.49
-13.0 252 12/30/1952 S16
04/06/1956 521.05 5/28/1956
468.8
-10/0 52
4/6/1956 S5, 4/9/1956 S2
(08/2/1956 521.00
10/1/1956
468.7
-10.0
60 8/2/1956 S2
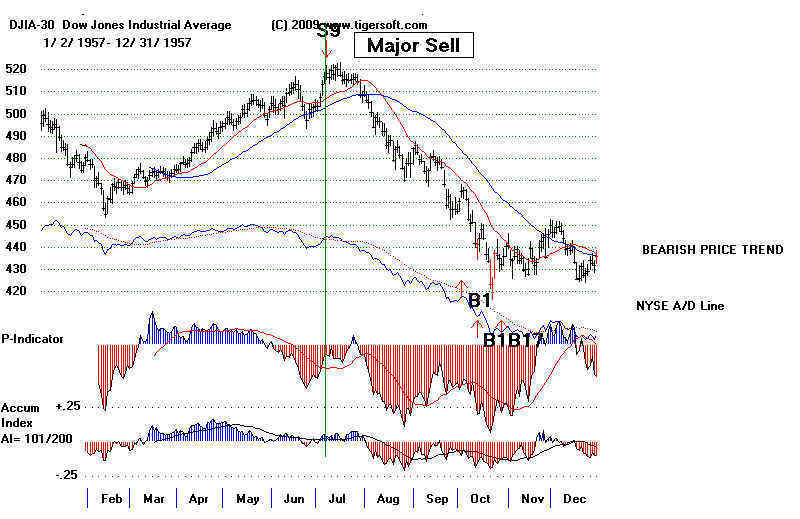
7/12/1957 520.8
10/22/1957
419.79 -.19.5
102 6/12/1957 S4, 7/5/1957 S7,
7/12/1956 S9
01/05/1960 685.47 10/25/1960
566.05
-17.4 294
12/31/1959 S16, 1/5/1960 S15
12/13/1961 734.91 06/26/1962
535.76
-27.1 195 12/28/1961 S16,
1/5/1962 S10
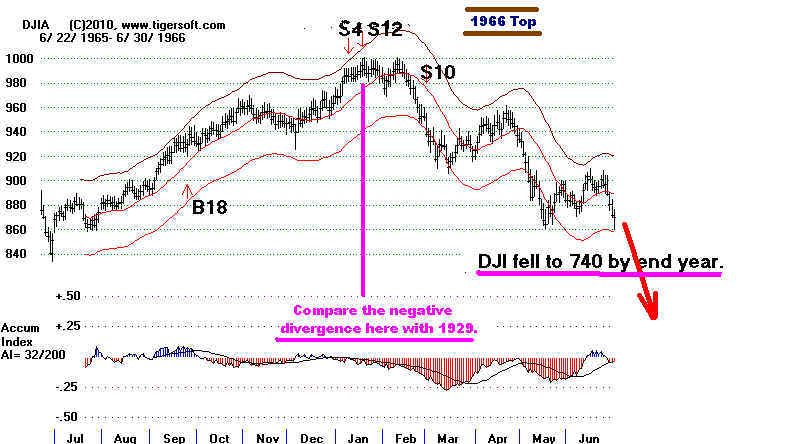
02/09/1966 995.15 10/07/1966
744.32
-25.2 240 1/6/1966 S12, 1/10/1966 S4
12/03/1968 985.21 05/26/1970
631.16
-35.9 539
12/5/1968 S1, 4/30/1969 S9, 5/6/1969 S3
04/28/1971 950.82 11/23/1971
797.97
-16.1 209 5/6/1971 S19
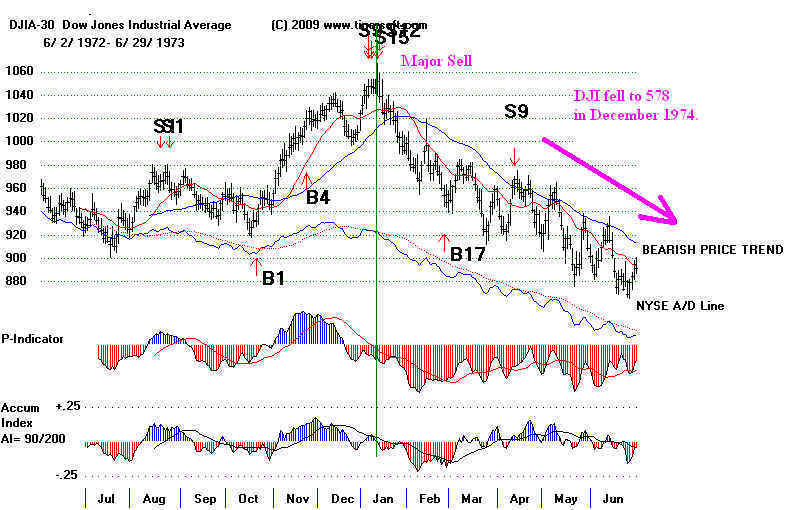
01/11/1973 1051.70 12/06/1974
577.60 -45.1 694 1/5/1973 S15, 1/8.1973 S9, 19/1973 S4,
1/11/1973 S10
09/21/1976 1014.79 02/28/1978
742.12 -26.9
525
9/24/1976 S1
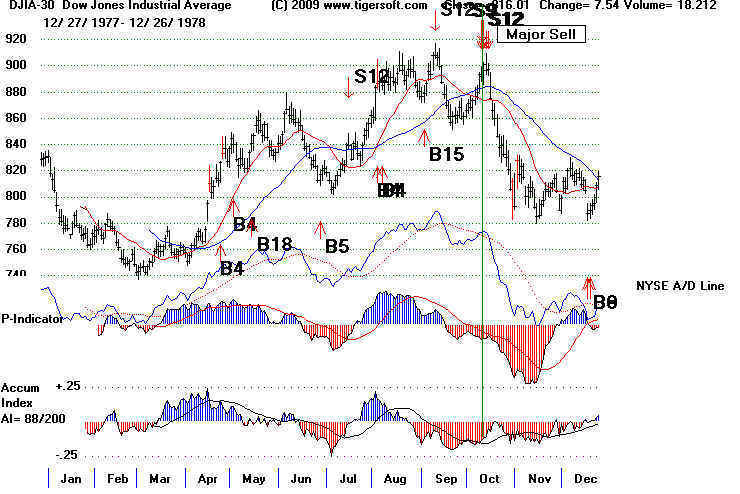
09/08/1978 907.74 12/18/1978
787.51
-13.5
107 9/8/1978 S12, 9/13/1978 S1,
10/11/1978 S9
10/5/1978 897.61
11/7/1979
796.67
-11.0
33
9/20/1979 S7, 9/21/1979 S8
2/13/1980 903.84
04/21/1980
759.13 -16.0
76 1/16/1980 S4, 2/13/1980 S9 and S15
04/27/1981 1024.05 08/12/1982
776.92
-24.1 472 3/26/1981 S4, 4/24/1981 S15,
4/27/1981 S7
11/29/1983 1287.20 07/24/1984
1086.57 -15.6
238 11/22/1983 S4, 1/5/1984 S12
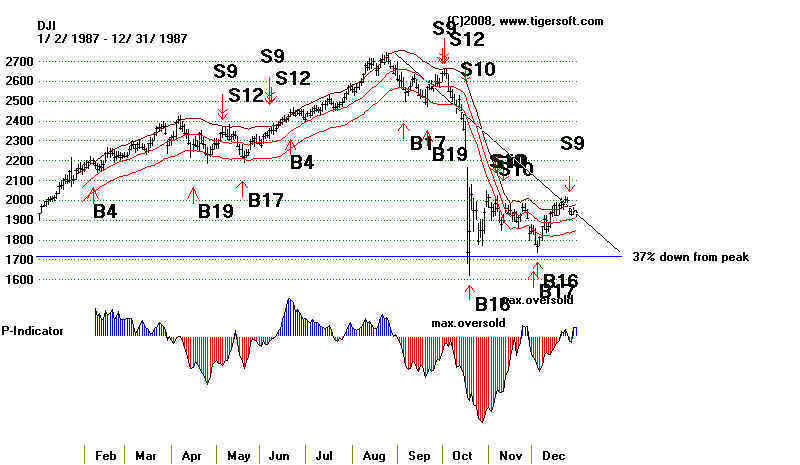
08/25/1987 2722.42 10/19/1987
1738.74 -36.1
55 8/26/1987 S4, 10/1/1987 S9, 10/2/11987
S12, 10/5/1987 S8
07/16/1990 2999.75 10/11/1990
2365.10 -21.2
87 7/121990 S9, 7/17/1990 S9
08/06/1997 8259.31
10/27/1997 7161.15
-13.5
77 9/18/1997
07/17/1998 9337.97 08/31/1998
7539.07 -19.3
45 9/23/1998 S9
01/14/2000 11722.98 09/21/2001
8235.81 -29.7
616
12/31/1999 S9, 1/7/2000 S15, 1/11/2000 S4
03/19/2002 10635.25 10/09/2002
7286.27 -31.5
204 2/26/2002 S15, 2/27/2002 S9, 5/17/2002 S120910-0
10/09/2007 14164.53 3/9/2009
6547.05
-53.5 500 9/19/2007 S2, 1-/5/2007 S4, 12/6/2007 S12, 12/7/2007 S9
04/23/2010 11204.28 7/2/2010
9686.48
-13.5
70
3/23/2010 S3, 4/16/2010 S11, Tiger
Sell S5.
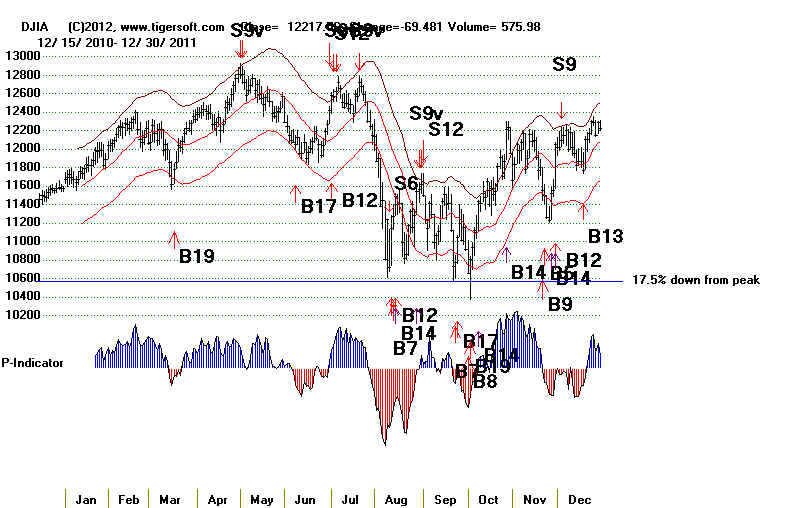
05/02/2011 12807.36 10/3/2011
10655.30 -16.9
154 5/2/2011 S8 and S9V
8%-17%
Since 1929, there have been 11 bull
markets lasting more than 24 months without a
DJI decline of more than 13.5%. In that time,
there were 28 cases of 8%-17% declines
that puncutated these long advances, like we are now
in.
Corrections in the 11 Longest DJI Advances
since 1928
1. 7/26/34 -
3/10/1937 30 months
Feb-March 1935 10% decline
(There was a Sell S12 in January 1935 and Buy B5 at bottom).
March-April 1936 12% decline
(There was a Sell S12 in March 1936 at top and B2 at bottom.)
March-June 1937 15% decline (Sell S9 at top
and B8 at bottom.)
2. 4/28/42 -
5/29/46 49 months
July 1943-November 1943 11%
decline(June 1943 Sell S9. November 194 Buy B9
3.
9/14/53 - 7/12/57
46 months
Sept 1955-October1955 10% decline
(Sell S4 at top. Buy B17 at bottom.)
April 1956-May 1956 10% decline
(Sell S2 at top. Buy B19 at bottom.)
August 1956-Nov 1956 11%
decline (Sell S2 at top. Buy B2 in October.)
4. 10/21/57 -
1/5/60 26 months
August 1959-Sept 1969 9% decline
(Sell S4 at top. Buy B17 at the bottom.)
5. 10/23/62 - 1/5/66 38 months
May 1965-June 1965 11% decline
(Sell S8 at top. Buy B10 in August after the bottom.)
6. 7/24/84 - 8/25/87 37 months
July 1986-Aug 1984 9% decline
(Sell S9 before top. Buy B17 in July before the bottom.)
Sept 1986-Sept 1984 9%
decline (Sell S9 before top. Buy B17 just before the bottom.)
April 1987-May 1987 9%
decline (Sell S9 at top. Buy B17 at the bottom.)
7.
12/4/87 - 7/17/90
32 months
Oct 1989-Oct 1989 9% decline
(Sell S9 at top. Buy B17 at the bottom.)
Jan 1990-Jan 1990 9%
decline (Sell S4/S15 at top. Buy B17 at the bottom.)
Aug 1987 - November 1987 35% decline (Sell S9/S12 at
top. Buy B9 at the bottom.)
8.
12/4/87 - 7/17/90 32 months
Oct 1989-Oct 1989 9% decline
(Sell S9 at top. Buy B17 at the bottom.)
Jan 1990-Jan 1990 9%
decline (Sell S4/S15 at top. Buy B17 at the bottom.)
2.2% declines: 1991 1 ok 3 bad, 1992 2 bad
9. 10/11/90 - 7/15/98 93 months
Jun 1992-Oct 1992 8%
decline (Sell S9 at top. Buy B17 at the bottom.)
Jan 1994-April 1994 11%
decline (Sell S4 at top. Buy B19 at the bottom.)
May 1996-July 1996 8% decline
(Sell S1 at top. Buy B17 at the bottom.)
March 1997-April 1997 10% decline
(no sell signal at top.
Buy B17 at the bottom.)
July 1997 - October 1997 13.5% decline
(Sell S12 in September after top. Buy B1/B17 at the bottom.)
END July 1998 - October 1998 20% decline (Sell S9/S12 at
top. Buy B9 at the bottom.)
2.2% declines: 1991 1 ok 1 bad, 1993: 1 bad, 1994: 1 OK, 1 bad, 1996
2 bad, 1997 2 ok 4 bad.1998
10. 3/12/2003 - 10/9/07 51 months
Feb 2004-Oct 1994 9%
decline (Sell S9 at top. Buy B2/B9 at the bottom.)
May 2007-July 2007 8% decline
(Sell S9 at top. Buy B9 at the bottom.)
July 2007-Aug 2007 9% decline
(Sell S9 at top. Buy B14 two weeks after the bottom.)
October 2007-November 2007 10%
decline (Sell S4 at top. Buy B1 a week before the bottom.)
END
December 2007-February 2009 Bear Market 51% Decline. Sell S9/S12 at top
2.2% declines: 2003 1 ok, 2007 5 ok.
11. 3/9/2009 - 4/29/2011 25.5 months
Jan 2010-Feb 2010 8%
decline (Sell S9 2 months before top. Buy B17 at the bottom.)
END April 2010 - June
2010 13.5% decline
(no sell signal at top
Buy B8 at the bottom.)
2.2% declines These failed to predict a decline in 13 cases. They accurately
predicted a decline only
April 29. 2011-October 3, 2011. 17%
decline. Perfect Peerless Sell and Buy signals.