(C) 2005 - William Schmidt, Ph.D. 11/29/2005
Gold has just risen over $500 an ounce. This is considered
an important psychological breakout. The Gold Stock Index (XAU)
is one way investors can play their sense of international uncertainty
and the long-term double whammy on the US dollar from the record
high US Treasury deficit and the massive US Trade Imbalance
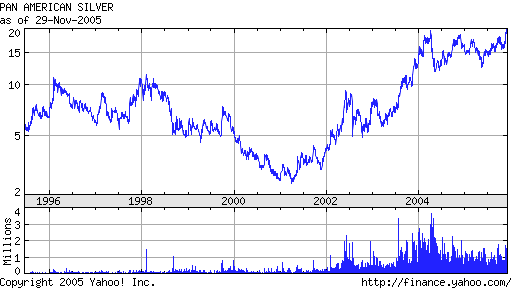
that grows month after month. Silver has just surpassed $8.00 for
the first time in more than 20 years. Some comments elsewhere.
Tiger Users should look at the longest term charts available.
These are easily found on YAHOO. Linked here are the Yahoo
charts of NEM, PAAS and SSRI. They show that significant price
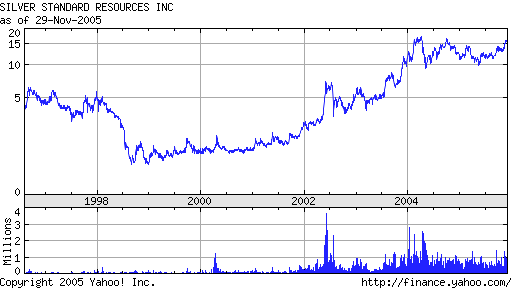
breakouts are at hand. They are quite bullish. Here are some others'
comments on these stocks.
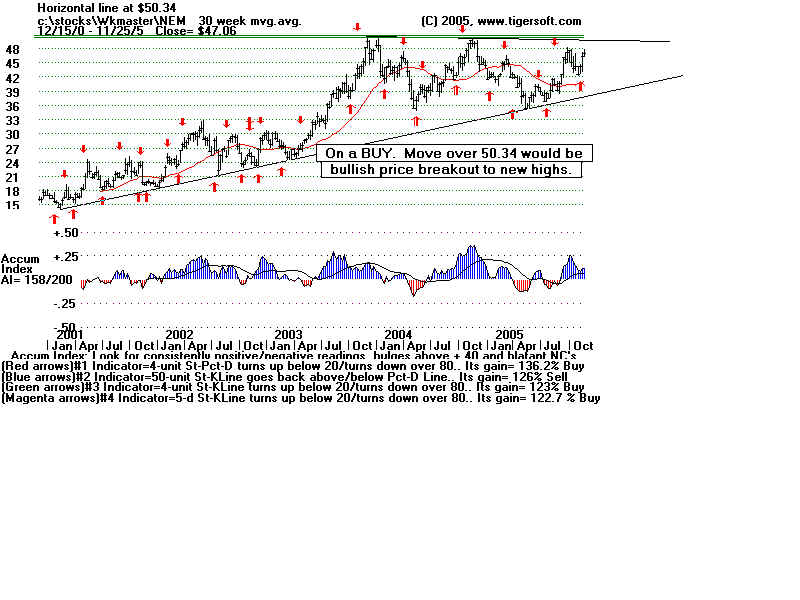
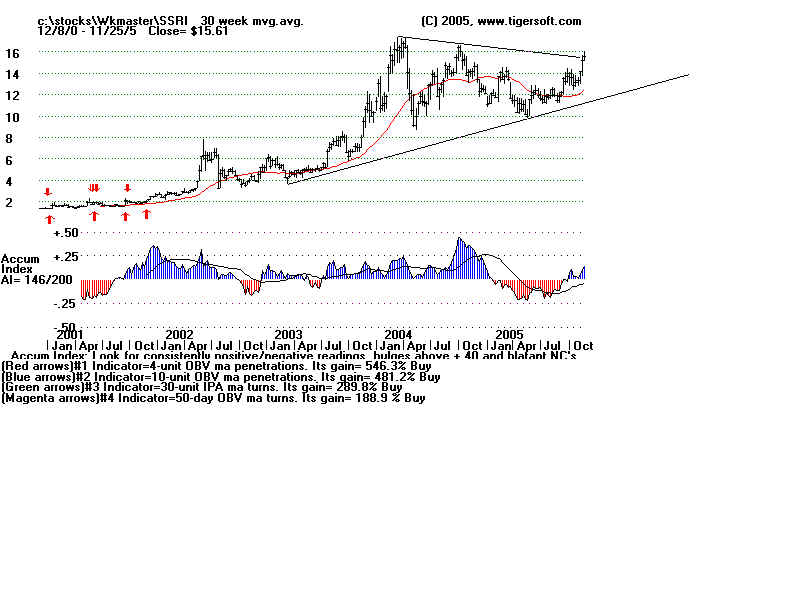
Investors should also use the TigerSoft weekly and daily charts.
These show price trends, price breakouts, Big Money Accumulation
(This is a Tiger invention dating back to 1981.) and Relative Strength.
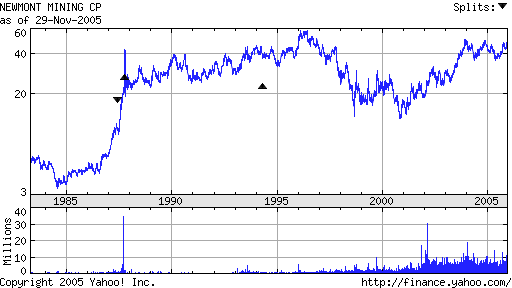
Here we compare three stocks, NEM (Newmont Mining - the world's
largest gold producer, PAAS (Pan American Silver) and SSRI
(Silver Stand Res. ) with the XAU (Gold Stock Index). Look also
for the automatically produced red Buys and Sells arrows. These show you
Buys and Sells using a process that finds the best trading system from over
60 for the period shown. These should help investors better time their
purchases and sales, whether it be stocks, mutual funds, options, futures,
currencies or commodities.
We are especially interested in silver because it ran to more than $40
an ounce in 1980 as a result of a short squeeze promoted by Bunker
Hunt from Texas. Silver has just broken above $8.00 an ounce.
Compare its action now with what happened in the 1978-1980 period.
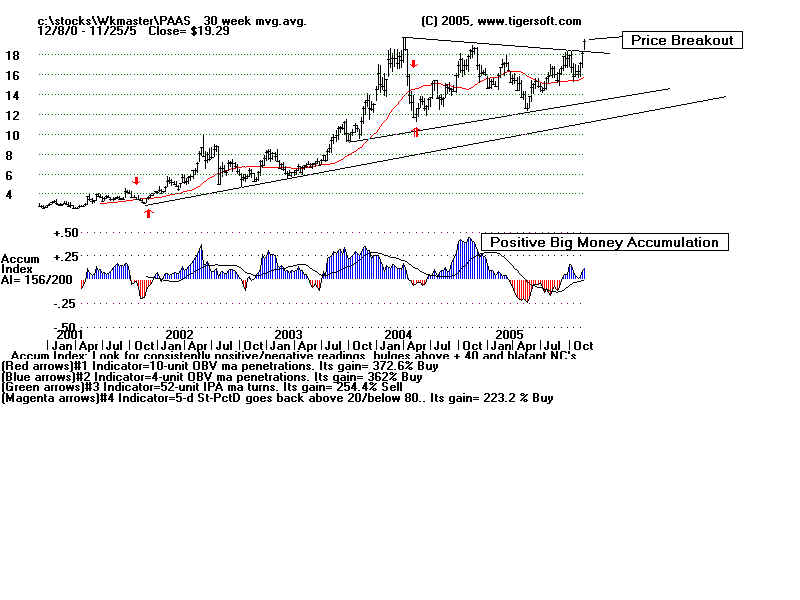
judged from the weekly charts. They each show high levels (lots of blue)
Big Money Accumulation. And they have flat-topped price patterns.
These are much more likely to lead to price breakouts than reversals.
PAAS has already scored a price breakout to a new high on its weekly
chart. It should be bought. The red arrows show the optimized Buy and Sell
signals for each chart. Each are on BUYS.
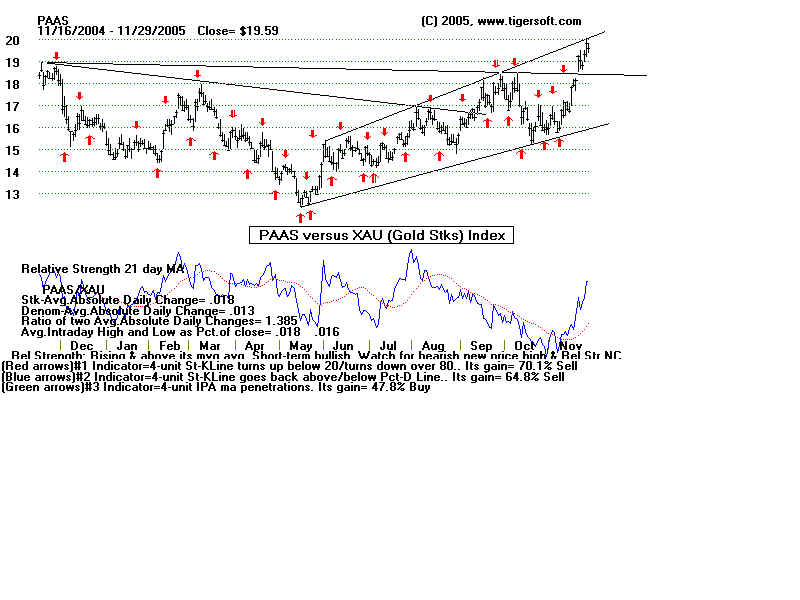
automatic Buy and Sell Signals on the daily charts. The daily charts shown
here also show how these stocks' performance compares with the XAU
(Gold Stock Index). It can be seen below that NEM is lagging. The quotient of
the NEM's closes divided by XAU's closing prices for the last year shows
a downtrend. It would seem a better idea to buy the Gold Stock Index -XAU,
than NEM at this time.
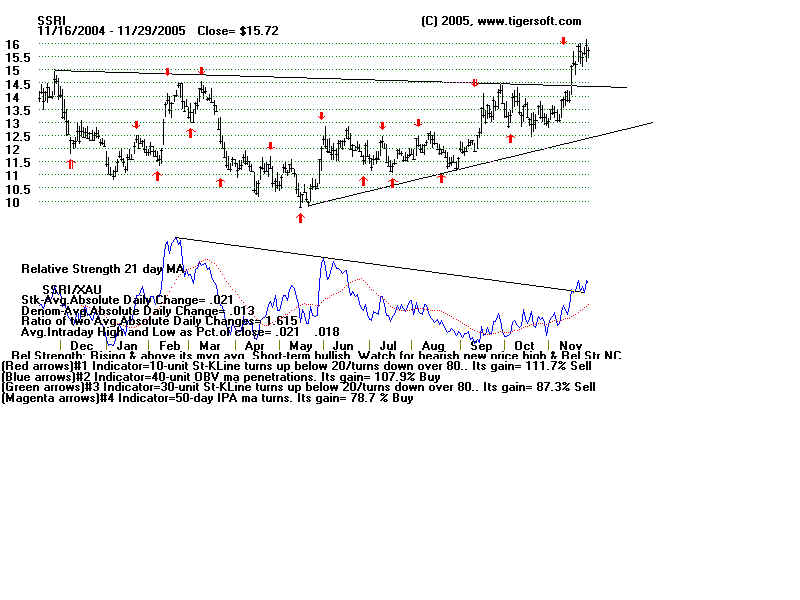
wants to buy the stock on the next small retreat. The basis for the Red Sell
is a very short-term Stochastic indicator. Longer-term investors should probably
just buy the stock.
action over the last year. It is on a Red Sell. Our software wants to buy the stock
on the next small retreat. The basis for the Red Sell is a short-term 10-day Stochastic
indicator. Longer-term investors should probably just buy the stock. You can
also see that the Quotient of its strength relative to the XAU has also achieved a
bullish trend-break.
our recent charts showing foreign currencies and closed end funds of foreign securities.