| 5/21/2006 Should You Buy A 6 Month CD Now That We Have A Peerless "Sell S9" New Research on Market Declines in Mid-Term Election Years since 1962: 1962, 1966, 1970, 1974, 1978, 1982, 1986, 1990, 1994, 1998, 2002. |
| Our Peerless Sell "S9" was clinched right at the
peak when the DJIA tagged 11709 on May 10th, 2006. Knowing of our signal, a nice young woman told me tonight that she was going to buy a 6 month CD. I told her I would not recommend that. Here's my reasoning. There are five reasons. Certainly, a bigger decline is due. We have not had a 10% decline in the SP-500 in 40 months. That ties in length the longest such period since before 1965. And new research I just did for each Year of Mid-Term Elections since 1962 shows that the DJIA has in each of these years seen a drop of 10% or more. And the average drop is 20%! (This is a new finding. It originated here. Earlier years, I'm sure behaved differently at times.) But should you buy a 6 month CD? There are fives reasons not to. 1. A big decline is not certain, yet. The DJIA is still above its lower band at 11000. It will take a break below that to start a much bigger drop. The SP-500 decline on Friday stopped at its rising 200-day ma. That is a much watched support level, too, which will have to be violated if the market is going much lower. 2. Our Peerless Market Timing system shows that it often requires 3 or more separate Sell "S9s" in 6 months to bring about a bear market. To date, this is only the first in 6 months. 3. My research for the Mid-Term Election Years since 1962 shows that even if there is a big decline, very good buying opportunities occur in October and early November. Not for nothing, is October know as the month that makes bears go into hybernation. Only once in the 11 cases, did the market fail to start rallying strongly by mid November. Usually a strong recovery or a new bull market begins in October. 4. Another reason for not buying a 6 month CD is the separate research about the stock market from 1886-1983 by Arthur Merrill. Behavior of Prices on Wall Street shows a composite Quarterly graph of the DJI representing prices during the Presidential 4 year cycle. His work shows that the market is actually apt to start up in July and continue in an uptrend for the rest of the year, punctuated by a September-October slump, with the next year being very strong. 5. Interest Rates are going up every month. It may well be that a CD bought now would not even compare with a money market rate of interest.. TigerSoft's Research of the DJI 's Price Behavior in Mid-Term Elections since 1962. The year of Mid-Term elections has since 1962 invariably brought a decline of at least 10% from a peak somewhere in the year. The declines in these 11 years ranged from 10% to 35.6%. The average decline was 20.2%. An average decline, assuming that the recent high of 11660 was the peak would mean the DJI would go to 9211. As it stands now at 11144, that would mean the DJI still has 17.3% of a decline to go, assuming the decline is typical of the average decline in these years. But should you be in a 6 month CD. You would not be able to redeploy it to use it to buy stocks at the typical bottoms that come in October and November. In only 1 of the 11 cases, did a big decline in the Mid-Term Election year not end by November. It would be nice to have the cash to use to buy if there is an October downside selling climax. Tops and Bottoms: 1962-2002, Every 4th Year. 1962 March top - June bottom (After Bay of Bigs defeat): 710-540 23.4% decline in DJIA Market up strongly after October 1966 February top - October bottom: 1000-750 33.3% decline in DJIA Market up strongly after October 1970 On Going Bear Mkt ended in May: 800-640 20% decline in DJIA Market up strongly after May 1974 On Going Bear Mkt ended December: 900-580 35.6% decline in DJIA Market up strongly after May 1978 October Mini-Bear Mkt: Oct - Nov: 900-800 11.1% decline in DJIA Market up strongly after November bottom 1982 On Going Bear Mkt: ended in August: 860-780 10.5% decline in DJIA Market up strongly in August 1986 Two 8%-10& Sell Offs: June and September 10% decline in DJIA Market up strongly after September 1990 July peak - October bottom: 3000 - 2360 21.3% decline in DJIA Market up strongly after October bottom 1994 January peak - April bottom: 4000 - 3550 11.3% decline in DJIA Market up strongly after November 1998 July peak - October bottom: 9400-7550 20.7% decline in DJIA Market up strongly after October bottom 2002 Bear market continued - October bottom: 10200-7400 25.5% decline in DJIA Bull market did not start until February 2003. |
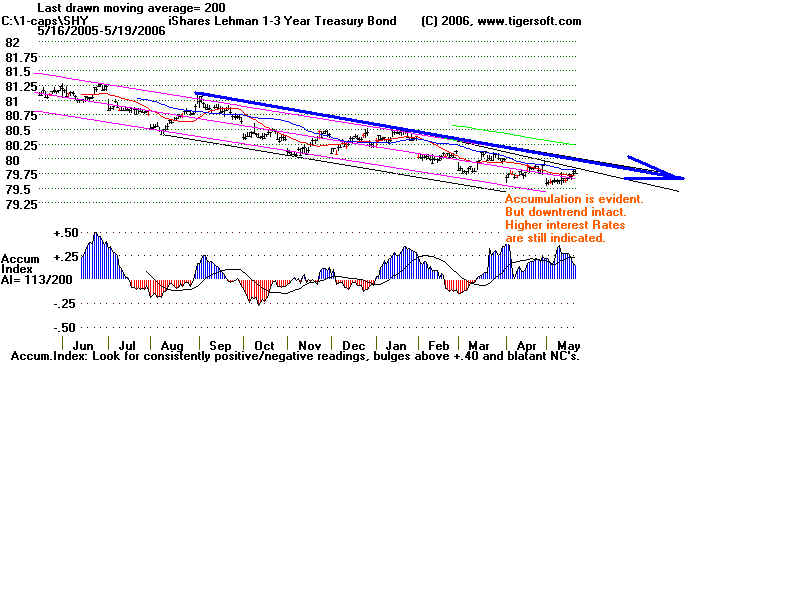
| Here is Tiger chart of 1-3 year Treasury
Notes. |