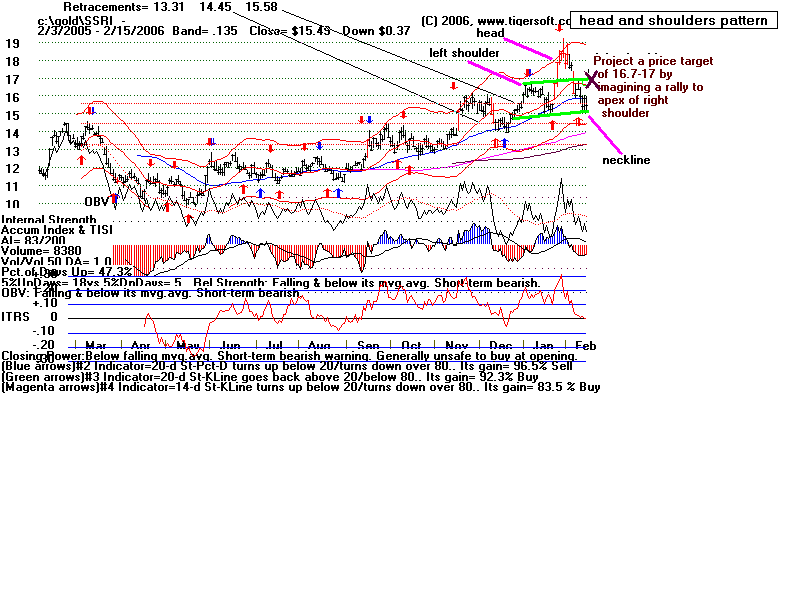
Projecting an Upside Trading Target in A Head and Shoullders Pattern
SSRI - 2/15/2006
The trick in this is to imagine that the right shoulder will be symetrical to the left shoulder.
This is useful for traders primarily. Note also that if the projected right shoulder is
exceeded on the next rally, the head and shoulders pattern become much attenuated.
Usually a stock will rally quickly from that point over a brief period of time, as shorts
scramble to cover,
Head and shoulders patterns by themselves are not very reliable. Lots of them
do fail... That is why we recommend also looking at internals - suchas the level of
the Accumulation on the right shoulder and whether the OBV (aggressive buying)
Line rises equally with prices. The best thing that can be said about SSRI is that
it is a steady uptrend and its ITRS reading of 0 means that it is not weaker than the
Dow Jones Industrial Average for the last 50 trading days.
A close below the neckline at 14 would be bearish. It would likely mean a lot
more selling pressure. The height of the head and shoulders pattern is a good clue
as to its volatility; so, a break below 15 could start a decline of nearly 4 points,
back to 11. The longer term (black) 200 day ma and the 2/3 retracement at 13.31
would be the next place down I would try to buy the stock if 16 is violated.
If one still is looking for a silver stock, I would look elsewhere. Perhaps PAAS.
