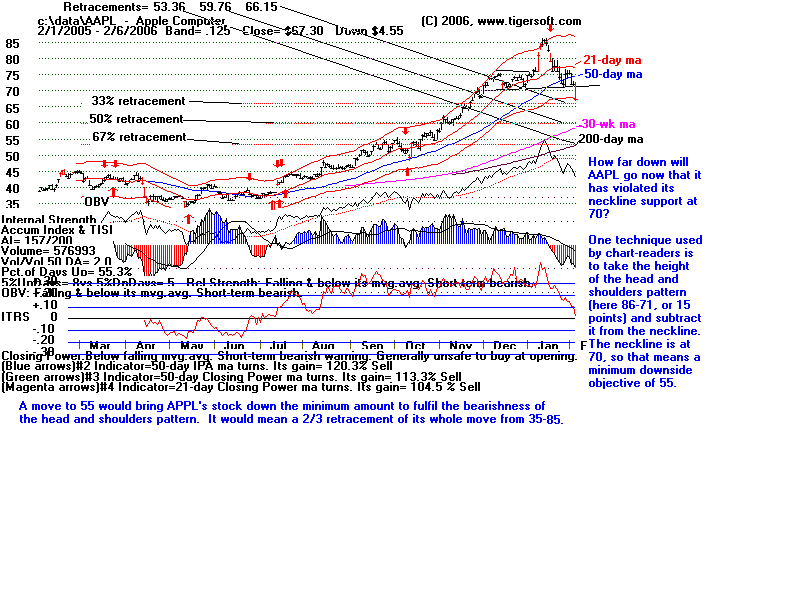
APPLE's Bearish Head and Shoulders Pattern.
Breaking of One Key Moving Average Often
Leads to Testing of the Next Key MA:
Key moving averages are 5, 21, 50, 149 (30 wks) and 200 days
In stock below, AAPL, you can see the stock is breaking down.
Having failed the flat-topped breakout at 75. it broke an unseen 5-day ma.
Then it violated the red 21-day ma. Next it broke its blue 50-day ma.
This sets up a decline to its pink 30-wk ma and then the black 200-day ma.
The head and shoulders price pattern now has a minimum downside
objective of 15 points lower than the neckline at 50, based on the
height of the pattern.
That would mean a 67% retracement of the entire move.
But the bulls should not despair. The 30-week ma of the stock
is rising. More head and shoulders patterns fail when the 30-week
ma is rising. A price move above the apex of the right shoulders,
now 76, would abort the head and shoulders pattern and permit
AAPL to resume its bull market. For the time being, though,
the odds favor a decline to 55.
We'll watch its progress here and talk about it.