Once you've identified a stock you'd like to own, see
if you can use some of the Tiger tools for finding a great
price to buy into it.
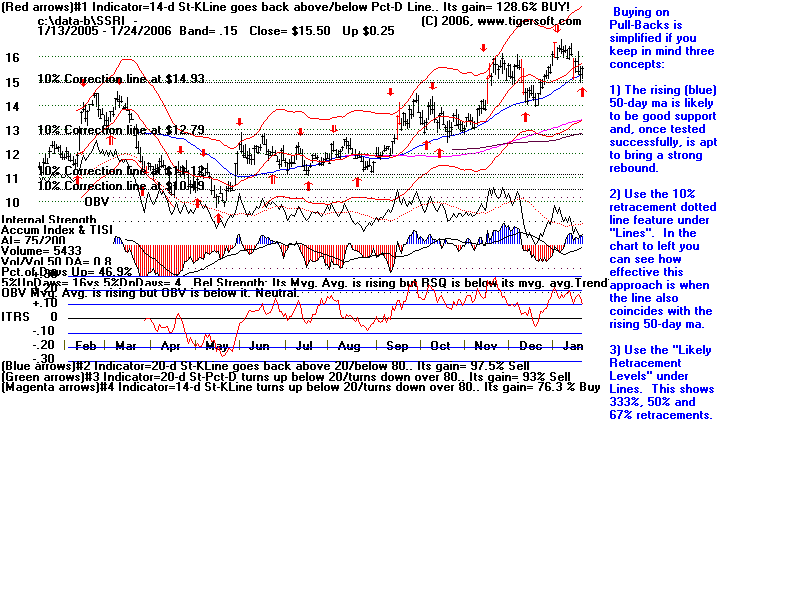
We tell folks to consider the Red Buys, especially when
they are based on Short-Term Stochastics. In the chart of
SSRI (a silver stock) below, you can see that the Red Buys coincided
closely with 10% pullbacks from the highs recently achieved
on the rally as well as the rising 50-day ma.
These are not hard concepts to understand. They are much harder
to employ. They take patience and a degree of courage (because
you have to buy a stock that looks like it is falling.)
Many times a stock that has achieved a large gain over many months
will decline more than 10% from its highs. This is especially true after
there have been 3 or 4 "polite" 10% pullbacks. Use the concept that the stock
is apt to fall back to near its rising (black or yellow-green here) 200-day ma
and at least its rising (pink) 30-week ma. And use the concept that the
stock's bigger decline is apt also to achieve a 33% or a 50% pullback.
More than 67%, and you are put on notice that the decline is no mere
retreat or correction and the lows will be tested.
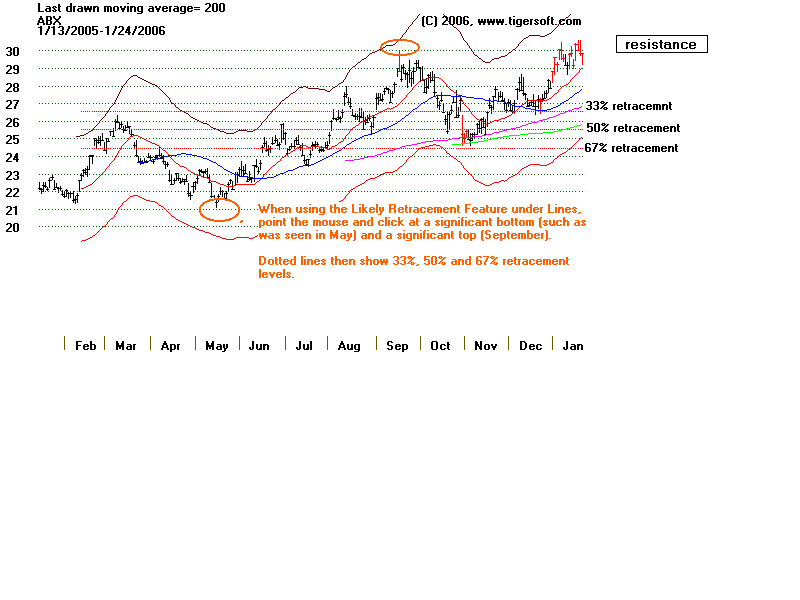
See this in the second example below. ABX ran up from 21
in May to a high of 30 in September. Its decline in October took it to
a low at the pink 30-week ma and almost exactly a 50% retracement.
The Tiger program draws three dotted lines and tells you where the
33%, 50% and 67% retracement levels are.