Charting When Data Only Shows Closing Prices,
but No Opening, High or Low.
When graphing a mutual fund and some commodities,
you may want to draw a continuous chart of the closing prices.
After the graph appear, use pull-down menu "Operations"
and chose "Closing Price Chart". Then look at Intermediate-Term
Relative Strength (ITRS) using "Indic.2" and "ITRS -Relative Strength".
Then use Signals2 + Optimized Signals. In this case, volume
is not available, either. So, we should treat with suspicion
the normal volume indicators.
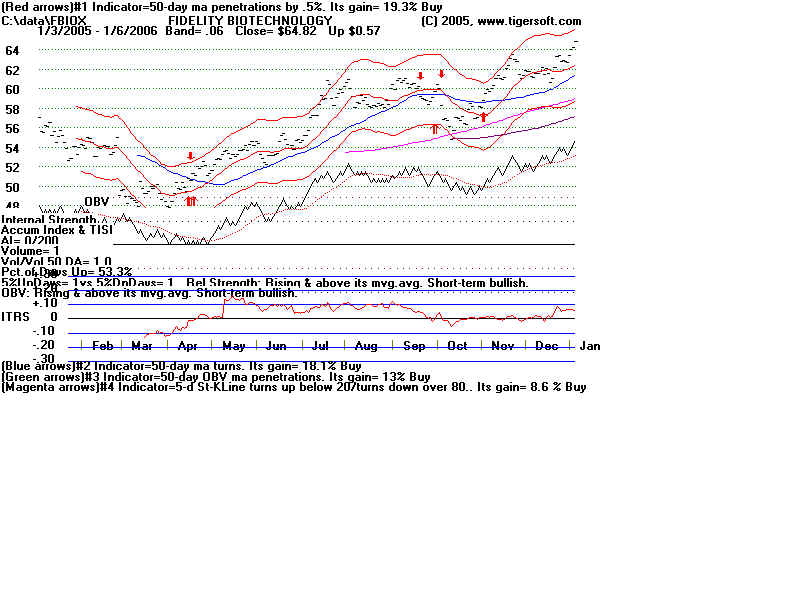
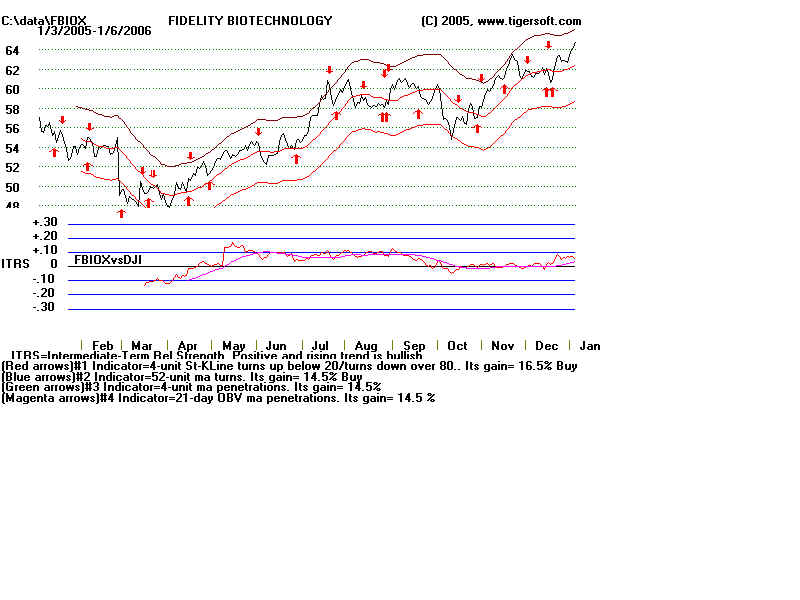
Below are two charts of Fidelity Biotech Fund. The first
shows the original chart. The second shows the one revised
in the manner described above.
Therefore the OBV Line is only a crude estimate.