What's New from Tiger Software: 2006-2007
(c) 2007 William Schmidt, Ph.D.
Sell S9 (DJI) has been modified to include those cases where the P-Indicator turns
negative after being positive for 100 days. This occurred on:
5/6/71 - produced an 11.3% gain
4/7/86 - produced a 5.2% gain
8/8/95 - should not count because P-Indicator has only been positive for 90 straight days.
Program will have to be changed.
2/20/04 - produced a 3.6% gain
1/5/07 - produced a 1.5% gain (real-time)
Buy B20 (DJI) - during Presidential Election year from March to October has been made into
a reversing major signal. During this period declines are rare. Buying at the
lower band usually works. The Buy B2 is only a major Buy during this period.
Buy B8 (NASDAQ) - Supresses S9 or S12 for 90 trading days.
Very powerful:. It reverses a Sell S9 or Selll S12.
NASDAQ major Signals' Track record:
1/9/1991 +36.3% - Right at the bottom before a big advance.
10/24/97 to 10/28/97 flat - 2 1/2 months' more testing of lows needed.
8/4/98 flat - Premature. Brief rally and another leg-down.
10/18/99 +87.7% -- Right at the bottom before a big advance.
8/12/04 +22.8% - Right at the bottom before a big advance.
6/12/06 +16.4% - Another test of lows was needed. Then big rally.
3/5/06 DJI was at 12050.41.... DJI now at 13424.96 up more than 10%
Sell S8 (NASDAQ)
7/16/99 DJI was at 11209.83 .... hit lower band in next three weeks.
Reversed by B8 on 10/18/99 with DJI at 10116.28
1/7/02 DJI was at 10197.04 ... hit lower band in next three weeks.
Reversed by B9 on 4/1/02 with DJI at 10362.7 (loss)
1/3/05 DJI was at 10729.29 hit lower band in next two weeks.
Reversed by a B19 on 4/21/05
S9s cannot occur after October 21 until end of month unless conditions are very bearish.
Displaying all Major Signals (DJI and NASDAQ) on a chart.
Place chart om screen + Signals(1) + Superimpose all major signals.
New Ranking Display without running the Analysis.
Tiger screen + Tanking results (top) + User Set Rankings (at bottom)
- Choose whatever length of time you like.
- Choose how data is to be sorted (ranked).
1. Pct Change
2. AI/200
3. IP21 (Current Accumulation)
4. Days over 21-day ma. -useful for running in the shorts on new highs.
5. Pct of Days Opening up. (Traders may wish to buy at close)
6. Pct of Days Closing up. (Traders may wish to buy at opening.)
Current Signals' Status and Spreadsheet.
After running full Nightly Analysis, use Tiger screen + Tiger Selections + #1 Indicators' Results
This presents a spreadsheet of key values for all the Stocks on New Buys or Sells.
The key values now include:
-- AI/200 level >185 is very bullish
>147 is bullish
77-146 is neutral.
<77 is bearish
<50 is very bearish
-- IP21 (Current level of Accum.Index)
IP21>.23 is bullish...desirable for Buys. especially among "Bullish" stocks.
IP21<-.12 is bearish...desirable for short sales.
-- IPvsTISI
"AR"=IP21 above rising TISI (Tisi is 21-day ma of IP21) ...desirable for Buys.
"BF"=IP21 below falling TISI...desirable for Short Sales.
-- CLvs50d
"AR"=Close over rising 50-day ma,
"BF"=Close below falling 50-day ma)
"AR"=IP21 above rising TISI (Tisi is 21-day ma of IP21) ...desirable for Buys.
"BF"=IP21 below falling TISI...desirable for Short Sales.
-- Ann50dma (Annualized rate of change of 50-day ma)
above 30% makes trending Buys safer
below -30% makes trending Short Sales safer
between -30% and 30% makes Stochastic trading signals,
Buys and Short Sales, safer. >OBV-PR (ranging from -1 to +1,
this shows if OBV Indicator is stronger or weaker than Prices for
last 100 days. bullish is 0 and higher. bearish is 0 and lower.
Research 2/2/2007 7900 stock universe study of Augmented B24s: +30.1%/yr: 1990-2007
Track Record: 1990-2006: Buying only the nost intensely accumulated stocks as flagged by
Tiger-Power-Ranker and holding simply one year:
2006 +27.7%
2005 +23.9%
2004 +40.9%
2003 +58.4%
2002 +19.0%
2001 + 1.0%
2000 +40.4%
1999 +175.6%
1998 -13.6%
1997 +7.3%
1996 +34.2%
1995 +37.5%
1994 +10.0%
1993 +14.0%
1992 +56.6%
1991 +29.6%
1990 +44.7%
-----------------
Yearly Gain = +35.7%
...................................................................................................................................................................
5/18/2007 Very Heavy Insider Buying Was Spotted in OMR.
Tiger recommended it.
Two weeks later the company doubled on news that it had brought up from the ocean
floor $500 million in 500-year old silver coins. Tons and tons of them!
5/15/2007 What Predicted The Biggest
Gainers of the Last Month? Insider-Informed
Buying as Measured by Tiger's Accumulation Index.
4/20/2007 Wall Street's Best Kept
Secret.
Low-Priced Stocks Come Alive after Long Periods of Quiet Trading.
The market conditions are just right for this now.
4/7/2007 Jobs Report belied by Weakening
Recruiting Firms.
Weak Dollar and Weak Housing Stocks Are Clear
Warnings that we are
late in this| Economic Cycle. We have now gone 48 months without a 10%
DJIA correction or more. It would be a good time to get Peerless Stock Market
Timing, so that you will be advised when the next major Sell is occurring and a bear
market starting.
3/21/2007 Recent Major Buy on SP-500 again
shows the benefits of using Peerless Stock Market Timing
3/13/2007 How Can A Tiger-Trader
Spot and Profit from Insider Selling And Big-Money Distribution?
Examples and other trading principles to supplement Short Selling manual.
Best way to spot these is looking at stocks that have just dropped below 30-wk ma
or a 50-day ma.
3/10/2007 Insider
Selling in Mortgage Lenders Is Being Investigated.
90% declines quickly followed massive
"Insider-informed" Big Money distribution as revealed by TigerSoft's negative
Accumulation readings in a rising general market.
3/2/2007: Swing-Trading the
NASDAQ-100's (QQQQ) Stocks. Use TigerSoft's Buys and Sells..
250-Day Percent Gain
Ranking
Tiger Optimal
System's Trade-Status and Yearly Gain.
2/22/2007: Top Performing Stocks as of February 2007. Insider buying is very
apparent in nearly all of the best performing stocks from July 2006 to February 2007.
Foreign stocks make up 20% of all the stocks up more
than 75% since July 2006. California companies make up only 12%.
2/4/2007: +35.7% per year since 1990-2007!
Our Tiger Special Buy Signal on individual stocks has been back-tested to 1990 from 2007
against all stocks...
More than 200 stocks have had this
powerful Buy signal occur since 1990. The annual gain averaged
+ 35.7% simply buying them and holding for a year,,,. They have been profitable even in
the middle
of bear markets. A full
explanation comes with our Full Software/All Books/ On-Line Services for a year. $995.
1/23/2007: Calling every major market top from
1928-1966. Extremely Negative Readings
from
Tiger's Accumulation Index would have warned you to sell everything
right at the the most important tops
of this era: 1929, 1937, 1940, 1941, 1946, 1957, 1962, 1966.
1/23/2007 There has not been a 10% DJIA correction since March 2003.
This is a record 46 months! Contact us to find out what the Latest Major Signal is
from our Peerless Market Timing System!
12/26/2006
Sample Hotline
12/24/2006 Oil Stocks:
Keep It Simple
11/14/2006 San
Diego Stocks:
Ranking of the
San Diego stocks since July 2006 Bottom Want
a new job? Want to sell a new Copier?
Insurance? Are you a Recruiter? Call on the companies whose
stocks are performing best in your area.
TigerSoft can easily produce this list. Tell us where you are and
the companies in your area and we
will send you a FREE sample report.
Long Bull Markets Usually Let Low-Priced Stocks Have A Very Good Play.
Making money
in low-priced stocks is one of the most closely guarded secrets on Wall
Street. Get Read for a new
Era of Cats and Dogs." Here's a little of what
we learned. But you will find a lot more in our
Explosive Super Stocks.
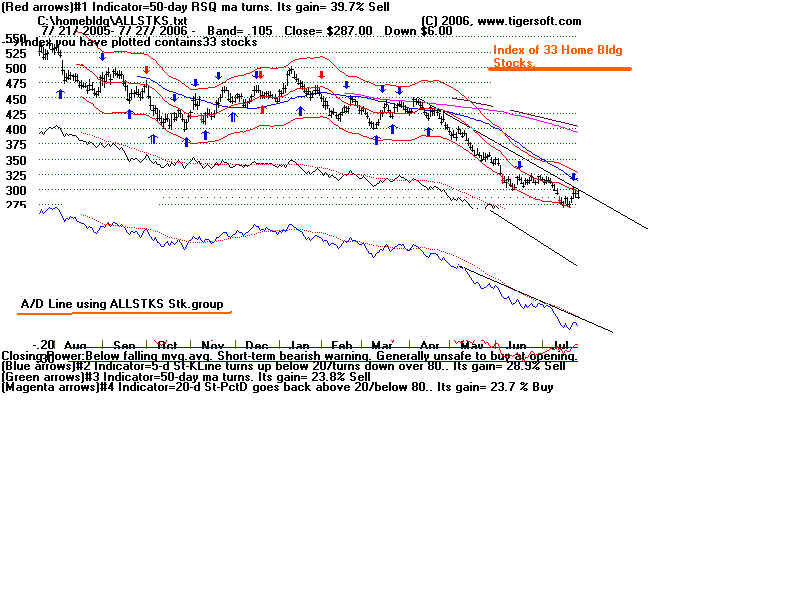
6/5/2006 Home Building
Stocks are particularly weak. See chart here.
Note that you may produce a graph which is an index of
all
the stocks in any Tiger directory. And you can display the Advance-
Decline Line of that group of stocks.
5/26/2006
Using TigerSoft to trade ETFs, Currencies, Commodities
5/21/2006 Should You Buy A Six Month CD Now after The
Peerless Major Sell "S9"?
New Research on Market Declines in Mid-Term Election Years since 1962:
1962, 1966, 1970, 1974, 1978, 1982, 1986, 1990, 1994, 1998, 2002.
Each of these years saw at decline of at
least 10%. Avg decline was 20%.
But in 10 of the 11 cases, the bottom had been reached by October or November.
5/5/2006 Which
Industry Groups Are Most Responsive To Peerless Major Buys and Sells.
4/28/2006 San Diego Stocks: Winners and
Losers since October 2005 Bottom.
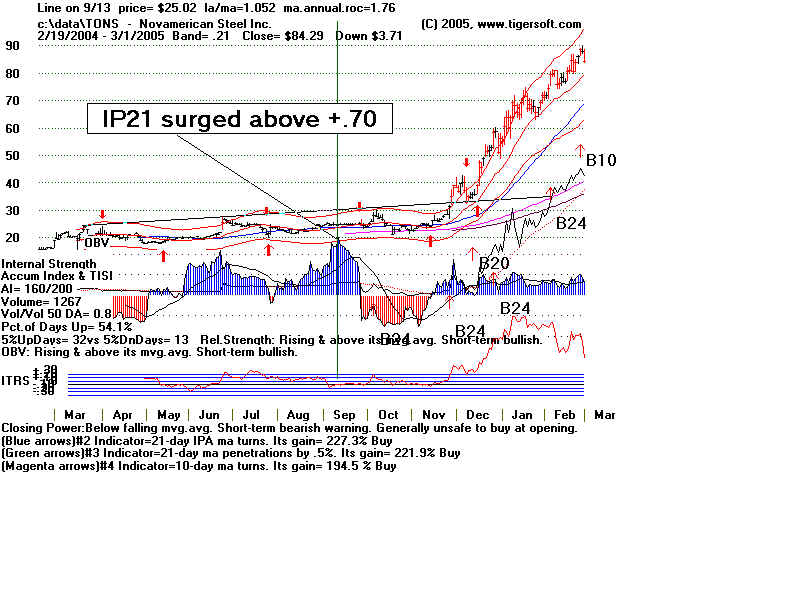
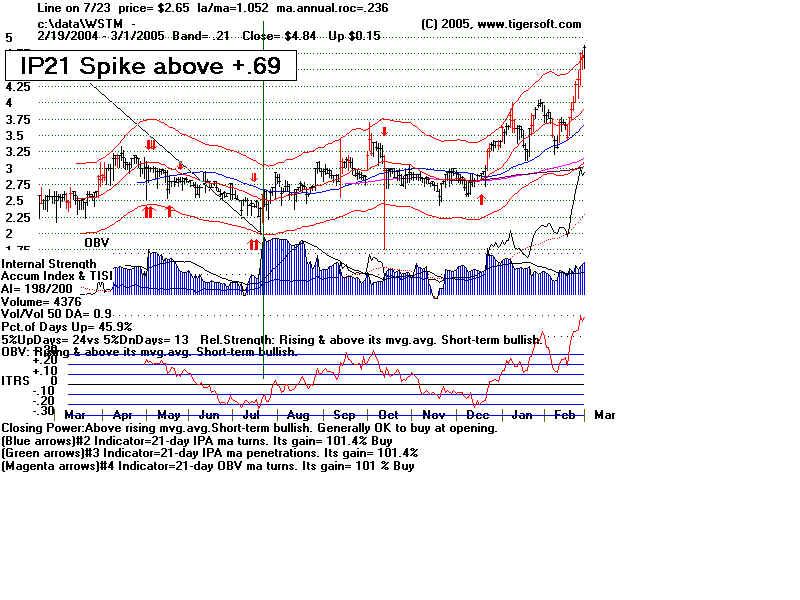
3/31/2006 What Predicts Biggest Stock Advances: 3 cases: TIE,
ADAP and IIIN
3/3/2006 7 Paths to 25% per year. Report on Buying Highest Accum. NASDAQ-100 and
Oil/Gas Stock
2/6/2006 - How To Make 40%/Year in Oil and Gas Stocks:
2003-2006: Buy #1
Most Accumulated Oil/Gas Stock
2/3/2006 - Tiger Major Buy Signals Predict The Biggest Gainers of 2005
2/2/2006 - "Hi-Ho,
Silver"...>$10/ounce SIL
1/14/2005 Buy Gold Stocks with Head Room: Buy AU
and EZA
Look also at discussion of gold
stock recommendations as ^XAU
approaches its 150 historical
double peak from 90's and 2000.
1/10/2006 - Resistance on SP-500 Chart vs B10
1/4/2006 - Foreign Stock Markets Look Bullish for
2006. TigerSoft Study on ETFs
1/3/2006: Big Profits in
International Markets and ETFs
1/1/2006:
Is
The NYSE A/D Line Still A Good Indicator?
MSFT have OBV Lines that are making 5 year lows. They are vulnerable.
11/29/2005:
Silver
Stocks Are Shining
11/15/2005: International
Markets' Weekly Charts
9/2/2005 Biotech Boom in San Diego
8/1/2005: Housing Bubble-Trouble II
7/29/2005: Housing Bubble-Trouble I
3/2/2005 - Spikes
of Accumulation: Avg. Gain of 45% over 6 months
When All Stocks Are Screened: 2004 Experience. 78% Were Profitable
2/25/2005 - A BETTER WAY TO FIND SUPER STOCKS EARLY ON:
B12's That Have
always done well for Tiger users. But their performance
can be improved
dramatically by tightening up the conditions that produce them.
Raising the
qualifications for the two indicators raised their performance
to an avg. gain
of 41.7% from their occurence in 2004 to 2/19/2005, typically
about a 5 months'
holding period.
.................................................................................................................................................
2/20/2005 - Using Long Term Charts to See Support, Resistance and Movement
Patterns.
The Case of Apple Computer's Stock.
2/15/2005 - Basic TigerSoft Technical
Analysis:
How To Analyze a Stock's
Technical Condition: AAPL - 2/14/2005
2/10/2005 --- Trading Results of QQQ
with signals given by NASDAQ. (S2 is not used.)
Trading Results of
SP-500 Using only reversing major Peerless-DJI buys and sells.
2/8/2005
Peerless-DJI-S9-S12
Clusters Warn of Market Risk in NASDAQ:
The Theory Behind the New Peerless NASDAQ B8.
.................................................................................................................................................
2/8/2005 - Peerless-DJI-S9-S12 Clusters Warn of Market Risk in
NASDAQ:
The Theory Behind the New Peerless NASDAQ B8.
.................................................................................................................................................
2/4/2005 - Which Fidelity Select Funds and Industry Group Trade Best with Peerless
Signals:
New Research for 2000-2004
12/27/2004: - Studies
of Effectiveness of Individual Tiger Automatic Signals.
Part -1, 12/27/2004, The Best of the Best.
--------------------------------------------------------------------------------------------------------------------------------------
---