TigerSoft News Service 7/1/2010 www.tigersoft.com
FOUR SCENARIOS THAT HEAD and
SHOULDER PATTERNS CAN PLAY OUT
AND HOW TO PREDICT THEM IN ADVANCE.
By William Schmidt, Ph.D.
All Rights Reserved (C) 2010 www.tigersoft.com
See
also - Head and Shoulders S10

SHOULDER PATTERNS CAN PLAY OUT
AND HOW TO PREDICT THEM IN ADVANCE.
1) They can Close Decisively below Their Neckline and Start
A Very Big Decline. Apart from how over-valued the market is
fundamentally, the extent of the decline seems to depend
upon:
(1) how far the stock market has rallied without a
significant decline.
(2) how weak the internal strength indicators are.
This is the most important.
(3) the length of the pattern,
(4) the height of the pattern and
(5) whether the neckline is falling (this tends to show
more weakness).
H&S patterns that took more than 40 days to form and
complete are much more bearish than shorter and smaller
patterns, though the appearance of smaller H&S patterns
within larger ones or multiple H&S patterns add extra bearishness.
Since the height of the pattern is used to calculate the MINIMUM
downside potential once the neckline is broken, the higher
the pattern, the greater the downside risk.
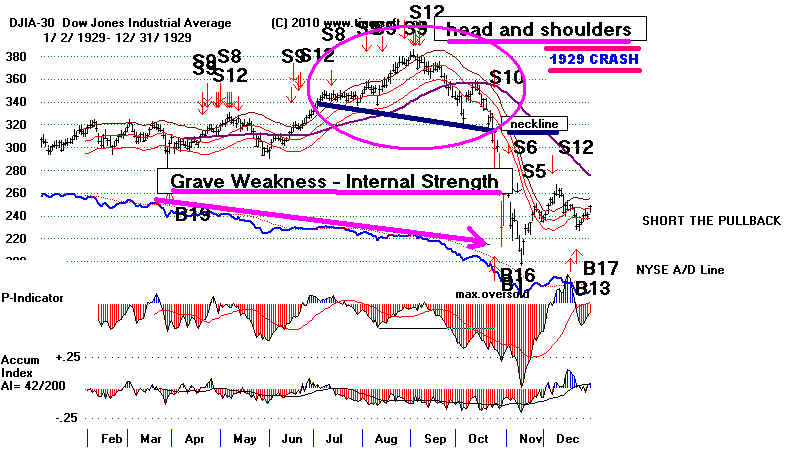
1929 shows the most bearish case. Notice how weak the
internals were before the decline: falling A/D Line, mostly
negative P-Indicator and Accumulation. Index. The pattern
lasted more than 40 days and the neckline was declining.
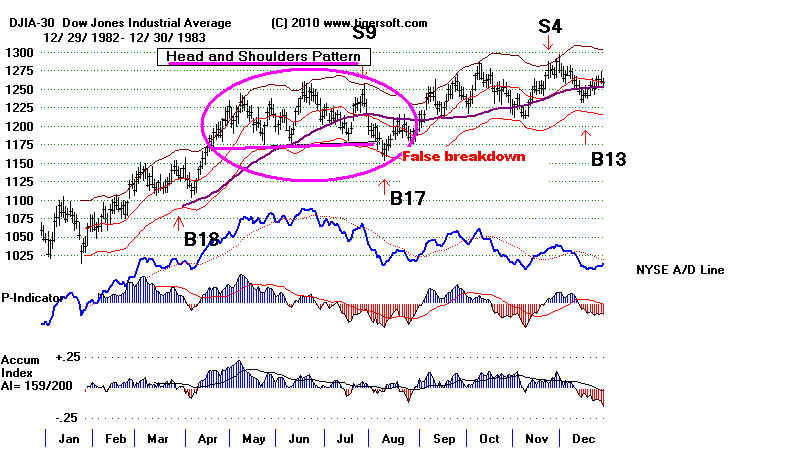
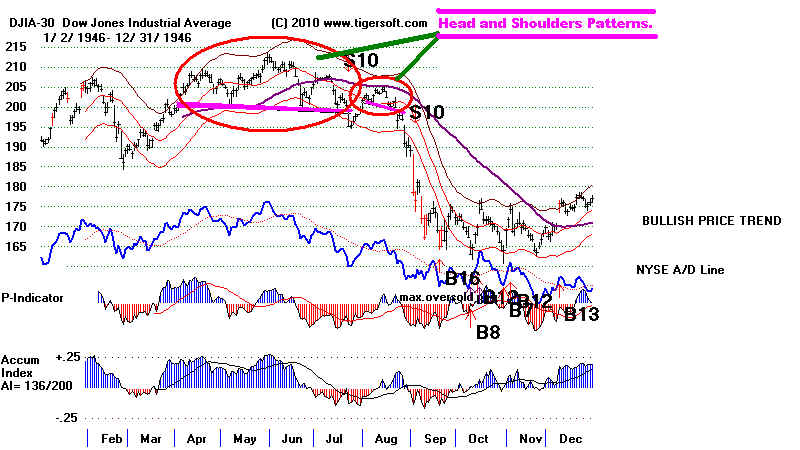
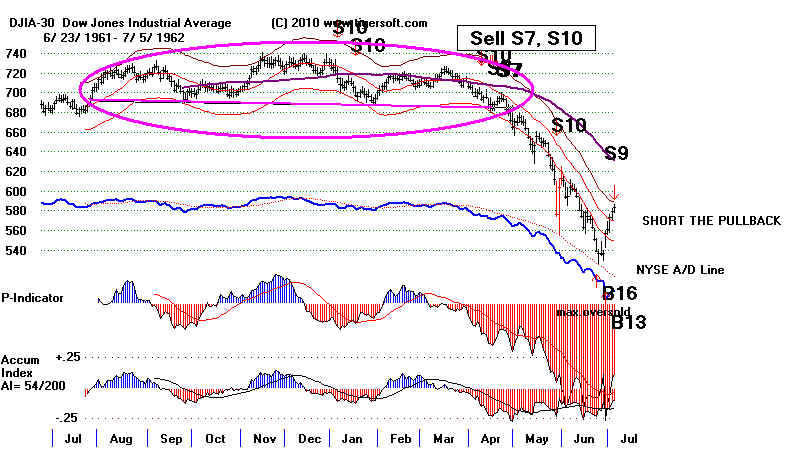
1946 and 1961-62 H&S patterns show the importance of
the length of the pattern. Notice also how internal strength
weakness develops as the right shoulder is formed.
Usually prices break below the neckline and then quickly erode.
In 1946, there was a brief rally back up to the falling 65-dma, a new
smaller head and shoulders pattern and then began the serious
decline.
1961-1962
The Coming of the Cuban Missile Crisis.
1971 shows an initial pattern of more than 40 days'
duration and then additional head and shoulders patterns.

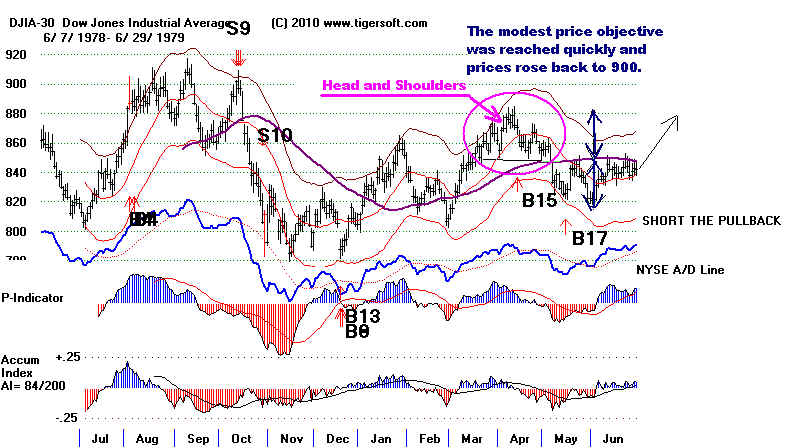
Neckline and Start Modest Decline That
Fulfills Their Minimum Price Objective
and Then Rallies.
1979 shows a smaller pattern. The market was not
over-extended. Its downside minimum objective was
quickly reached.
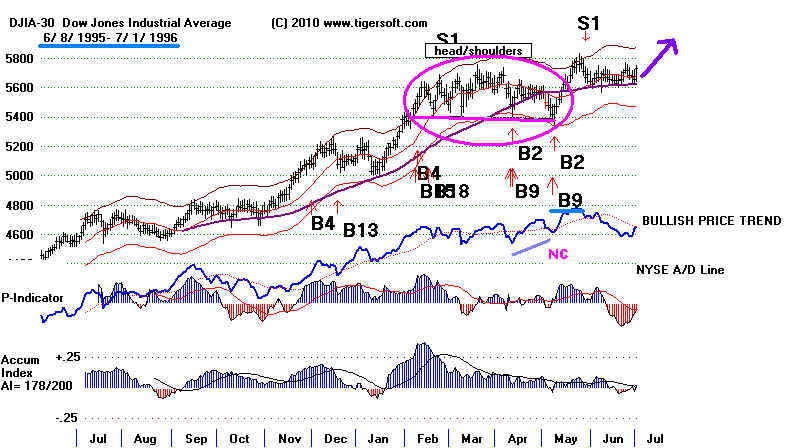
without Breaking It and Then Advance.
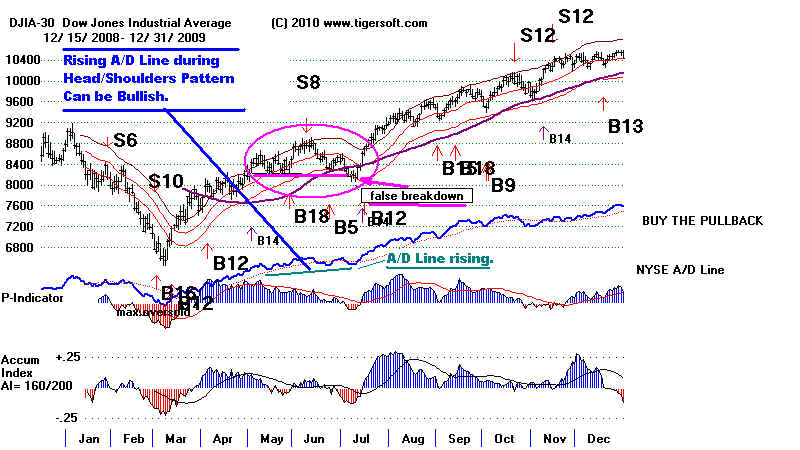
The 1996 case shows an uncompleted H&S pattern. The
neckline was never closed below. Here the rising A/D Line
was a bullish sign and a clue that the pattern would not
be complete. It was a trap for unwary bears, whose later
short-covering fueled the steep rise from 1995 to 2000.