TigerSoft's Power Ranker Scan:
          The Best and Worst Stocks of 2012
(C) 2013  www.tigersoft.com
          

HOVNP.BMP (1080054 bytes)

STXS.BMP (1084854 bytes)
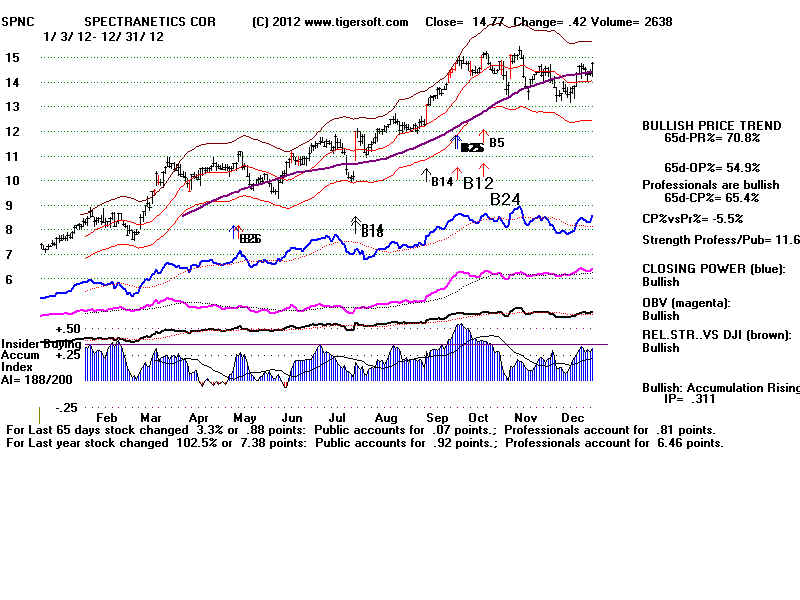
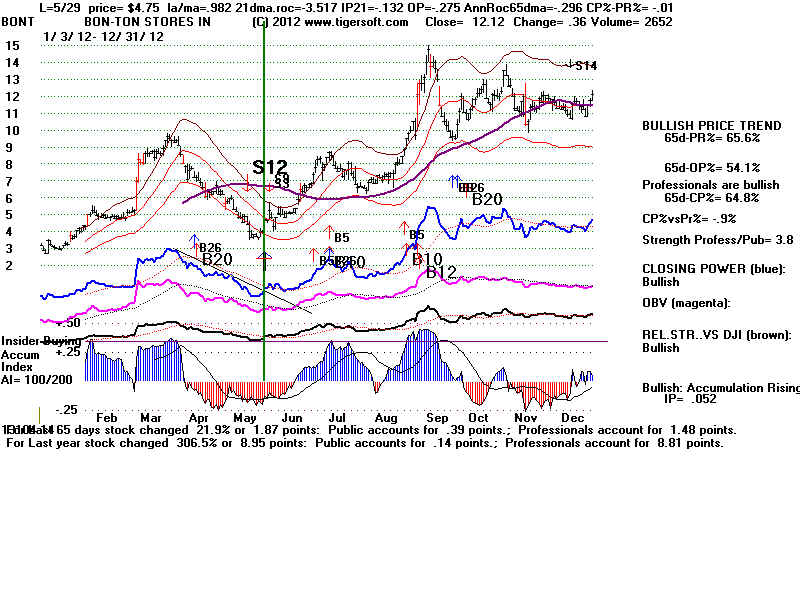
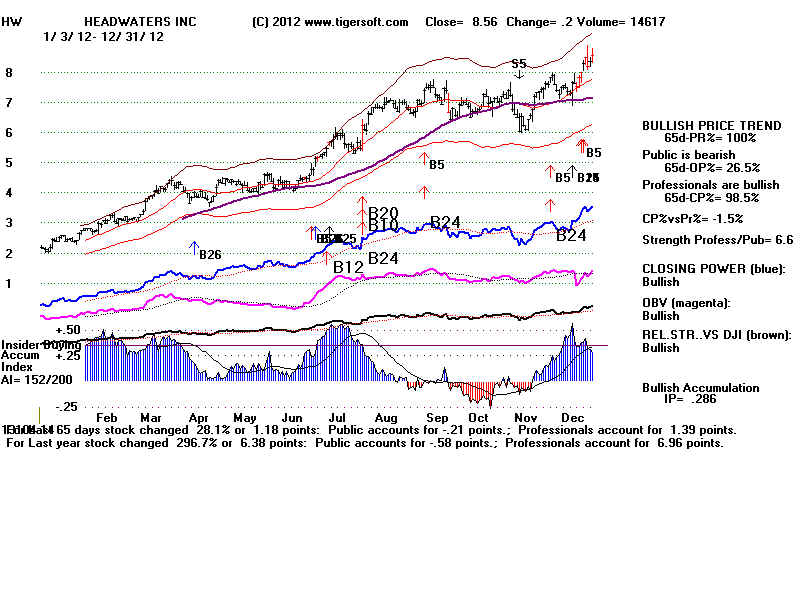
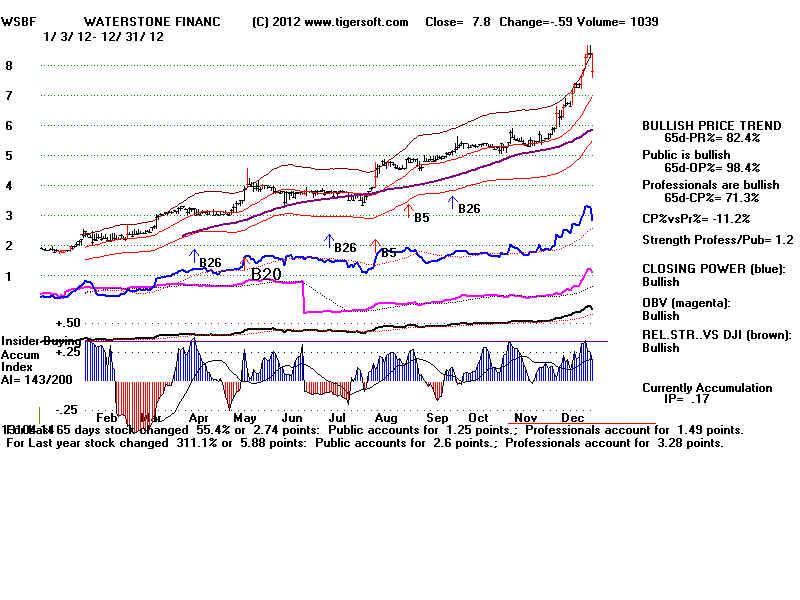
        What distinguishes them at the start of their moves?

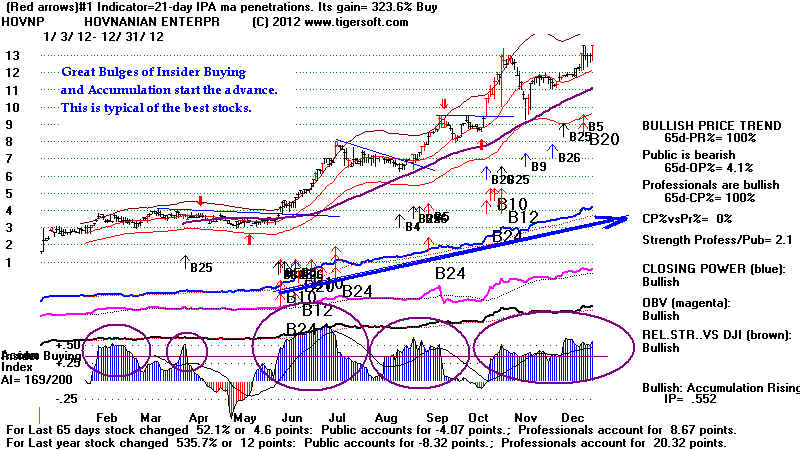
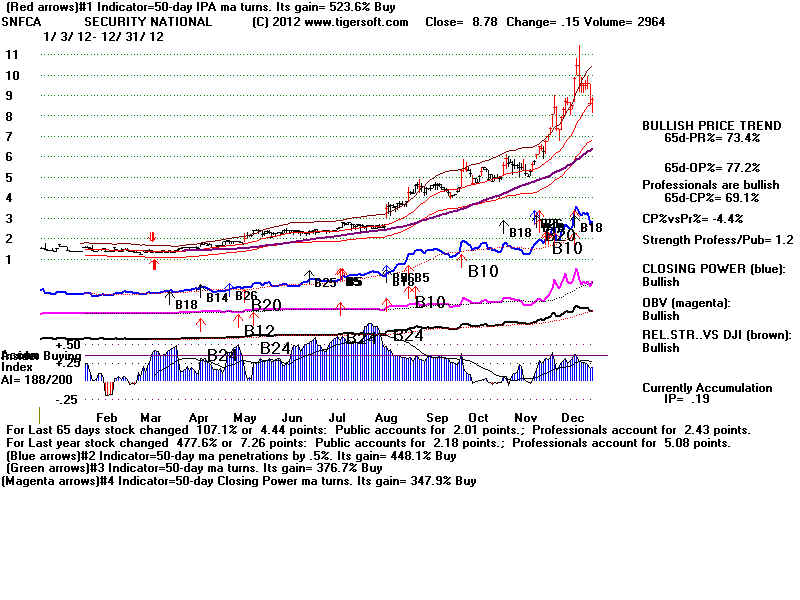
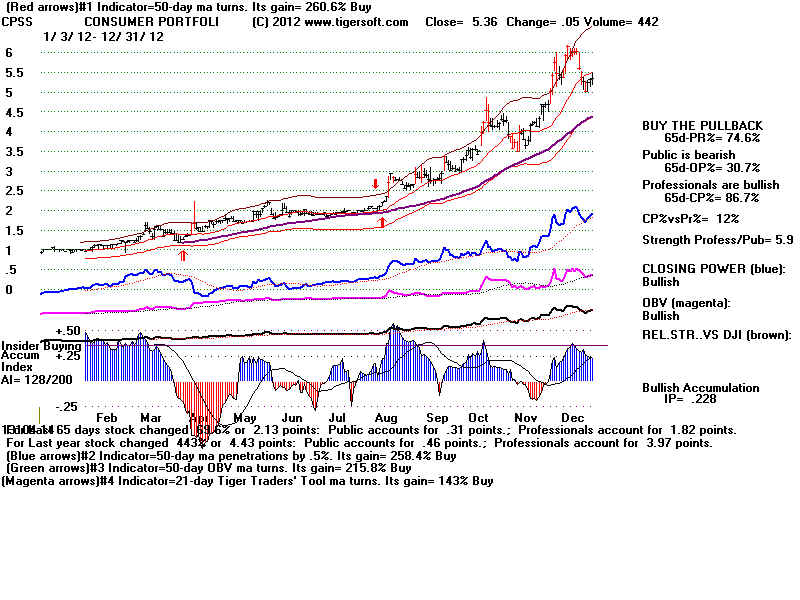
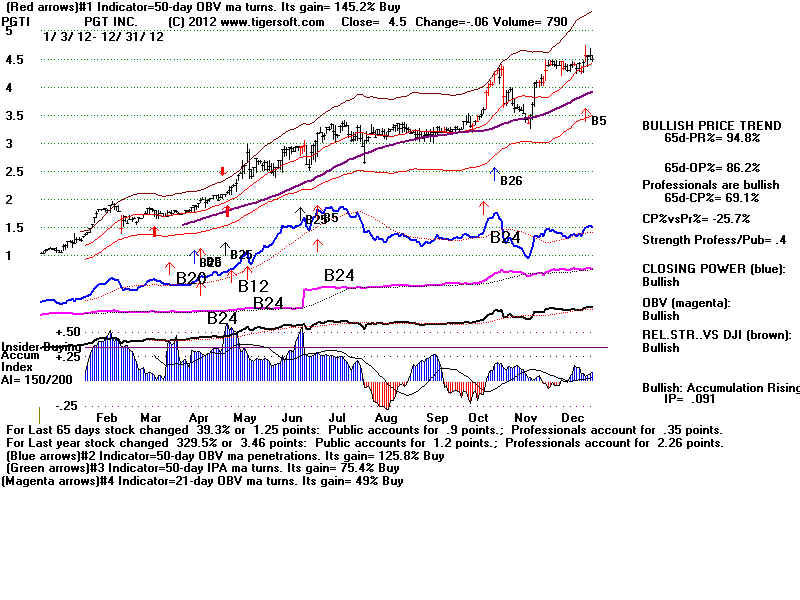
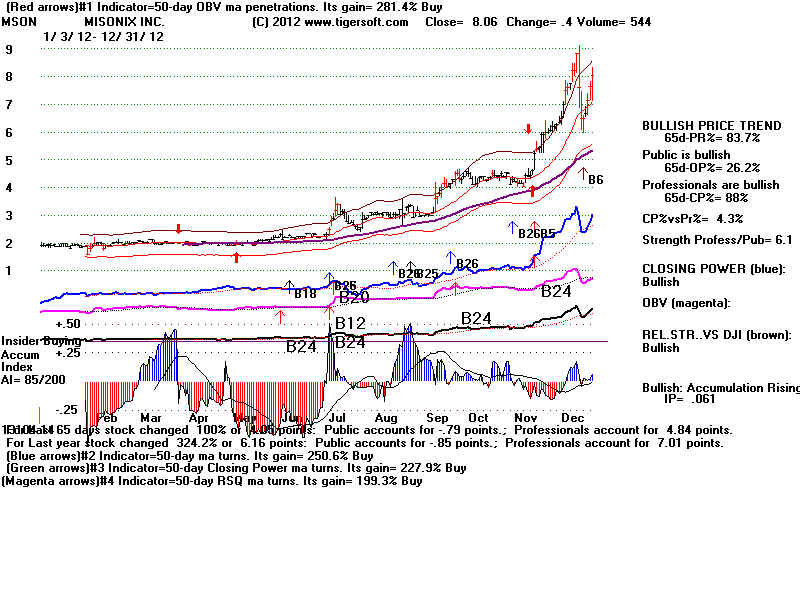
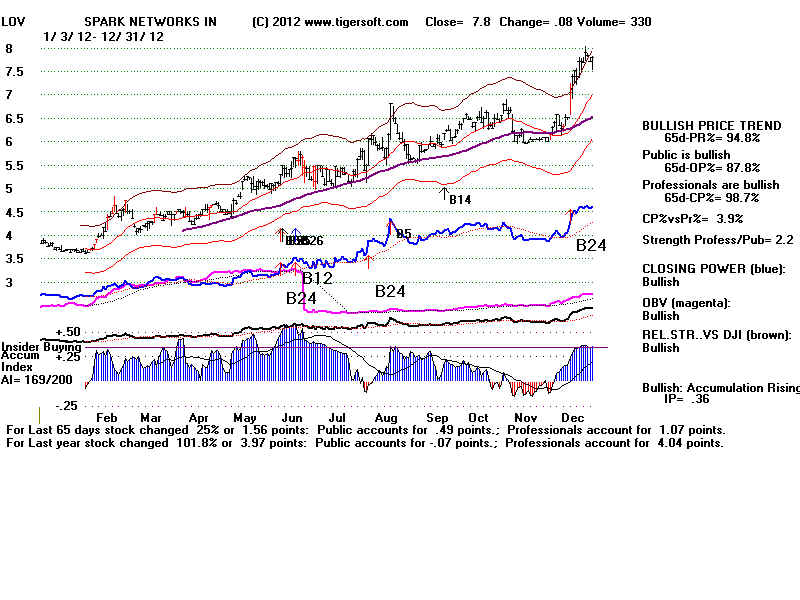
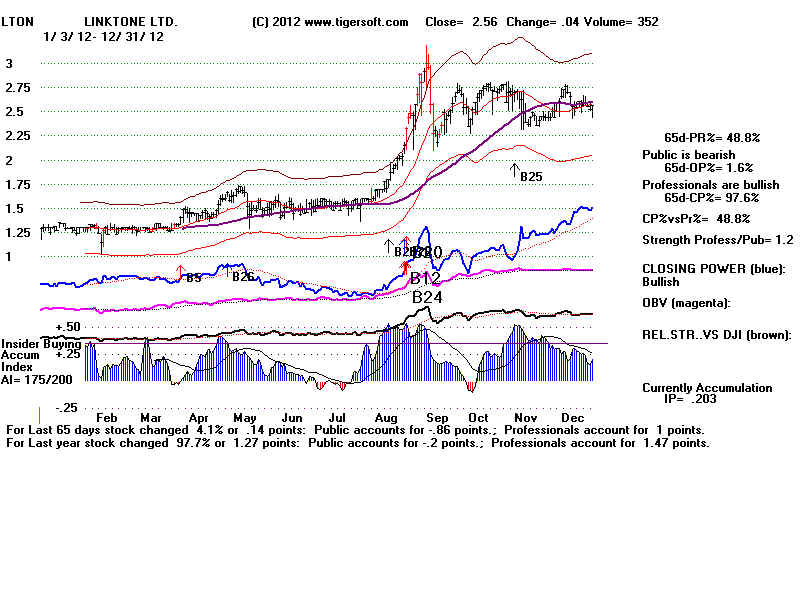
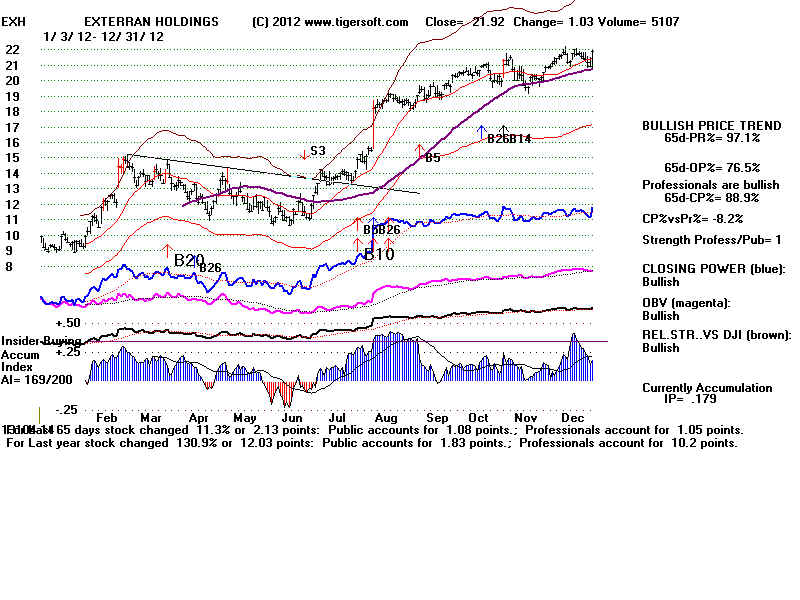
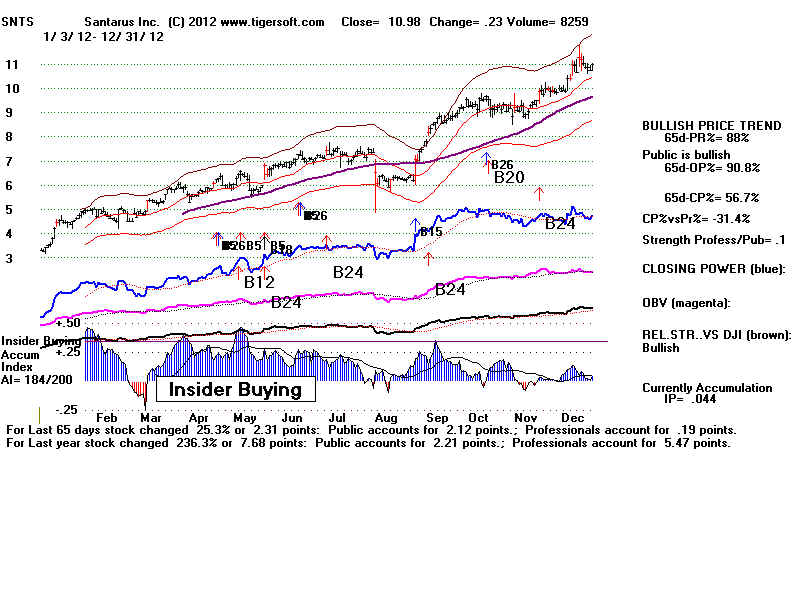
                1) The Bullish Stocks show great bulges of Accumulation and Insider Buying
                     from Tiger's Accumulation Index..
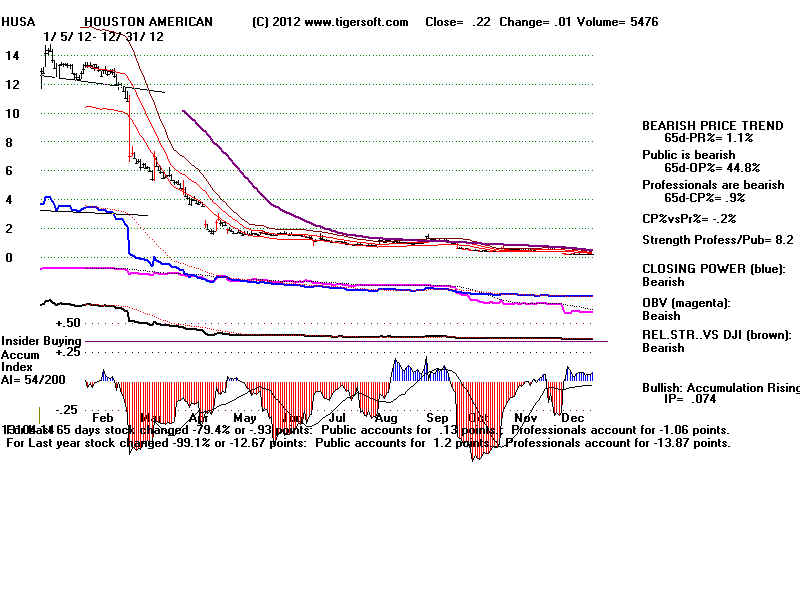
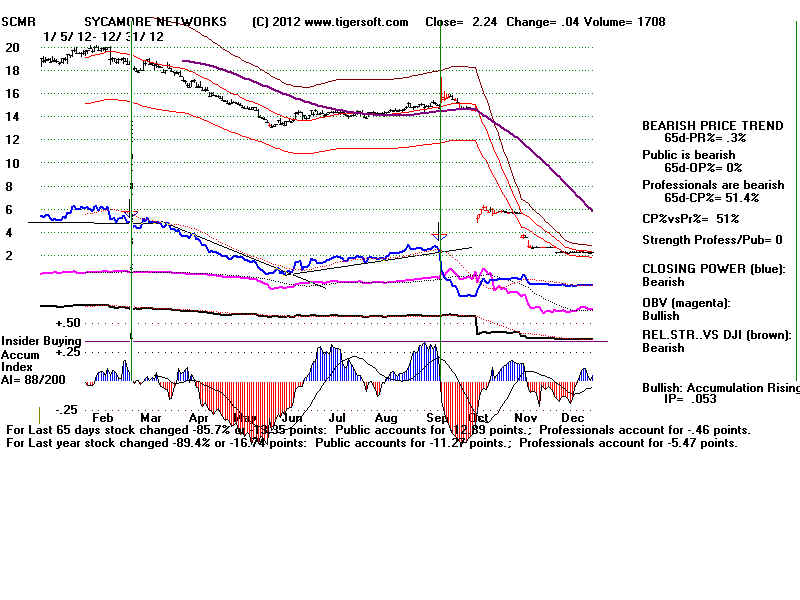
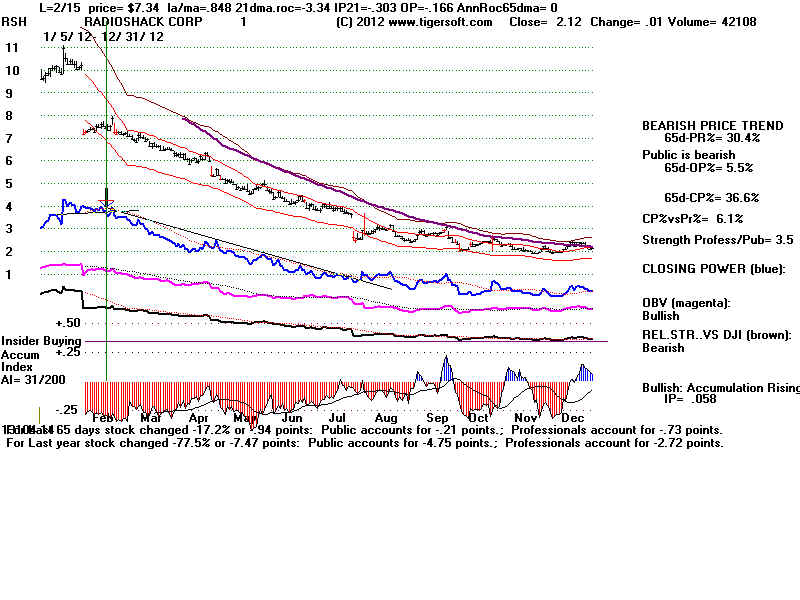
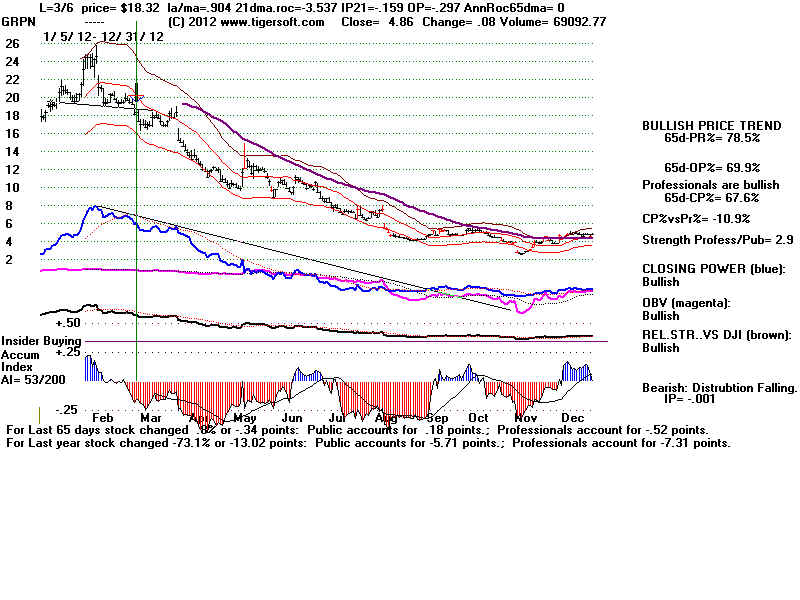
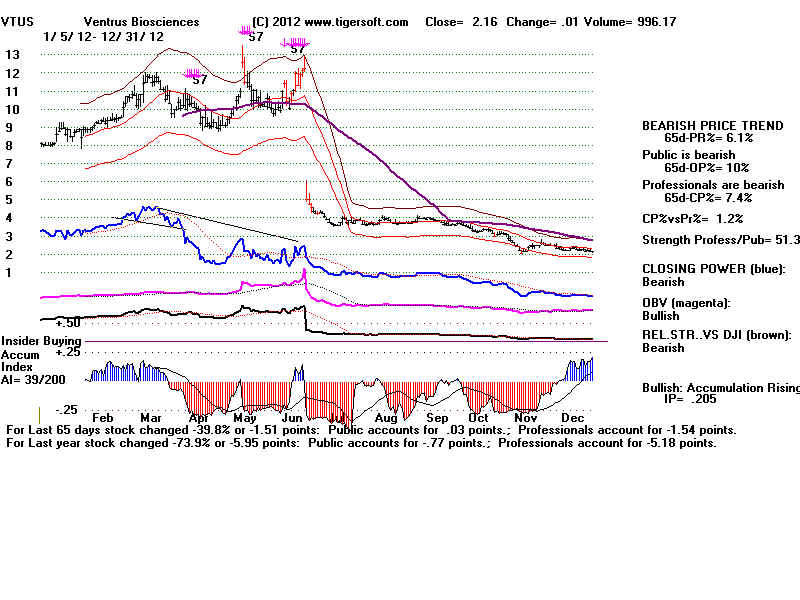
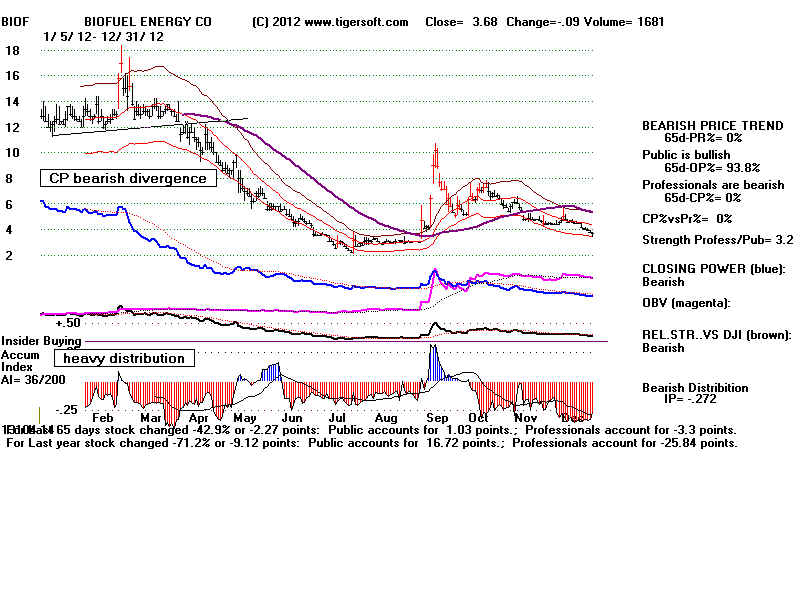
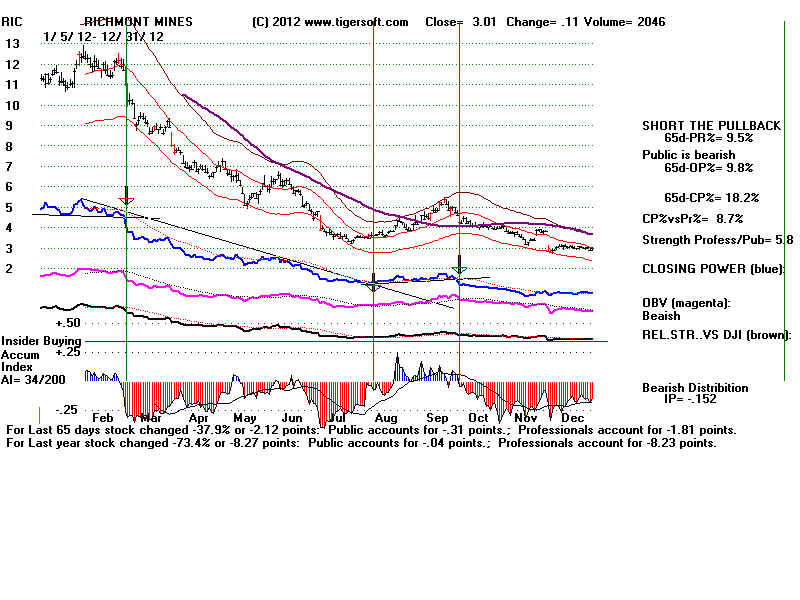
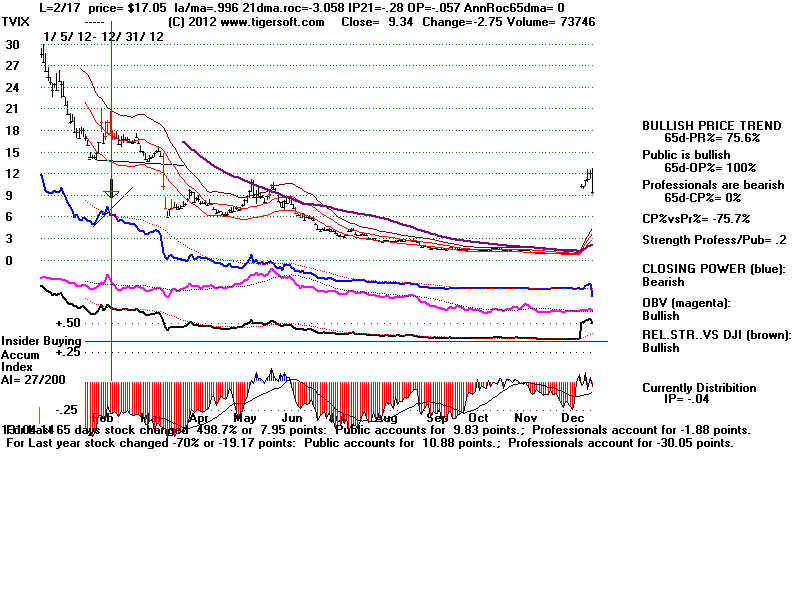
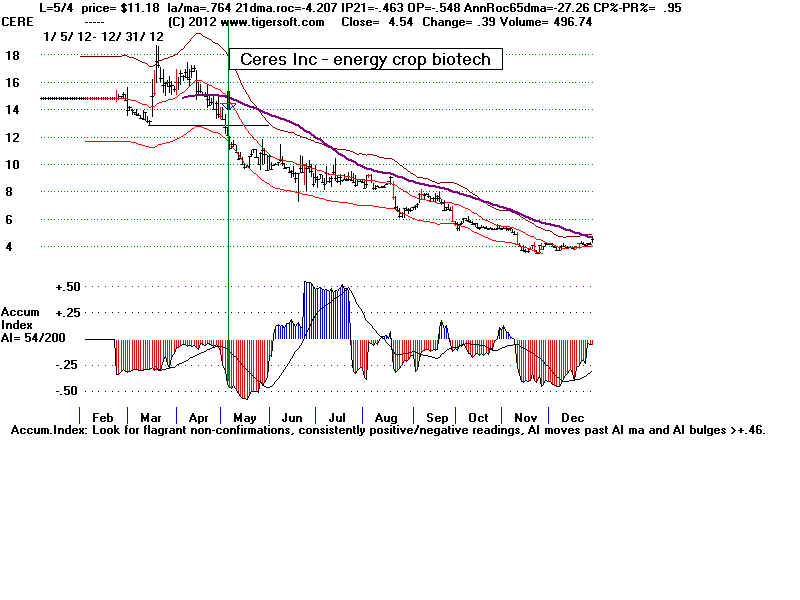
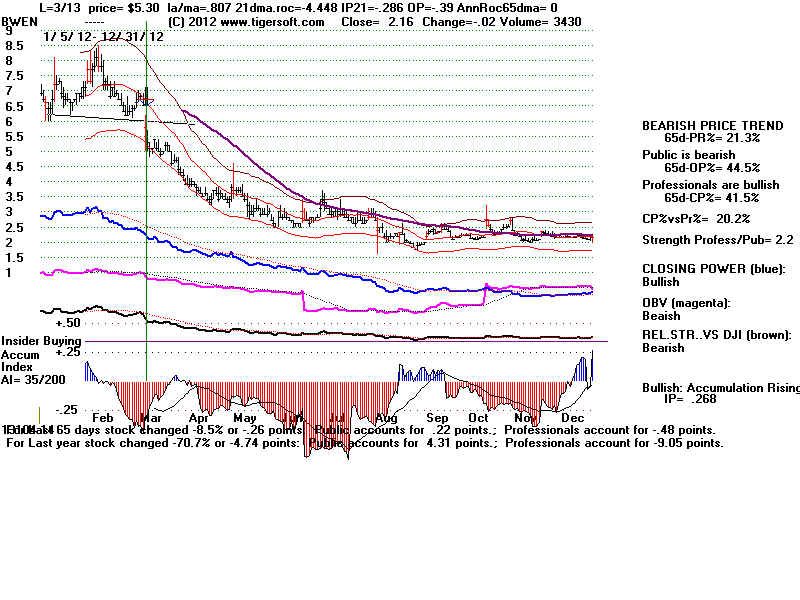
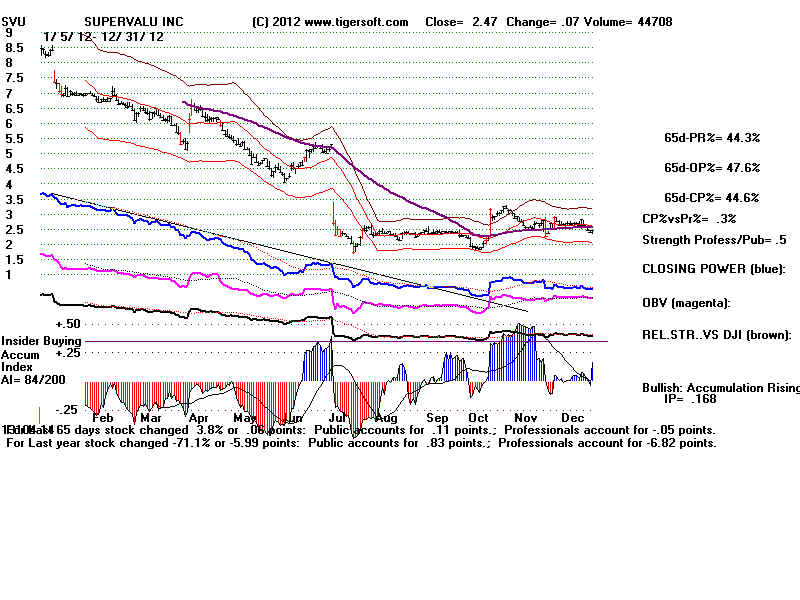
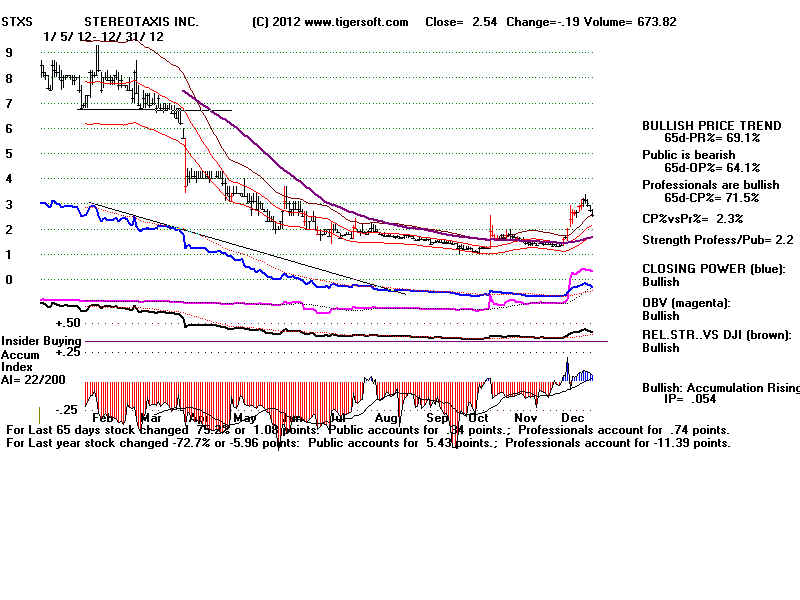
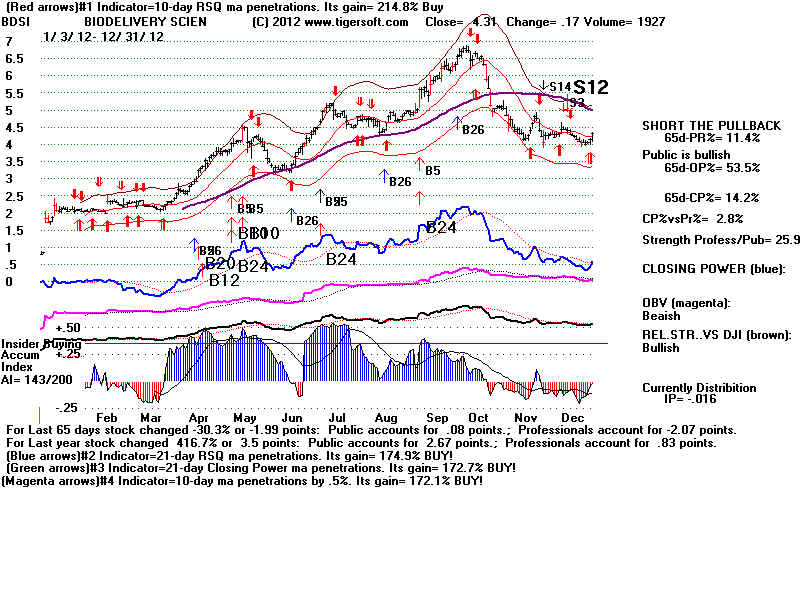
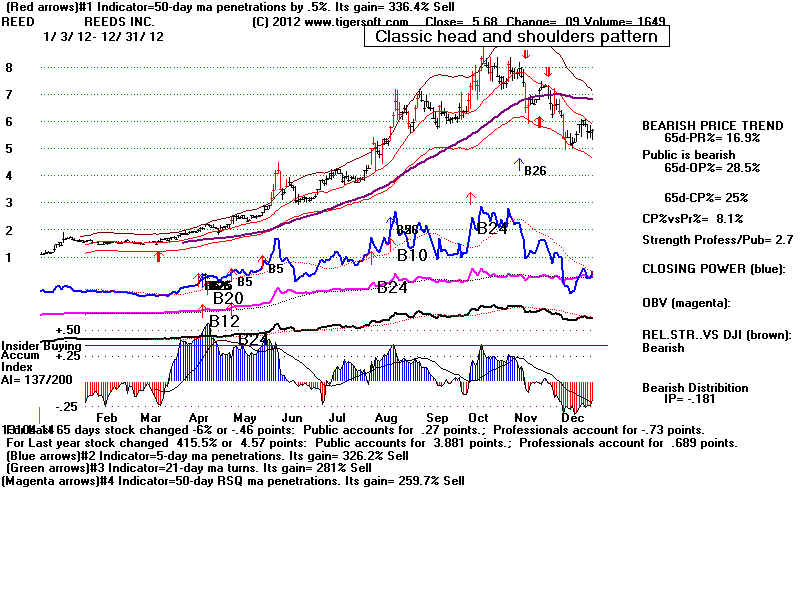
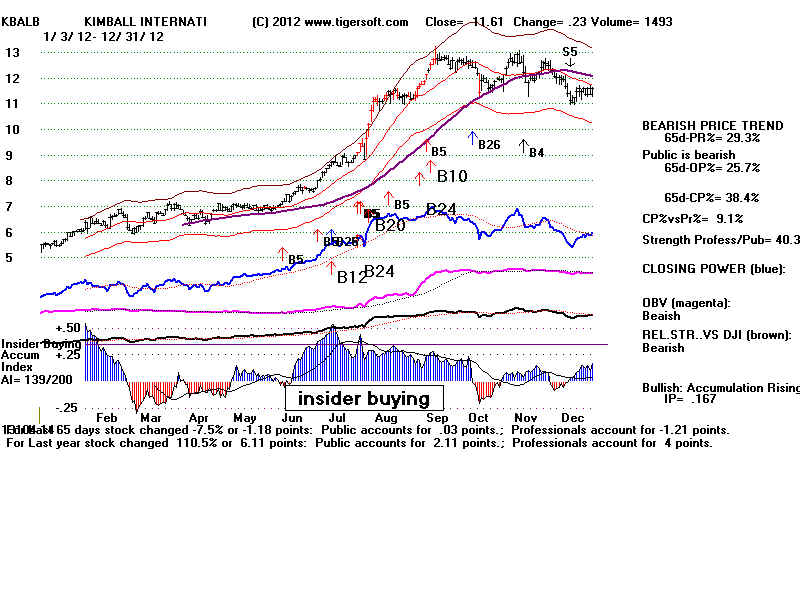
                    The Bearish Stocks show deep dips from Tiger's Accumulation Index.
                    This signifies massive Institutional Distribution and Informed Insider Selling.

                2) The Bullish Stocks show rising Professional Closing Power, zig-zagging higher.
                     The Bearish Stocks show very weak Professional Closing Power, zig-zagging lower.
                     In conjunction with Insider Buying or Selling, Professionals are seldom wrong!

                3) The Bullish Stocks show upside breakouts.
                    The Bearish Stocks show downside breakdowns.

                4.) Tiger's Relative Strength Quotient is strong and zig-zagging upwards in the Bullish Stocks.
                     Tiger's Relative Strength Quotient is weak and zig-zagging lower in the Bearish Stocks.

                The best stocks of 2012.  16 stocks up more than 250%.
                                    HOVNP   + 750%
                                    GV + 651%
                                    SNFCA   + 477%
                                    CPSS + 476%
                                    BDSI + 432%

                                    REED    +411
                                    CLSN   + 376%
                                    ARNA   + 369%
                                    PGTI + 332%
                                    MSON   +324%

                                    ACAD   +318%
                                    WSBF + 306%
                                    HW + 292%
                                    PCYC   +284%
                                    BONT + 282%

                                    PATK + 261%

                The 53 worst stocks of 2012.    Down 50% or more (and over $5 at start of year.)

                                    HUSA -99%
                                    OTT -91%
                                    SCMR -88%
                                    RSH -79%
                                    GRPN -77%

                                    VTUS -73%
                                    BIOF -73%
                                    RIC -73%
                                    WHX -73%
                                    TVIX -71%

                                    CERE -70%
                                    BWEN -70%
                                    SVU -70%
                                    STXS -69%
                                    NIHD -67%

                                    DOM -65%
                                   REDF -63%
                                   WBMD -62%
                                   VLCCF -62%
                                   CACH -61%

                                   HGT -61%
                                   NSIT -60%
                                   NCTY -59%
                                   YPF -59%
                                   BPAX -58%

                                  DM -58%
                                  KWK -58%
                                  CECO -56%
                                  DHT -56%
                                  KEG -56%

                                  MITK -56%
                                  USAK -56%
                                 MAKO -55%
                                 OXGN -55%
                                 BBW -54%

                                 SBLK -54%
                                 XRM -54%
                                 BEB -53%
                                 BPI -53%
                                 ANR -53%

                                TRMD -53%
                                MTR -54%
                                CEL -52%
                                BBG -51%
                                ABFS -51%

                                FST -51%
                                BBY -50%
                                ACI -50%
                                AH -50%
                                DRCO -50%

                                GBK -50%
                                MXWL -50%
                                MRVL -50%

         
         Contrast the best and worst performing stocks below, as we do, and see
         how reliably profitable TigerSoft can make your trading.

The Best Stocks of  2012
HOVNP.BMP (1080054 bytes)
SNFCA.BMP (1920054 bytes)
CPSS.BMP (1920054 bytes)
BDSI.BMP (1920054 bytes)
REED.BMP (1920054 bytes)
PGTI.BMP (1920054 bytes)
MSON.BMP (1920054 bytes)
KBALB.BMP (1920054 bytes)
LOV.BMP (1920054 bytes)
LTON.BMP (1920054 bytes)
EXH.BMP (1920054 bytes)
SNTS.BMP (1920054 bytes)
SPNC.BMP (1920054 bytes)
BONT.BMP (1920054 bytes)
HW.BMP (1920054 bytes)
WSBF.BMP (1920054 bytes)
The Worst Stocks of   2012
HUSA.BMP (1920054 bytes)
SCMR.BMP (1920054 bytes)
RSH.BMP (1920054 bytes)
GRPN.BMP (1920054 bytes)
VTUS.BMP (1920054 bytes)
BIOF.BMP (1920054 bytes)
RIC.BMP (1920054 bytes)
TVIX.BMP (1920054 bytes)
CERE.BMP (1920054 bytes)
BWEN.BMP (1920054 bytes)
SVU.BMP (1920054 bytes)
STXS.BMP (1920054 bytes)