Supplemental Instructions
We Recommend The Nightly HOTLINE.
(C) 2012 www.tigersoft.com
First go to http://www.tigersoft.com/ins2009/ for Basic Instructions.
You will see the links for starting off.
Starting Off with TigerSoft
On-Line Instructions for TigerSoft's Automatic Buys and Sell.
Signals: Peerless, TigerSoft Optimized and TigerSoft Fixed Rule
Trend Changes, 65-dma and TigerSoft Fixed Rule Buys and Sells.
Trading Closing Power Trend-Changes
Supplemental Instructions
Not mentioned there, are the references to Dial Data and a password etc.
as you start off. When you first start, there is a now outdated introduction
that asks you for your Dial Data password. Enter any codes you want,
as these do not apply unless you wish to use Dial Data, which you can,
but costs $50 a month and needs Symantec's Procomm for Windows.
Instead use our data. We have sent you a data link - for example, as of
10/31/2009, it is www.tigersoft.com/55111 Go to this page and Open
and Execute the data you want.
We recommend always downloading DATA.exe (which will send a wide
assortment of the biggest stocks, ETFs, Gold (GLD and GO1620),
Silver (SLV and SV1620) and Oil ( CL1620 and USO) to your drive c:\
We suggest downloading DJI30.exe and NASD-100.exe This will send the
data for the stocks in these groups to c:\DJI-30 and c:\NASD-100
Other stocks' groups may be downloaded as desired. You will see the
groupings on the Tiger Data page.
Peercomm Page:
You will want to get familiar with the Peercomm Page,
It has 8 buttons and is the starting off point for TigerSoft.
Here are the buttons:
| SELECT or SELECT
FOLDER USE THIS to pick which group of downloaded stocks you want to use. |
Charts - 2008/2012
USE THIS to produce graphs with Buys and Sells |
| DD Update or Update Use only if you have a Dial Data account. |
Older Charting DO NOT USE THIS Not needed for most purposes. |
| DD Add Tiger Use only if you have a Dial Data account. |
Internet USE
THIS Designate an internet address and go there within Tiger. Use for getting to Tiger Data page. This will prevent icons for data downloads on your computer's desk-top. |
| Analyze/Rank Use only if you have the Tiger Power Ranker |
Edit USE
THIS Edit bad data. But advise us, because the next day's data will have same error unless we fix it, too. |
MAIN TIGERSOFT PAGE:
GETTING BASIC TIGERSOFT CHART
If you Start with Peercomm and click the upper button on the right, Charts -
2008/2009
you come to the main TIGER MENU. You will have to do some exploring.
With the Basic TigerSoft program, click "Daily Stocks", the fifth
button down from the
top next to the Tiger menacing the Bull and Bear.
On the left Side are the stocks in this directory that may be graphed.
(If you
don't see what you want, go back to Peercomm and Select a different
Tiger Directory or go back to the TigerSoft Data page and download a new
data group or new groups.)
In the middle of the page, choose Allstks or any of the flags created by
running the Power-Ranker. If you do not have the Tiger-Power-Ranker,
pick a stock and graph it. You will get a graph that looks like this if
you have followed the instructions here - Starting Off with
TigerSoft
If you folow the
instructions, the graph can be sized to fit your monitor.
After placing a graph on the screen, use the pull-down menu, HELP,
on the upper right. Read these, especially the one that helps you see how
to evaluate a stock already owned. Our www.tigersoft.com page will
help you a lot. You may also want to order our books on Explosive
Super Stocks, Killer Short Selling Techniques and Longer-Term Investing
with The Highest Accumulation Blue Chips. Each is $75 plus shipping.
On-Line Instructions for TigerSoft's Automatic Buys and Sell.
Signals: Peerless, TigerSoft Optimized and TigerSoft Fixed Rule
Trend Changes, 65-dma and TigerSoft Fixed Rule Buys and Sells.
Trading Closing Power Trend-Changes
If you do not have Peerless, you can still catch the swings the market makes
and be in a position thereby for when it makes a sustained run. There will
be minor whip-saws, but do your best to be in position to catch a sustained
move. Looking at the internals of major market ETFs will work satisfactorily.
Our Hotline always looks at DIA (for DJI-30), SPY (for SP-500), QQQQ (for
NASDAQ-100) and IWM (for Russell 2000). Consider the broad Russell 2000,
now. It measures the broad market and has the greatest volatility of these.
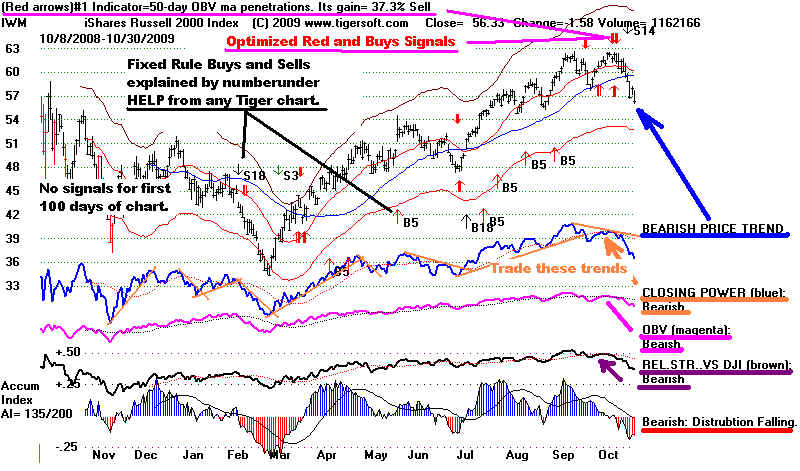
IWM
Note the direction of the Optimized system. Understand its powers and
limits by reading what we have wiritten about it.
Read On-Line Instructions for TigerSoft's Automatic Buys and Sell.
Note the fixed-rule Buys and Sells produced by the signals that take into
account of the direction of the 50-day ma. With a chart on the screen
use the pull-down menu under INDIC-3 and choose the option that"
shows the Signals Compatible with the 65-day ma.
Read Signals: Peerless, TigerSoft Optimized and TigerSoft Fixed Rule
Confirmed Breakings of the (blue) 50-day ma and 65-day ma are Buys and Sells
when prices have gone to an extreme.
Read Trend Changes, 65-dma and TigerSoft Fixed Rule Buys and Sells.
Note the internal strength readings and comments to the right side of
the chart.
Trade the trends of the Closing Power.
Read Trading Closing Power Trend-Changes
PEERLESS BUYS and SELLS
We recommend using Peerless Stock Market Timing to judge the
trend of the general market. That will also tell you the likely direction
of your stock, because most stocks rise and fall with the general market.
Here is the current Peerless chart of 10/30/2009. You can see the most
recent signal is a Sell. We do a Hotline each night, to tell users and subscribers
what we take to be the direction of the market and where it is apt to go
on an intermediate-term basis. It shows the current chart and then gives
the perspective we have on the market after considering Peerless, TigerSoft,
chart patterns, historical parallels, seasonality and internal strength indicators.
The Hotline also makes occasional specific recommendations.
Major Sell S12
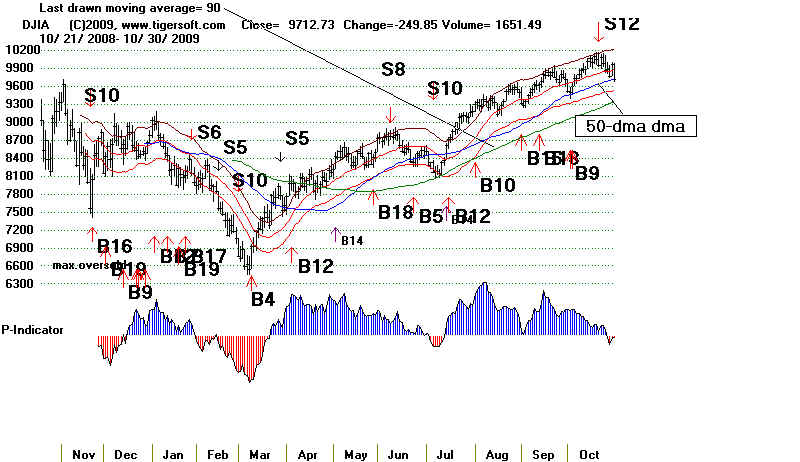
Above is the current Peerless chart, 10/30/2009, and below are recent Hotline
comments and recommendations to show you how we judge the market
as of this date.
TigerSoft and Peerless Daily Hotline
10/29/2009
===> Order form to Renew On-Line, "Nightly Peerless/TigerSoft Hotline " ($298/Year)

10/29/2009 Sell S12 Operating. Only A Technical Bounce.
QQQQ Is Still below Resistance of Its 21-Day.
I probably should have awaited for the DJI and QQQQ to break their 50-day ma
before becoming to Haloweenish last night. The fact is that though volume has been weak and
the S12 shows distribution, breadth has been constructive, There was no Sell S9 signal.
And it is possible if the P-Indicator does not deteriorate much, we may get a Buy B9 in a week
or two. None can occur for two weeks after a Sell S12.
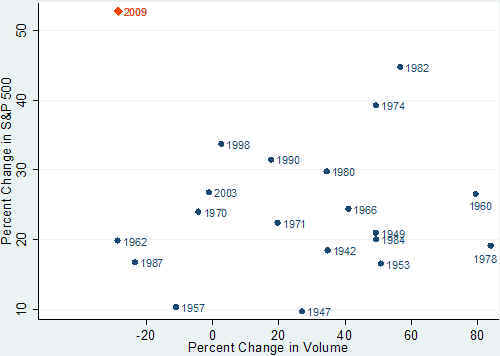
I came across an interetsing chart today. It shows that the 6 month advance in
the DJI is the highest of any new bull market on the lowest and most negative volume.
Breadth has saved the rally thus far. Perhaps, it will still. The shallower uptrend
of the NYSE has not yet been violated. The creator of the chart below states that
"if you think of volume as fuel for any sustainable market rally, then we’ve been
running on fumes for a few months."
6 Month Gain and 6 Month Change in Volume
The DJI rebounded 100 today as it
turned up from a little above its rising 50-day ma.
The ratio yesterday of NYSE advances to declines was 1 to 9.
Today's ratio was 4.8 to 1.
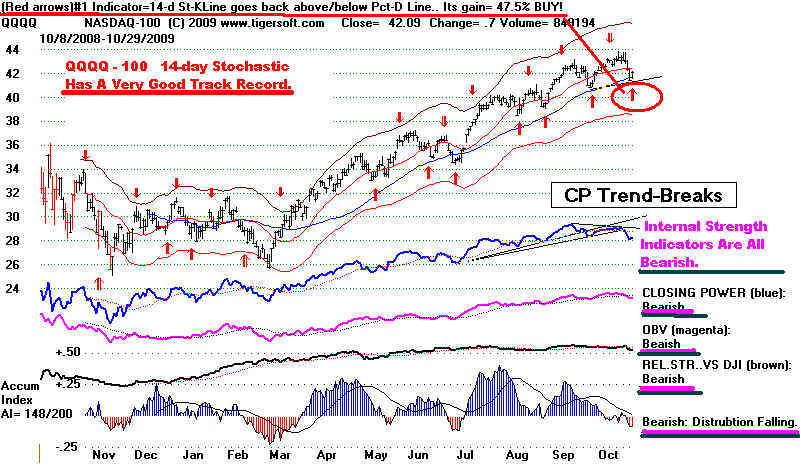
Volume was lower than yesterday. The QQQQ (chart below) was
typical of the long general market
ETFs. After four staight down days, it rose today and gave
a red optimized Stochastic Buy based
on the short-term 14-day Stochastic. The bounce occurred
just where one might look for
one, up from the rising 50-day ma. How far will it advance.
It is still below the resistance
of its now flat red 21-day ma. Most important, all
its key internals are rated "negative' by
the Tiger program. I
QQQQ Internals:
1. The Blue Closing Power is below its falling
21-day ma.
2. The Magenta OBV is below its falling 21-day
ma.
3. The Brown Relative Strength Quotient is
below its falling 21-day ma.
4. The Accumulation Index is Red (negative) and
below its fall 21-dma.
5. The Tiger Dat Traders' Tool is below its
falling 21-dma.
Gold (GLD) rembounded from
the 100 breakout point. The Dollar Fell back from its falling 50-day ma
I would say GLD is at a good buy point again. See the chart
below.
DJI rebounds like we saw
today (10/29/2009) from a rising 50-day ma are normal.
But they do not mean a
big recovery. Below are the historical cases most resembling
the current S12. I have posted in immediately below what the DJI did after the S12
upon
first reaching the rising 50-day ma. Brief bounces do occur. But they
are meaningless
from an intermediate-term perspective because the lower band was always soon hit.
10/28/200 Sell S12 Operating. Bankers' Pump and Dump.
The lower band at 9500 is the first
downside target for the DJIA. Today's DOW closing
below the support of its 21-day ma
invites such a test after the SELL S12. As I showed
yesterday, a deeper decline is more
typical after a bull market S12 with negative OPCT
readings on the last peak.
Confirming that prognosis, the DJI fell 120 today and the rest
of the market dropped even harder.
Downside volume on the NYSE was 10 times
Upside volume. It's been six months
since the number of NYSE advancers was this
low. The number of new lows on the
NYSE was only 11 and on the NASDAQ was only 33.
So, at this stage, what is happening is
that a great many stocks are viciously and quickly
breaking down below their 50-day ma.
They are slicing through this usual support as though
it was non-existent. And, in fact,
it may not be. That is what happens in a classic "pump and
dump". The stock is mostly
dumped on the way down to investors who think that they
are gtting a bargain.
Dumping like this is dangerous.
It reminds me of the classic "Pump and Dump" manipulation.
This time it is being done by the
likes of Goldman Sachs. JP Mortgan and Bank of America.
So, not only did these banks
"steal" (in my opinion, that is the only word that applies) trillions
from the general public with the
help of Paulson, Geitner and Bernanke, now they are
dumping the over-priced stocks they
recklessly bid up onto the very same people who bailed them
out. What gratitude! No
wonder Glass-Steagall forbad commercial banks for 80 uears from
being investment banks and
brokerages. If I am right, when the whole story comes out about
this "Bankers' Pump and
Dump", buy the stock in the company that makes pitch-forks!
 Reading about Pump, Dump and Bankers:
Coming
Soon: More Scandals. Dec. 1, 2005
Criminal Environment Is Created by US Government
Jan. 12, 2005.
Does
Goldman Manipulate The Stock Market?
About that stock
manipulation software Goldman Sachs owns ...
Manipulation
is rife on stock markets « melange
Goldman
Sachs Market Manipulation Dominance at Risk by Theft

THE RISKS OF HOLDING SEEM QUITE HIGH
Technically, the rapid falling below the
50-day ma on very high volume is a clear warning.
Normally, it can be taken as just a
warning unless the stock's Accumulation
Index readings are negative. Then
it must be taken as a SELL, especially when
market conditions look artificial and
over-extended, as now. I think the low volume rallies
and the NYSE own statistics show that the
advance has been pushed up artificially by
banks with public funds. But just
given how far the market has risen, how there has not
been a double-bottom and the history of
the type of Sell S12s we just had, I believe such breaks
in particular stocks make then necessary
and reasonable Sells. There is too much risk not to sell.
A closing below their 65-day ma is more
emphatically a Sell. Use that if you want to be surer.
I think that is what is coming.
If selling is too hard emotionally to do or because you want profits to be
postponed for tax
purposes, then buy some of the leveraged
ETF puts I mentioned last night. This is the approach
I have taken on our Stocks' Hotline.
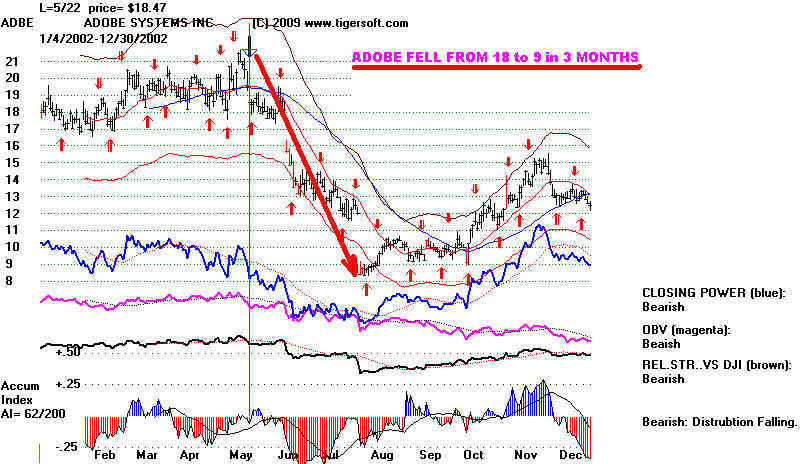
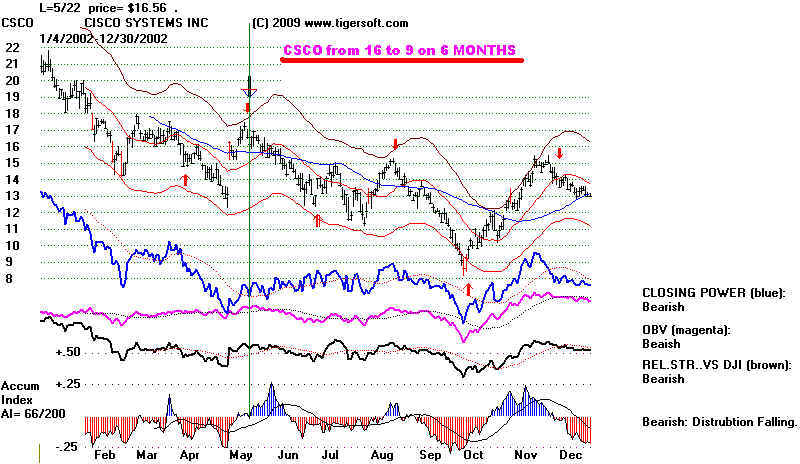
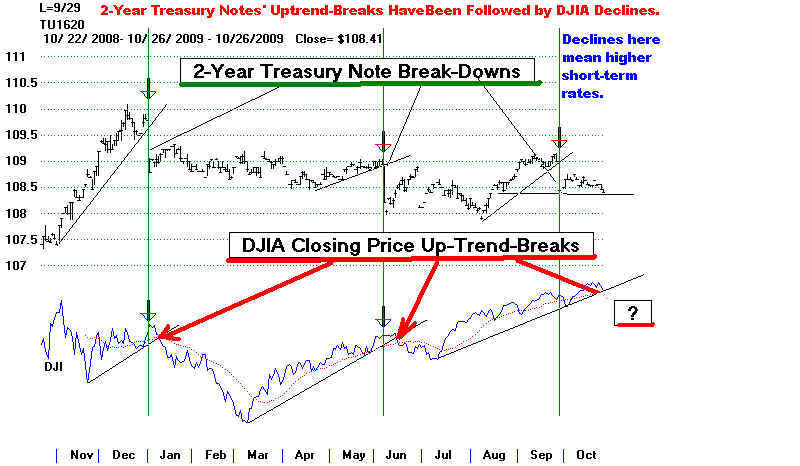
I want to show some typical NASDAQ-100
stocks back in 2002 after the 7 month's uptrending
A/D Line then was broken. See how
quickly these stocks caved in when the NYSE Advance-
Decline-Line was broken then. So
far, only the steeper Advance-Decline Line has been broken.
But with prices and the A/D Line up so
much and so over-extended, it is usually best to employ
the steeper uptrend.
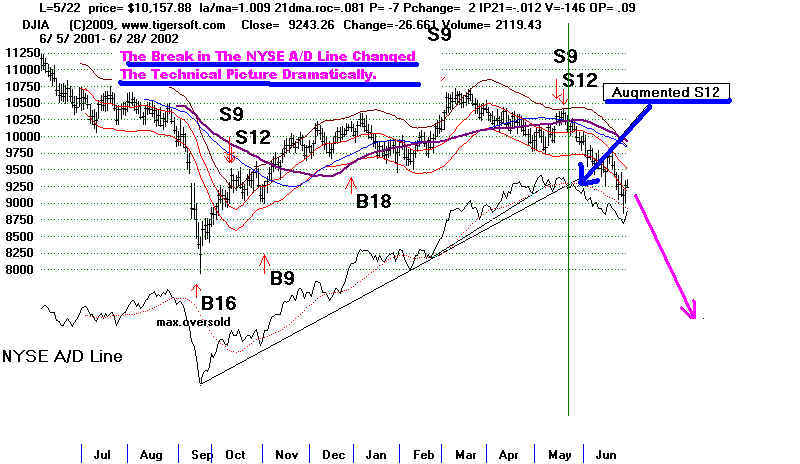
FIRST, NOTE HOW THE BREAK IN THE A/D LINE UPTREND ON 5/22/2002
CHNAGED THE TECHNICAL PICTURE OF THE MARKET DRAMATICALLY.

SECOND,
SEE HOW THESE STOCKS COLLAPSED AFTER 5/22/2002.
Not shown here, QQQQ
fell from 31.40 to a low of 20 five months later.
AAPLE fell from 12 to 7 in 3-4 MONTHS
ADOBE FELL FROM 18 to 9...
CSCO FELL FROM 16 to 9.


10/27/200 Sell S12 Operating.
The Peerless Current Sell S12 is made more bearish by the fact that as the
Sell S12 was occurring, the OPCT was
negative. Since 1928, there have only been six cases
of an independent Sell S12 with a
negative OPCT while the DJI had been in a sustained
uptrend and was above a rising 65-day ma.
The average decline was 12.7%. If you are
bullish still, it is important that the
DJI now NOT drop below the lower 3.5%-4.0% lower
band. We can hope that the
bullish period after the third week of November prevents a
bigger decline, for the sake of all those
that are already jobless.
The research I did tonight on the HOTLINE suggests a 13% decline in the DJI if past
volatility applies. This past year's
volatility has been twice to three times greater. We do not want
to be in stocks that will eventually sell
off as confidence erodes. In additon to selling thinner
stocks that have run up a long ways, look
at the ETFs that allow aggressive leveraged short
selling, Two criteria can be used:
1) high levels of Accumulation and 2) the surpassing the 50-day
ma. TigerSoft Data permits
downloading the large number of leveraged short ETFs.
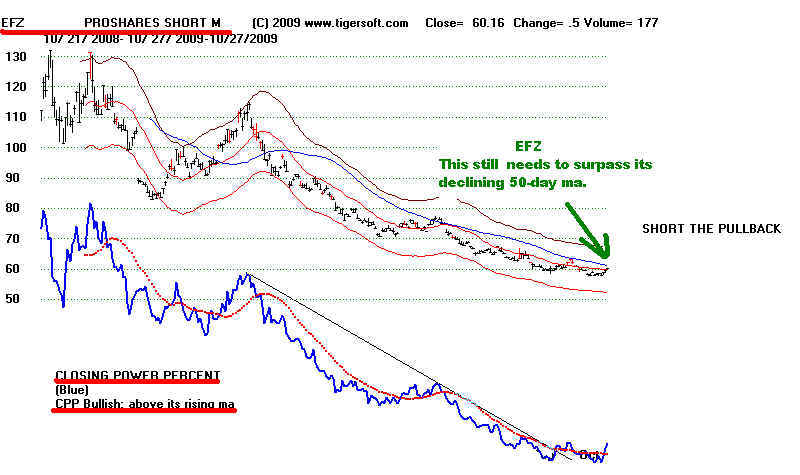
Here are the ones that look the most
interesting as purchases, either to hedge portfolios
or to be aggressively short: RWM
47.86, SBB 42.37, EFZ 60.16 - IP21= + .34 and
EWV 52.74 and SSG 24.28
Parallel SELL S12s' Statistics
Cases since 1928 Most Resembling Current Sell S12 with negative OPCT.
.
Formula: (On-Balance-Volume Pct = 21 days' OBV/Volume for 21 days)
Cases Most Resembling Current S12 with negative OPCT.
Here they are: Outcome:
1. 8/24/38 143.50 Fell immediately, reaching 129.90 below lower band a month later. OP= -.174
10% decline.
2. 7/11/1968 922.82 Fell immediately, reaching 870.37 and lower band 3 weeks later. OP= -.008
10% decline.
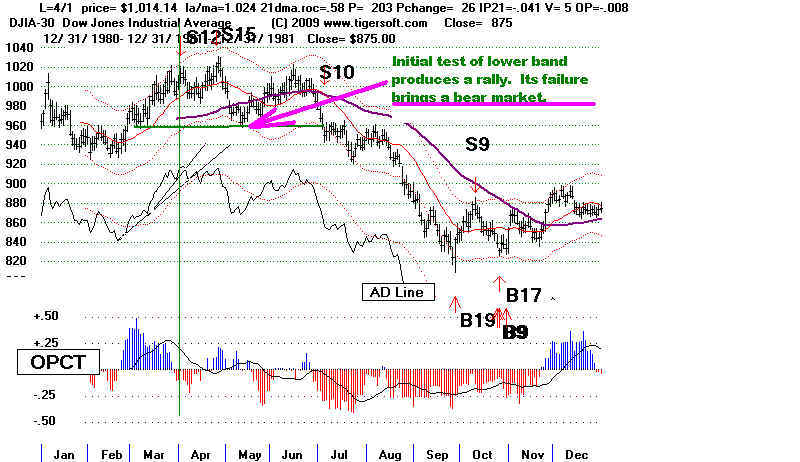
3. 4/1/1981 1014.14 Rose to 1024.05 and fell to the lower band in a month, 963.33 -.052
This started the 1981-1982 bear market.
20% decline.
4. 1/6/1983 1070.92 Rose to 1083.79 and fell to the lower band in 3 weeks, 1030.17 -.134
6% decline.
5. 1/6/1984 1286.64 Immediately declined below lower band to 1134.63 on 2/23/1984 OP= -.154
16% decline.
6. 12/8/2000 10712.91 Fell immediately to lower band, 10487.29, on 12/21/2000
and then below lower band to 9389.48, on 3/22/2000 OP= -.156
14% decline.
Rallies after, and paper losses from, these Sell S12s occurred only in 2 of the 6 cases
and were by less than 1.5%. In these cases, no clinching is needed apparently. What
is more to the point now is that in 5 of 6 cases the DJI eventually fell substantially
below the lower band. The lower band support is very important. You can see this
in the 1981 chart below.
1981 Sell S12
Completed S12 Statistics: 1928-2009
Rising Markets:(above 65-dma): S12s with
no Near-By S4,S6, S9
------------------------------------------------------------------------------------
6/12/35 117.1
Reversal loss -8.7% OP= +.072
Avoided using A/D Line trend-break clinching.
6/24/35 120.
Reversal loss -6.1% OP= +.067 Avoided using A/D
Line trend-break clinching.
7/27/38 140.20
fell directly to 136.90 and lower band. OP= +.014
8/5/38
144.50 fell directly to
136.90 and lower band. OP= +.028
1. 8/24/38
143.50 Fell
immediately, reaching 129.90 below lower band a month later. OP= -.174
3/16/1967 868.49
fell directly to 842.43 .025 lower band in 3
weeks. OP= +.017
4/21/1967 883.18
Rallied to 899.89 and fell below lower band in a month,
899.89. OP= +.179
9/14/1967 929.44 Rallied to
937.18 and fell below lower band in 6 weeks to
850. OP= +.109
1/9/1968 908.29
Rallied to 900.24 and fell below
lower band in 19 weeks to 825. OP= +.158
2. 7/11/1968
922.82 Fell immediately, reaching 870.37 and
lower band 3 weeks later. OP= -.008
10/21/1975 846.82 Rallied
to 860.67 and then fell slightly below lower band, 793.80, on
9/30/75 .OP= +.125
7/17/1978
839.05 Fell only to 21-dma immedately and
then rallied OP= +.051
9/11/1978 907.74
Declined to
lower band at 857.16 in 7 trading days and rallied OP= +.187
3. 4/1/1981
1014.14 Rose to
1024.05 and fell to the lower band in a month, 963.33 -.052
4.
1/6/1983 1070.92 Rose
to 1083.79 and fell to the lower band in 3 weeks, 1030.17 -.134
5. 1/6/1984
1286.64 Immediately declined
below lower band to 1134.63 on 2/23/1984 OP= -.154
10/7/1997 8178.31 Immediately declined below lower band to 7161.15 on 10/27/1997 OP= +.118
6/18/1999 10855.55
DJI rallied to 11300 in 2 months before falling to 10019.71 on 10/15/1999
OP= +.046
7/17/2000 10804.27 Fell immediately to 10511.17 on 7/28/2000,
then rallied to 11259.87 on 9/7/2000 and
then fell to 9975.02 on 10/18/2000
OP= +.193 and OP= +.12 on 2nd S12 two days later.
6.
12/8/2000 10712.91 Fell immediately to
lower band, 10487.29, on 12/21/2000
and then to 9389.48, on 3/22/2000 OP= -.156
10/15/2009 10062.94 (Dial
Data corrected data) OP= -.07
10/21/2009 9949.36 (Dial Data
uncorrected data) OP= -.208
10/26/200 Sell S12Clinched... Be Wary of Trap-Door Declines.
We have an "Isolated Sell 12" in a
rising market. How bearish are these? We have to also
consider
the values of the OPct. At the time of the recent Sell S12 on 10/21/2009, the OPCT
was -.20.
and IP21=.004. It will take some effort to put all the data together. This
will appear
in the next
day. Early returns suggest the S12 and a negative Opct are a reliably bearish
combination. While there is always a chance for a recovery now that the DJI
is back to its
21-day ma,
S12s usually produce deeper declines, especially when the volume indicators
are
bearish, too.
Watch the Dollar.
If it rises and breaks its downtrend, it probably means that the FED will
raise
interest rates a point or two. Banks might then sell the stocks they speculated with
so cheaply
at tax payer expense, rather than make loans. Such expectations go a long way
in
explaining the mix of profit-taking, shorting and the the faltering breadth on the NYSE.
The same
message is being signalled by the way some gold and silver stocks now show
unusually
high distribution and are now falling. See NEM and SSRI. There was a
reason
they could
not make new highs when the Gold
ETF did. If a stock can't make a new high
with
such background fan-fare, it usually has to decline to recharge. I remind you that
advances
by gold are very often followed by a swooning stock market.
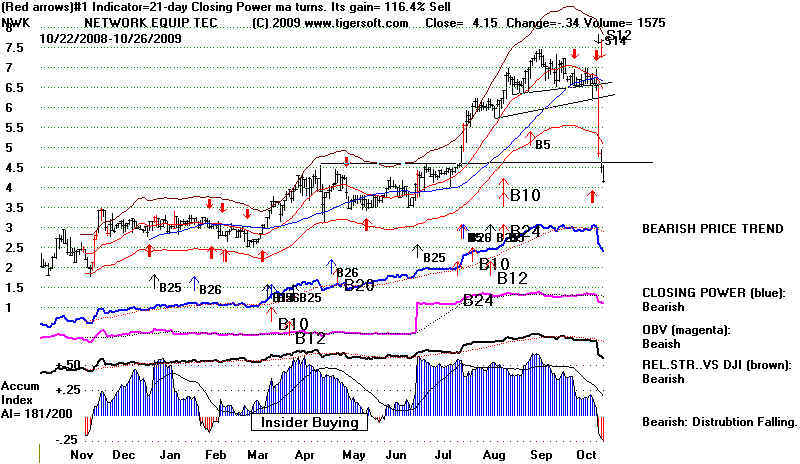
Another
thing to watch is how well stocks that show a lot of Blue Accumulation
do as their
prices fall to the key 50-day ma. If many of these stocks sell off like
NWK just did, wouldn't this
suggest that big money is very skittish. And that would
not be a
good sign. They probably fear that a deeper retest of the lows will be needed.
Indeed,
"V" bottoms are relatively scarce.
Price Pot-Holes Point To Problems in The Market
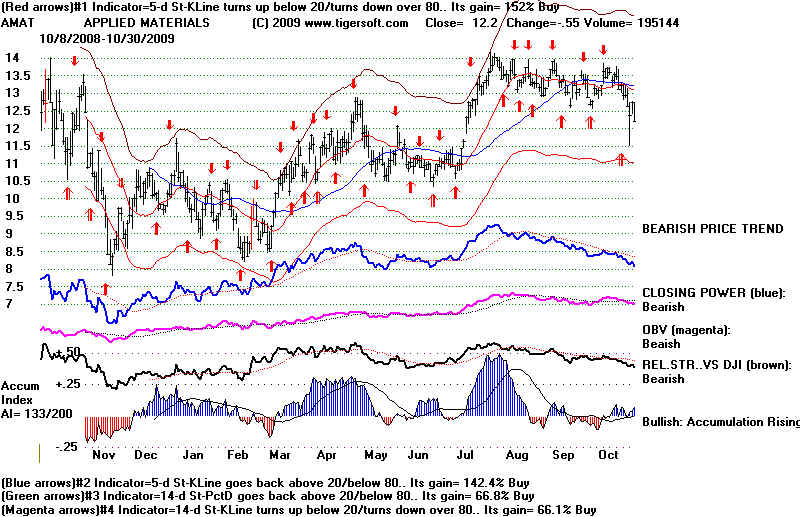
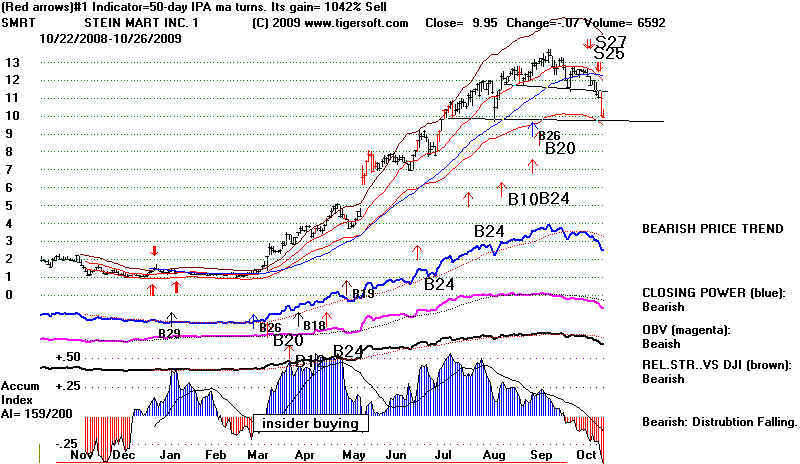
Serious Break Downs In High Accumulation Stocks Are Worrisome.
If these high
Accumulation stocks don't hold up, is big money getting nervous again.
Were these stocks
just pumped up only to be dumped on the unspuspecting public on the way down.
Here are some
high Accumulation stocks to watch that have broken their 50-day ma:
AMCS, ATRI, ATSI, BAMM, CAVM, CRED, MEDQ, SMRT
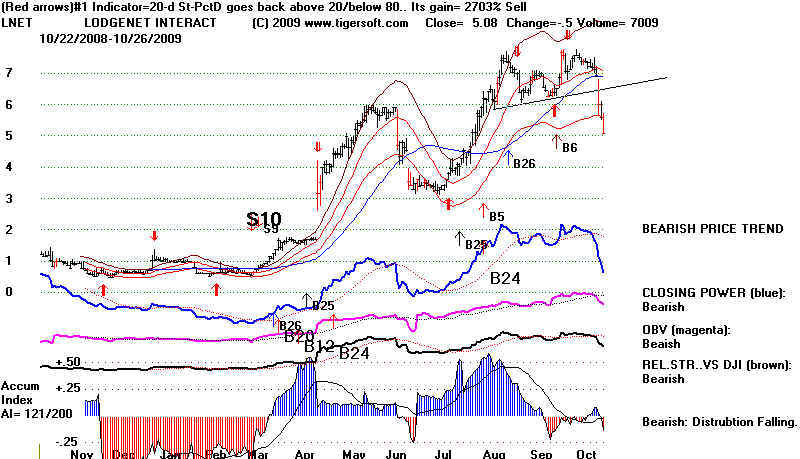
Some interesting
shorts are AAI, ARQL, ASFI, AYR, BAC, CAL. CSFG, LNET, SMRT

10/23/200
Sell S12 --- WATCH THE A/D LINE OF THE NYSE.
The excellent breadth has kept the 7 month 2009
rally going long beyond
where a simple
study of daily volume might have thought possible, so low was
the volume on
much of the rally since March.
But now we should
ask: "What will happen if the good breadth ends?"
The growing
investor optimism and the stock market's direction and apparent
safety may change
rather sharply. To see this, I suggest looking at the reversal
upon the
occurrence of a clinched Sell S12 in early 2002. The break in the long
NYSE A/D Line
uptrend was the light switch! That was also when interest rates were
kept artificially
low after the 9/11 attack. Of course, 2002 saw the run-up to a new war.
Had Bush,
Cheney or the CIA Director been of a different mind, my guess is the
2002 DJI decline
would have been much more shallow.
2002 Top and Clinched Sell S12.