wpe1AD.jpg (30340 bytes) 
             
TIGERSOFT TRADING SIGNALS
                      www.tigersoft.com
              
(C) 2010 William_Schmidt@hotmail.com
                                   
Last Updated - 7/12/2010

         
70% of the time the market is going sidewise, not up nor down
         in a decisive way.  Summers more than any other time of the year
         are when this is true.  At these times traders should use TigerSoft's"
         automatic Buys and Sells with the stocks our software finds to
         be the best for short-term trading.

              Our Trading manual shows you everything you need to know
         about how to find and trade such stocks, better than even those
         who own and run the compnay.    Certainly, much better than
         even the smartest engineers and sales people working for the
         firm.   Instead, your eyes will be opened.  You will see exactly
         how market professionals are rigging and trading these stocks.

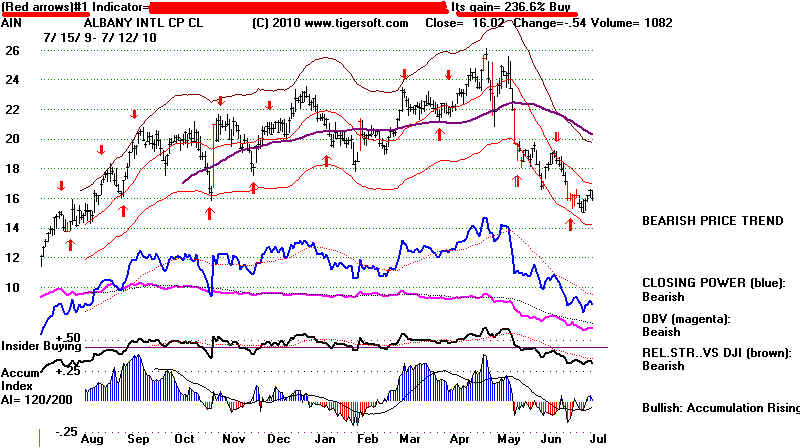
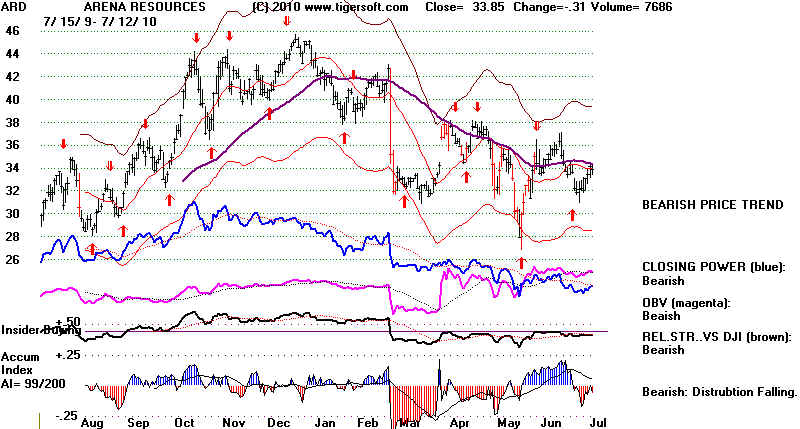
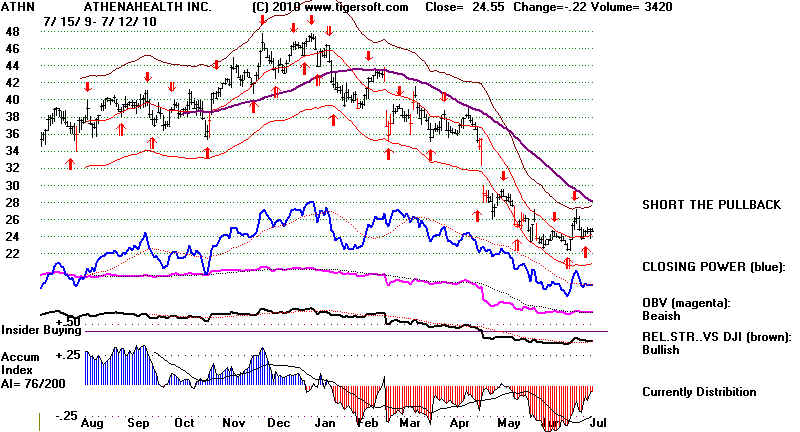
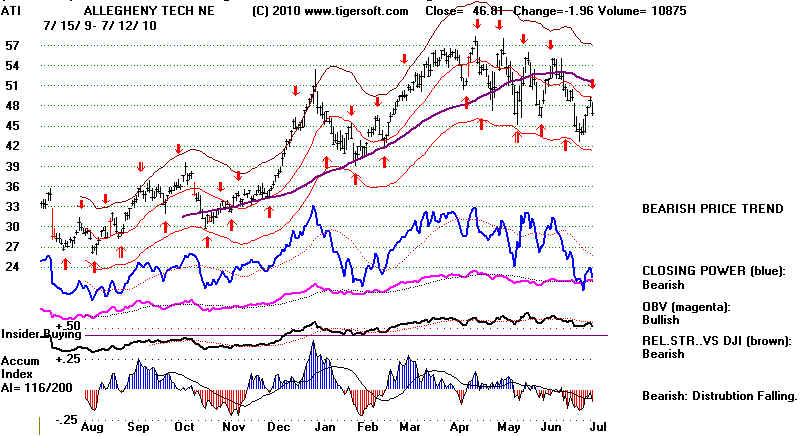
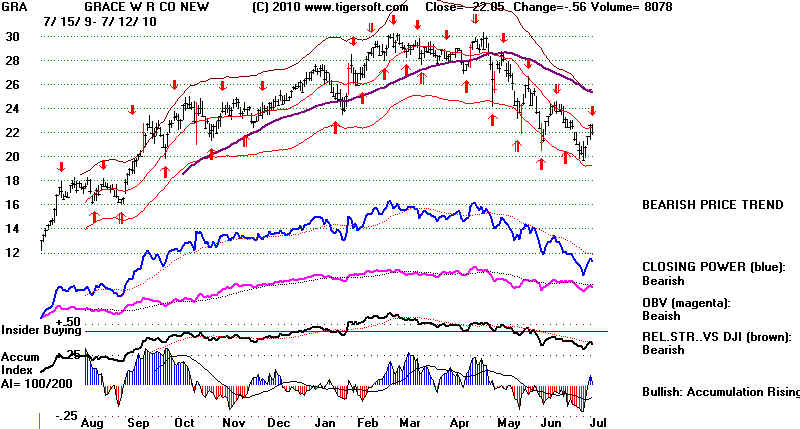
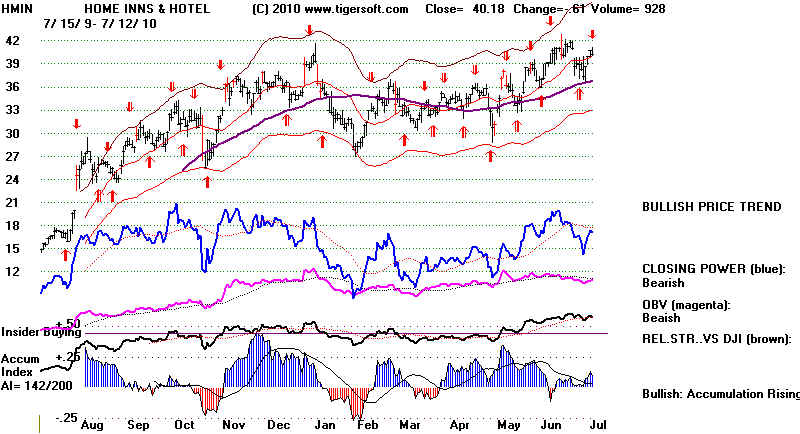
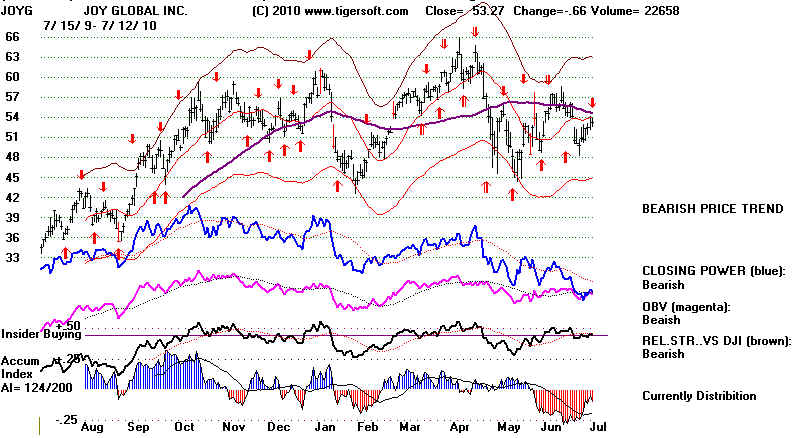
              The top row of every TigerSoft chart shows you the best system
          to use and what its track record has been for the last year.
          Tiger's Power Ranker flags the new red Buys and Sells.  The
          results assume $10,000 is invested initially and all subsequent
          red signals result in a Buy or a Sall with commissions being
          $20 pwe Buy or Sell.  You can also see what happens if the
          trades are all taken a the next day, as well as getting a list
          of the trades and outcome plus results showing the biggest
          paper losses and the number of winning and losing trades.
                         
               
Stock       2009-2010    Long         Long
                             Symbol         Trading          Trading    (Winning Trades
                                                    Gain                Gain          Losing Trades)
                              ---------------------------------------------------------------------------------------------

         7/12/2010   AIN                  +236%            +68%    (6 wins 1 loss)
                             ARD                +335%            +129%  (10 wins 0 losses)
                             ATHN              +253%            +51%   (11 wins 3 losses)
                             ATI                  +275%            +138% (11 wins 3 losses)
                             ATSG             +995%            +347% (6 wins 1 loss)
                             BDC               +215%            +78%  (13 wins 2 losses)
                             CAP               +257%            +130% (15 wins 4 losses)
                             ESL               +201%            +119% (13 wins 2 losses)
                             GRA               +206%            +107% (12 wins 3 losses)
                             HMIN             +226%            +97%   (10 wins 4 losses)
                             JOYG
             +204%            +94%    (13 wins 4 losses).


wpe1A1.jpg (71769 bytes)

wpe1A2.jpg (70643 bytes)

wpe1A3.jpg (72425 bytes)

wpe1A4.jpg (70802 bytes)

wpe1A5.jpg (65792 bytes)

wpe1A6.jpg (70673 bytes)

wpe1A7.jpg (69740 bytes)

wpe1A8.jpg (69294 bytes)

wpe1AA.jpg (68008 bytes)

wpe1AB.jpg (71813 bytes)

wpe1AC.jpg (72686 bytes)