 |
TigerSoft and Peerless Nightly Hotline (C) 2007 William Schmidt, Ph.D Book-Mark This Address 8/2/2007 Sell S9/S12 S9/S12. Fourth Test of 13200 Held. It will be safer to buy on fifth separate test. Below that is TROUBLE. ================== Peerless: 1928-1966 Track Record of Major Peerless Signals Earlier Peerless-DJIA charts 7 Paths To Making 25+%/Yr Using TigerSoft New - Tiger-Blog: Humor and Political Economy ---------> ALWAYS Refresh THIS PAGE <----------- New Study 5/15/2007 - WHAT PREDICTS STOCKS UP MORE THAN 40% IN LAST MONTH? |
Nightly
Hotline 8/2/2007
Peerless
Stock Market Timing and TigerSoft charts of key indices and stocks.
(C) 2007 William Schmidt, Ph.D
 |
Operative
Major signal(s) -
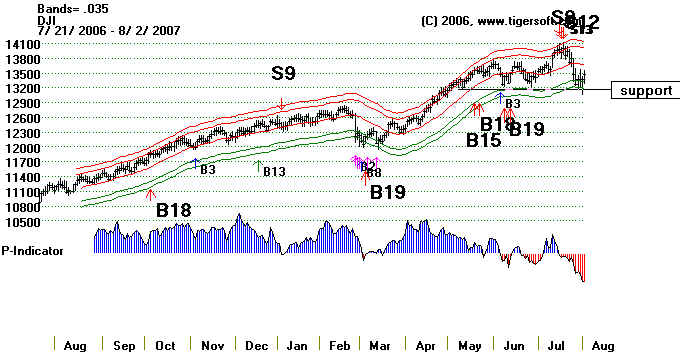
Sell S9 and Sell S12.
Most likely the DJI will move sidewise over the next few weeks, despite its
recent volatility. This
is because its price pattern shows an emerging head and
shoulders top. If the
right shoulder is symetrical to the left shoulder the
side-wise action could last
5-6 weeks and the price range would be between 13000
and 13650. Without a
major or even a minor buy signal, given a trading range mode,
it is hard to isue any Buy.
In addition, the 3-day smoothed P-Indicator is still falling.
We have used that in the past
to to distinguish when it is safe to buy again. A fifth
test may not hold. Look
at the Peerless charts of 1990 just below.
| Here are the
Peerless charts of 1990 for the DJI and NASDAQ. You will notice that the right shoulder in the head and shoulders pattern then after an S9 and S12 did not last as long as the left shoulder. The fifdth test of the neckline support gave way and then prices fell quickly and additional 15%. The NASDAQ's chart had shown positive readings from Tiger's Accumulation Index, but then gave way when the DJI's neckline-support failed. A 15% 3rd quarter decline after an S9/S12 also occurred in 1998. DJI-30 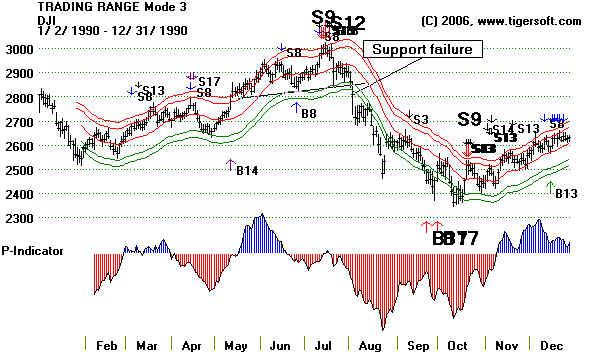 NASDAQ 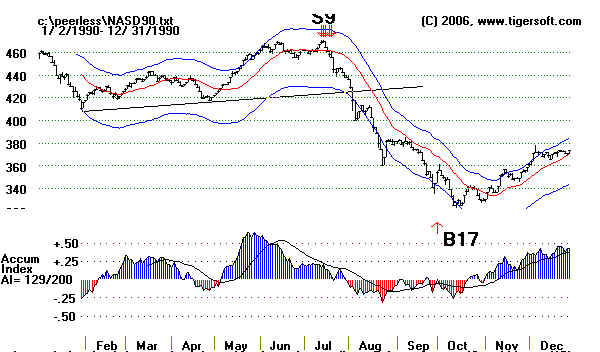 |
The S9/S12 is only the second cluster in 7 months on our Peerless charts. Until
there are 3 or more, it is
unlikely that a long bear market will occur. However, given
the profound weakness in
credit stocks ( which are the blood supply of the economy),
the pattern of years that end
in "7" to produce an average decline of 23% in the DJI
at some point during the year
and the amazing fact that the DJI has now gone 51 months
without a 10% correction.
Most likely, there will be a 10%-15% decline, back at
least to the March lows in
September or October.
For now the multinational DJI stocks are moving up within their trading range. Today
the DJI gained an even 100.
But the internal strength indicators all remain negative.
European markets have led the
rebound. But they were also down the most. It is
not at all clear where the
leadership will come for a drive to new highs. Too many
sectors were hit hard in the
decline. The Fidelity sector funds' performance shows this,
as well as that the weakness
in finance, banking and brokerage stocks was not reduced
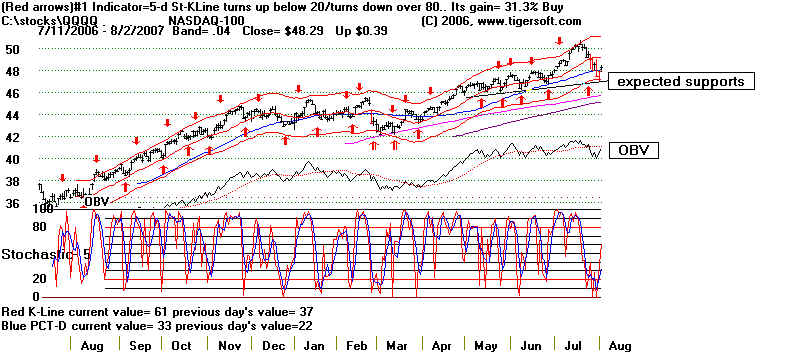
today. Watch the 5-day
Stochastic-L-Line for the QQQQ. It is on a Buy. Just using that
simple system would have
gained 31.3% since last August, all of it coming on the long side.
It now stands at a 61.
It will need to rise above 80 and then turn down to give a Sell. It
would be surprising to see
more of a rally than enough to get this system to give a Sell.
Immediately below is its
chart.
Watch QQQQ for next Red Sell.
The pivotal 13200 is important support. Below that are the prospects for another
10% to 15% decline.
Above that, a rally to the apex of the right shoulder is most likely.
It is very difficult to beat
traders at their own volatile game. The last 30 minutes
seem to be what they are all
waiting for.
After
an S9 it is best to shift back to trading range mode or bearish
mode if there have been 3 or
more earlier S9/S12 clusters in the last 6-8 months
without an intervening DJI decline
of more than 10%. Crude Oil finally fell back
and did not make a breakout past
80. That should give us hope that the decline has
more to do with the weak housing
market and bad financial credit problems affecting
the US. If so, there is a
hope that the global bull market will lift the US. That was not true
last night, when global markets
fell sharply. So, watch crude oil and foreign markets.
The US stock market seem to be
begging for Barnacke's Federal Reserve to be the "banker
of last resort" and bail out
certain over-extended financial institutions.
| Special: Longer Term Out Look Which US Sectors Are Apt To Be Best for Next 2 Years? 1. Hillary Clinton seems like the most likely President. New polls give her a more commanding lead. The type of health care reforms a Democratic Congress will opt for are far from clear now. But that's what will shape that arena. So, we will be alert to that. 2. I do have one system, the Tahiti system, that is longer term. The idea is to buy the stock in the DJI-30 that shows the most consistently positive accumulation. We buy and hold it for 21 months. That is the optimum holding period. So, looking at the the DJI-30 now in that way gives a good idea of which sector is best. Right now the top 3 are McDonald's - Food Industry ...By far the highest. DuPont - Chemicals Honeywell - ? 3. Usually, we wait and see what industry holds up best in the 3rd quarter, when a market slide is common. That group is often then the leader in the next advance thew following year. Next Year Next year - Markets usually do not go into big declines, bear markets, during a Presidential Election year. The Fed does not want to rock the boat. Then more often than not, there is an advance when a Democrat takes over from a Republican. Republicans winning the White House can hurt the market in the first year of power: Repubs taking over from Dems. Nixon - 1969-1970 Bear Market Reagan - 1981-1982 Bear Market GW Bush - 2001-2003 Bear Market . Dems taking over from Repubs 1933 - FDR - Bear mkt 29-33 bottomed just after FDR was inaugurated. 1961 - JFK - Mkt advanced for most of year with JFK in office. 1977 - Carter - Bear Market until march 1978. 1993 - Clinton - Steady Advance.. Peace will be bullish. I will look into the type of stocks that did well in early 1990s. Democrats do tend to benefit smaller and technology stocks. |
DJI-30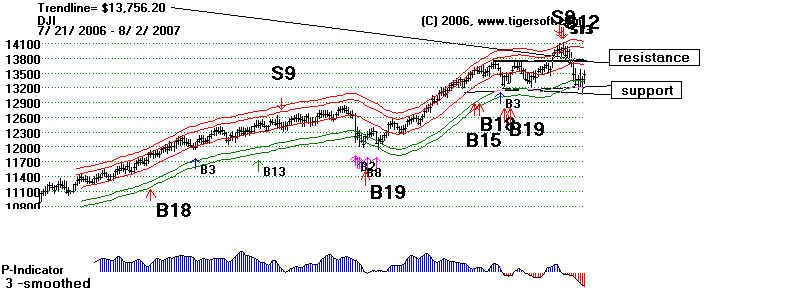 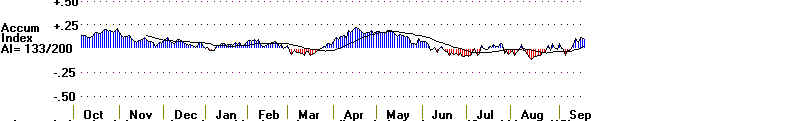 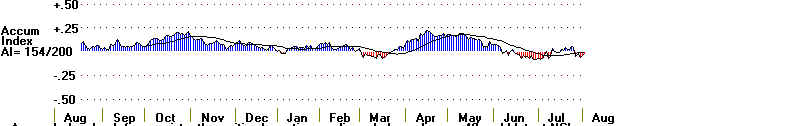 |
NASDAQ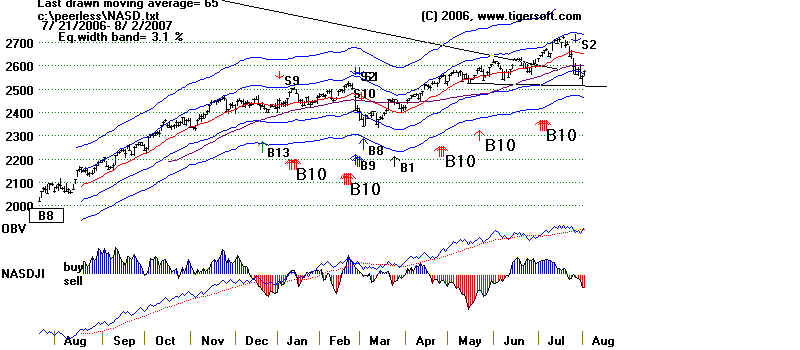 |
Buy on the Fifth Test of Horizontal Support even without a Major Buy
The DJI has tested for the fourth time the horizontal support just above 13200. A fifth
successful test, especially
if the P-Indicator improves, would be bullish enough to buy
even without a major Buy
signal. See the study I
just did.
Combination S9/S12
The combination of
S9-S12 signals is more bearish than the appearance of just an S9 or S12.
Consider just those
cases where they occurred near or at an all-time high and the market quickly
headed down at least
5%, as has just happened.
January 1973 - 18 month bear market started,
May 87 S9/S12 declined only to lower
band. DJI was down 15% in 2 months.
October 87 S9/S12 -33%, far below lower band.
October 89 S9/S12 to below lower band and intra-day down 10%.
July 90 S9/S12 needed to break support. Then went below lower band and down 20%.
July 1998 S9/S12 briefly up and then went down 20%.
August S9/S12 after support failures broke below lower band to -13% below high.
Only in one case did the DJI stop at the lower band. In the other six cases cases
the DJI fell
below the lower band within a
month. Two of these six produced declines of 10% and 13%,
More commonly the DJI was
down 15 or more within 2 months.
================================================================================
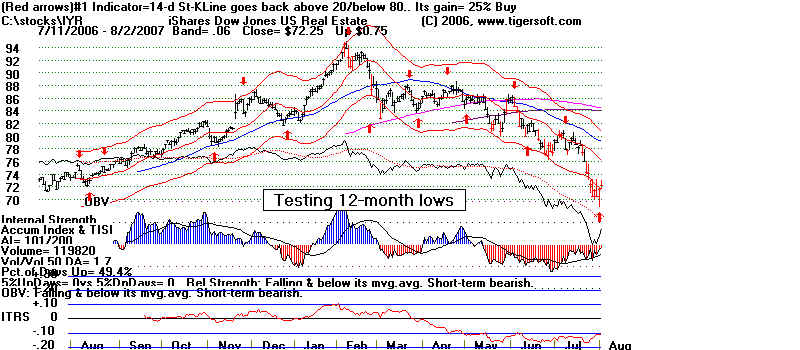
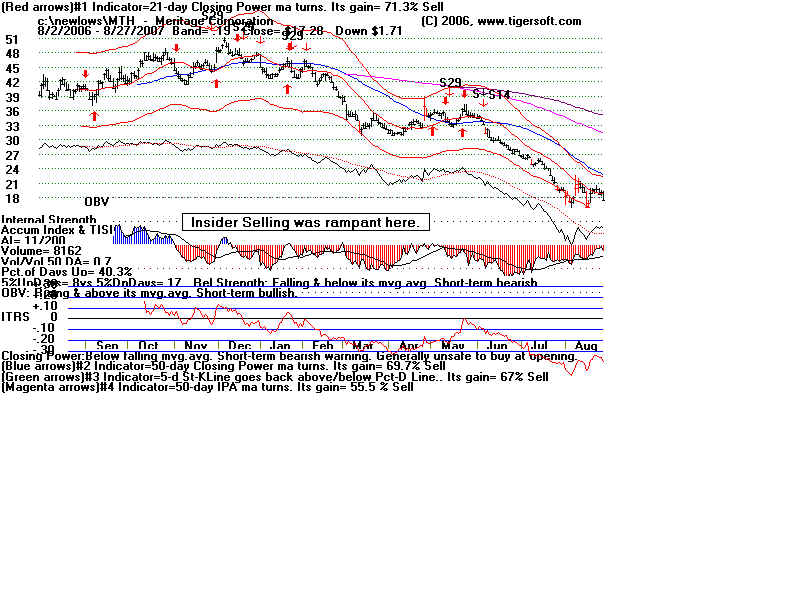
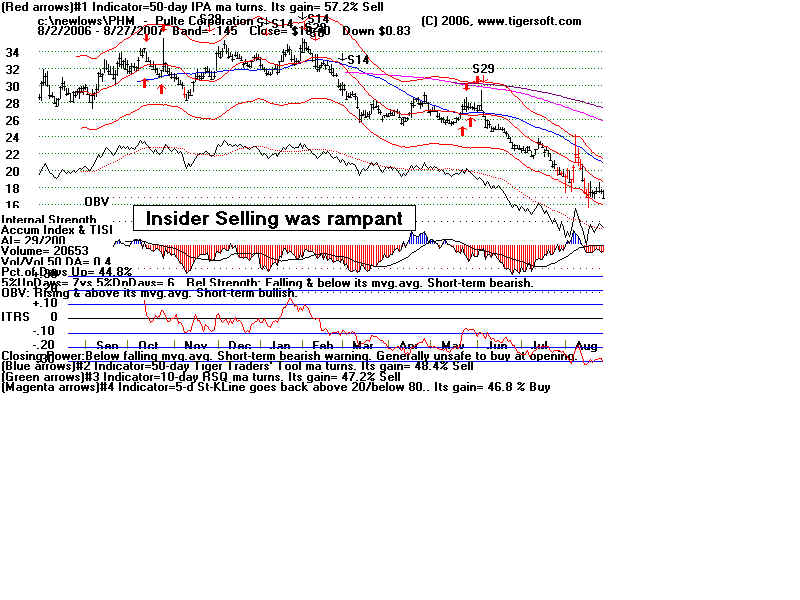
Real Estate -
Home Building - REITs: Charts in Decline
The lower band price target has been quickly met
here. Home Building and many bank stocks
are in a
free-fall. Interest rates are likely to go up and the dollar will most certainly
weaken
further. The Iraq
was will have squandered a trillion dollars when the dust clears. Now the
Guardian (UK) reports there
is a new White House tilt to attack Iran. Watch crude oil. If an
a new Cheney/Bush war
upon Iran is coming, crude oil will start moving up quickly. It is up
3.5 points in the last
2 days. It is less than a point from its high closing of a year ago.
12 month lows by a
significent sector of the market. This affects consumer buying.
US Real Estate ETF - now a 12 month low.
| Homebuilding stocks were again very weak. Here is the
Tiger Index of 30 of them. A bounce might occur. But there is no indication yet that it will could rise more than 3% to 4%, and the additional downside potential is much more than that. Tiger Index of 30 Home Building Stocks 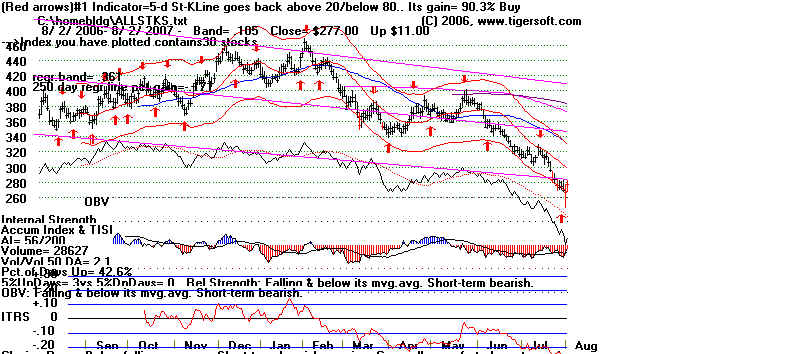 ------------------------------------------- REITs VNQ ---------------------------------------- 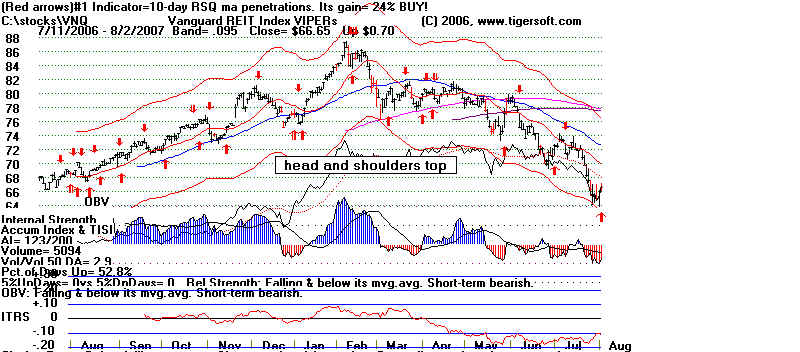 |
|
.. .. .. |
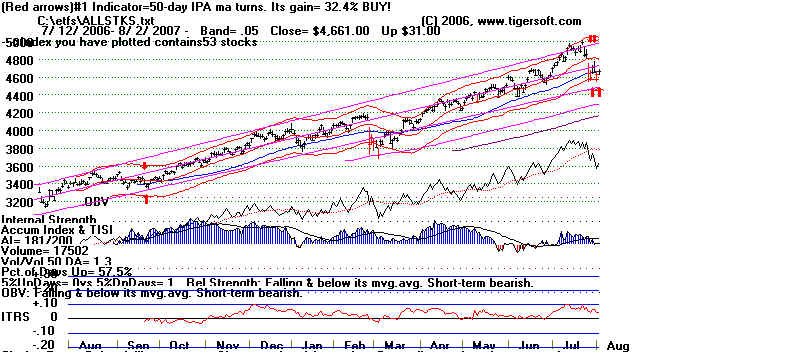
OVERSEAS' MARKETS
You will still want to
appreciate how strong the overseas markets are now.
The Tiger Index of foreign
ETFs is not only rising at a 43% annualized clip, but it is
also breaking above all upper
resistance lines. It is entering what is most
likely an upside blow-off
phase. The VWO - Vanguard Emerging Markets
Fund - looks particularly
strong, showing a perfect AI/200 score of 200 and
very high levels of
Accumulation. All the earlier signs of enormously high
Accumulation in so many ETFs
were "right on the money!" European markets
are now showing bearish
divergences, with their Accumulation Index negative
even as they make new
highs. One reason the DJI-30 stocks are doing so well
is because more than 1/2
of their profits are now coming from overseas operations.
---- Tiger Index of
53 Foreign ETFs ---
=====================================================================================
Why Is The
Overall Market Giving A Sell Signal?
What will upset and stop the rally? Crude Oil is on the rampage again. It is
still well
over 70. It
has formed an inverted continuation head and shoulders pattern.. That
acts as a tax on
the whole economy and brings inflation, thus giving the FED the
excuse they need
to raise rates. Perhaps, the Bush Administration is planning an
attack on
Iran.
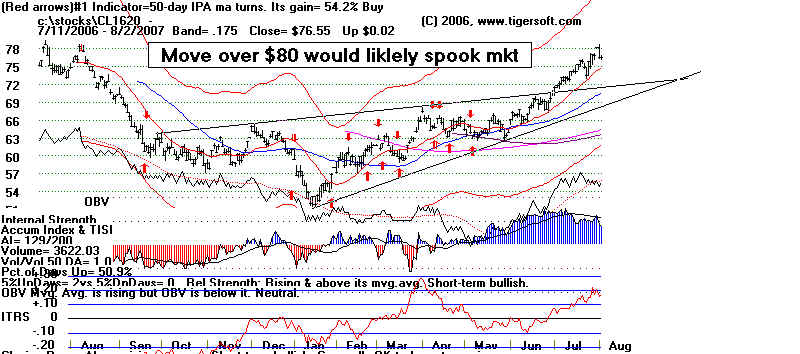
Crude Oil and Natural
Gas: The move past is 70 is bullish. A
challenge of $78
seems next. Watch Light
Crude (CL1620) below. Its rise above its recovery peak of
November
and above its (black) 200-day
ma is bullish for it, but somewhat bearish for the general market.
Watch it
closely. It is on a new Buy and has broken out above its
10-month downtrendline. It may
complete an inverted head and
shoulders bottom Keep this in mind.
Light Crude - CL1620 = Perpetual Contract
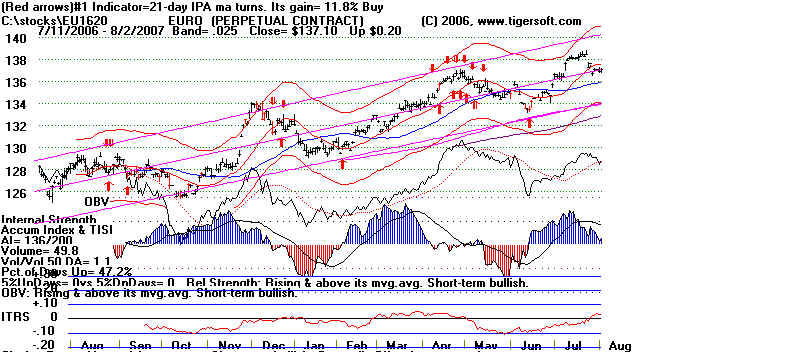
The Euro made a 12 months' new high. The British
Pound has already
broken out. We will be watching to see if the British
raise their short-term
rates. That will put additional pressure on the
Federal Reserve Chairman to
do the same. And that would hurt certain
groups, especially housing and consumer
finance.
=============================================================
-
Summer Rally? How does the
market behave behave from June 22nd
for the next two months when it has already had a big gain in the first part of the
year, as in
2007? The new book I am writing gives us the answer for the DJI-30 back to
1915.
There were 25 cases when the DJI-30 rose steadily in the first 5 months
of the year and was up more than 12%. In 7 (28%) cases, the DJI rose steadily
for the rest of the year. In the other 72 cases, tops that brought declines of more
than 10% followed before the end of the year. Consider how often these tops
took place in the subsequent months of June through December. July is, by
far, the most likely month to see a major top.
June 1950, 1954
July 1919, 1933, 1943, 1975, 1986, 1997,
1998 (and 1990.)
August 1987, 1999
September 1955, 1967, 1976
October 1922, 1927, 1989
November 1925, 1935
December
A
top in July is the most likely scenario for 2007, but there is a 28% chance,
based on these case, that there will be no significant top. Using Peerless
will give us the best read on the market as time goes by this summer. Nearly
all the significant tops were called by Peerless as they were occurring or
soon before or afterwards..
-------------------------------------------------------------------------------------------
----------------------------------------------------------------------------------------------------------
Global Bull Market is Now Very Over-Extended
Early 2003 Now
Gain
Mexico IPC
6000
30000 + 400%
Indonesia Jakarta Composite 400
2000 +400%
Brazil Bovespa
10000 50000
+400%
Turkey ISE National 100 10000
47500
+375%
India BSE30
3000 14000
+ 367%
Chile IPSA Index
800
3200 +300%
Sri Lanka All Share
700
2600
+ 264%
Sweden Stockholm
30 450
1250
+175%
Given
how far up the markets are above big support and how long it has been since there was a
major correction, plus the bearishness of years ending in
"7", it should pay to do some selling.
Table FALLS IN YEARS ENDING
IN "7"
1837 Panic
......
1887 September 19 (-2.24%)
& October 12 (-2.29%)
1897 September 21 (-3.95%)
& October 12 (-3.90%)
1907 Declined
whole year from 90 to 55 in November 37% decline.
Major banking panic October 22.
---------------------- My own study starts
in 1915 -----------------------------------
1917 Early
June peak at 99.... Bottom in December at 66 ... 33%
decline.
Tip-off was well-tested support failure at 88 in August
...........................................................................................................................................
1927 Peak on 10/4 at 200... Fell to 181 on 10/24... 9.5%
decline
Tip-off was OBV NC at upper band.
Tip off was Accum.Index was negative at upper band
.....................................................................................................................................................
1937 Peak was at 190 on 8/16 ... Fell to 113.6 on 11/24 October
18 ...40% decline
Tip-off was OBV NC at upper 3% band..
Tip off was Accum.Index was <+.05 at upper 3% band.
.....................................................................................................................................................
1947 Peak was at 184 on 2/11... Fell to 163.60 on May 20.
...10.9% decline
Tip-off was small head and shoulders top with neckline break at 181 on 2/20
DJI made a 3-month high which was not confirmed by A/D Line
......................................................................................................................................................
1957 Peak was at 521 on 7/12... Fell to 419.80 on October 22.
...19.4% decline
Classic "Sell S9" at upper 3.0% band.
"Sell 12": Tip off was Accum.Index was <+.05 at upper 3% band.
Credit crunch. Sputnik
.....................................................................................................................................................
1967 Peak was at
943 on 9/25... Fell to 826 on March
22. ...12.4% decline
"Sell 12": Tip off was Accum.Index was <+.03 at upper 2.8% band.
Tip-off was head and shoulders top with neckline break at 918 on 10/13
.....................................................................................................................................................
1977 On-going bear
market which did not bottom until March 1978...
In 6/22 DJI reached 2.5% upper band at 926. ...19.0% decline
......................................................................................................................................................
1987 Peak was at 2702
on 8/26... Fell to 1739 on October
19. ...35.6% decline
10/1 at 2639 "Sell 12": Tip off was Accum.Index was <0 at upper 2.8% band.
10/2 at 2640 Classic "Sell S9" at upper 2.6% band. Hit 1739 on 10.19 34.1% decline
......................................................................................................................................................
1997 Peak was at 8015.5
on 10/1... Fell to7498 on 10/28 6.5% decline
"Sell 12": Tip off was Accum.Index was <0 at upper 2.5% band.
......................................................................................................................................................
2007 ???? DJI is
now at upper 0.8% band with Accumulation negative.
A 10% Correction in the DJI Remains over-due
Because it has been so long since
there has been a serious round of
profit-taking - more than 50 months since there was a 10% correction in
DJI-30 -
we should be careful. Buying the highest AI/200 stocks is one solution.
Their
massive insider-inspired buying usually means there are ready buyers on any
weakness...
Interest rates are apparently going to go
up. We can see this in the weak
utilities (they remain the weakest group in the Fidelity Sector funds for the
last month), the steep recent decline in Housing Stocks (See the Tiger
Housing Stocks'
Index below) and the weakness until the middle of this past week in Gold and
the
EURO (Higher interest rates hurt them, as they make the dollar
strengthen.)
Crude Oil has completed a very bullish inverted head
and shoulders pattern.
if the neckline in its chart below is taken out, it will make inflation much worse
and make it easier for the FEDs to justify higher rates as they struggle to get
foreigners to fund the massive US debt.
Sharp rises in interest rates can occasionally bring a 10%
decline without
a major Peerless Sell. That was true in early 1994, in 1976 and also
mid-1975.
The chart of 1975 is shown immediately below. The breaking of the long
unviolated
NYSE A/D Line uptrend brought about a 10% correction that last 2-3 months
then.
In that case, the turning negative of the P-Indicator and the Accumulation
Index were bearish signs. That is true now.
+++++++++++++++++++++++++++++++++++++++++++++++++++++++++++++++++++++++++++++++
=============================================================================
NYSE New Highs
It is important for the bulls that the number of new highs be at high levels. This means stocks are
running after a breakout. Otherwise, we would see bearish false breakouts. These acts as bull-traps
and create bearish conditions. As long as New Lows stay under 50, the market has little risk.
Watch the NYSE New Highs (NH) below. Watch to see the trend of these numbers. Thus,
new Lows made a 3 month high, just one day after the DJI made a new high closing.
NYSE NHs New Lows
-------------- --------------|
8/2 29 66
7/31 11 160
7/30 14 176
7/27 8 221
7/26 11 503 (correct?)
7/25 18 215
7/24 12 232
7/23 81 78
7/20 34 74
7/19 112 65
7/18 45 80
7/17 72 52
7/16 82 30
7/13 154 31
7/12 185 42
7/11 48 42
7/10 30 56
7/9 156 16
7/6 161 15
7/5 120 19
7/3 102 12
7/2 112 12
6/29 52 25
6/28 54 11
6/27 34 34
6/26 19 72
6/25 18 35
6/22 36 41
6/21 79 31
6/20 49 26
6/19 125 15
6/18 140 16
6/15 247 9
6/14 154 16
6/13 69 14
6/12 15 100
6/11 31 24
6/8 28 25
6/7 3 73
6/6 25 22
6/5 112 31
6/4 297 9
6/1 274 12
5/31 210 11
5/30 169 7
5/29 96 16
5/25 52 5
5/24 19 20
5/23 101 12
5/22 189 11
5/21 242 6
5/18 190 12
5/17 125 18
5/16 129 13
5/15 93 25
5/14 87 21
5/11 92 10
5/10 45 20
5/9 210 3
5/8 113 8
5/7 202 10
5/4 205 9
5/3 152 3
5/2 150 4
4/30 67 17
4/27 127 12
4/26 177 11
4/25 301 5
4/24 125 7
4/23 187 7
4/20 213 3
4/19 63 7
4/18 133 5
4/17 238 10
4/16 329 7
4/13 164 6
4/12 124 8
(Source:http://dynamic.nasdaq.com/asp/52weekshilow.asp?exchange=NYSE&status=HI)
-----------------------------------------------------------------------------------------------------------
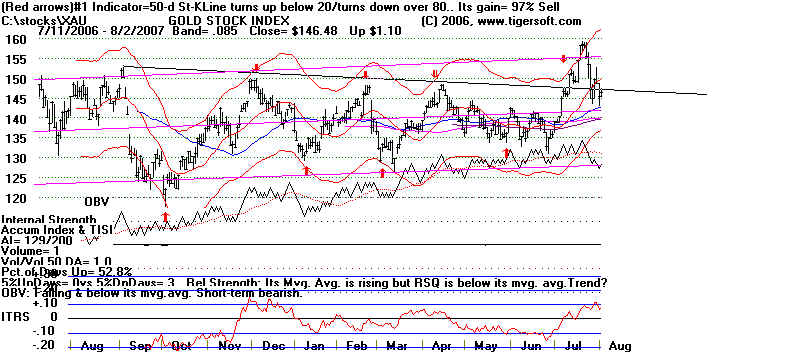
Gold and Silver
Gold Stocks Index (XAU)
XAU is on a new Sell. but it broke out marinally above the 150 level
that has stopped 8 different XAU rallies in the last 2 years. A lot of upwards
monetum is likely to come into gold and silver stocks. Of course, the FED
could upset things by suddenly raising interest rates. But even this would
not likley stop the up-move that we should now expect, provided the breakout
extends itself. With the dollar is so weak, there is a very rral chance that the Fed
will be forced to do this, to keep attracting foreign funds. So watch the EURO
especially closely. S9/S12 signals do drop gold and silver prices in 2/3 of their cases
since 1985. Sharp rises in gold ofter are harbingers of an intermediate-term top..
FIDELITY SECTOR FUNDS' PERFORMANCE 8/2/2007
Performance since 7/17 (Sell).
---------------------------------------
Recent Month's Gain Biggest Holdings
Strongest
FSAGX Gold +3% NEM, ABX, IAG, GG, GFI, AZS (also MGD?)
At 3 earlier peaks' resistance. Watch for potential breakout.
FSDAX Military +2%
Weakest
FSVLX Home Finance -16%
FSLBX Brokerage -10%
FSRBX Banking -9%
FSPFX Paper/Forest -9%
FSCPX Insurance -8%
FIDSX Financial -8%
FSAVX Automotive -8%
18 of the 43 Fidelity Select funds fell 5% or more.
============= After 8/2 seasonality ==================
Since 1965, the DJI has risen
54% after the next 3 trading days.
51% after the next 5 trading days.
54% after the next 10 trading days.
54% after the next 21-trading.
54% after the next two months.
===============================================================
----
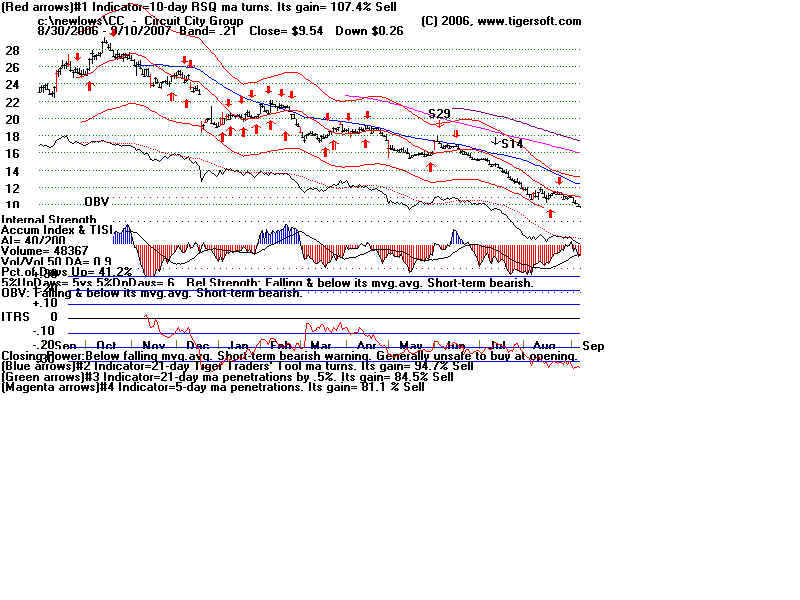
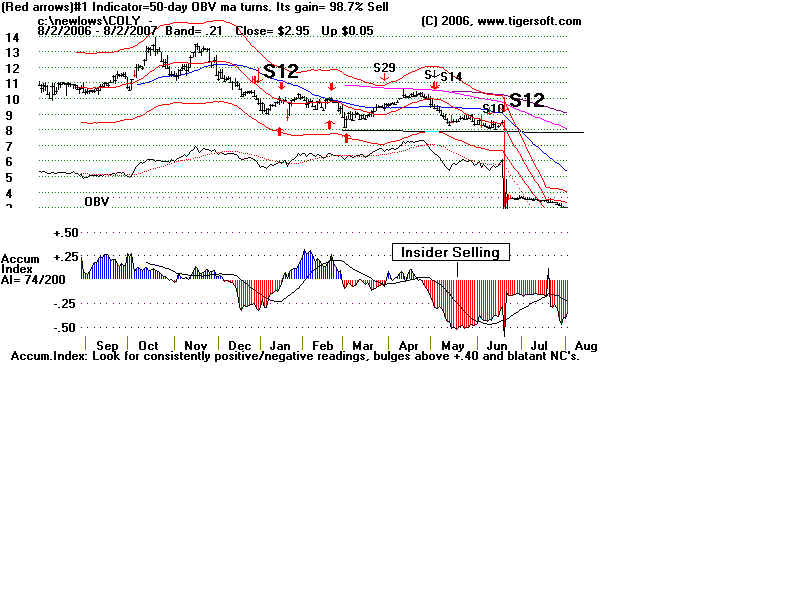
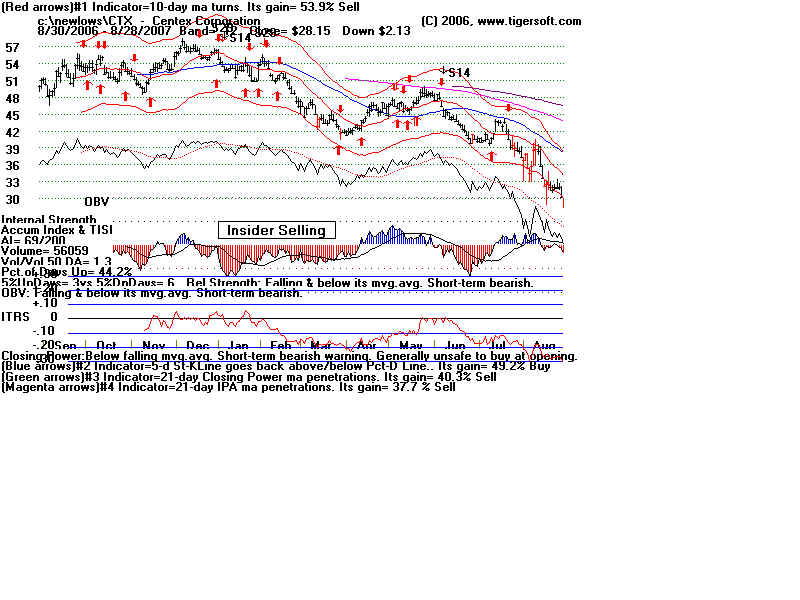
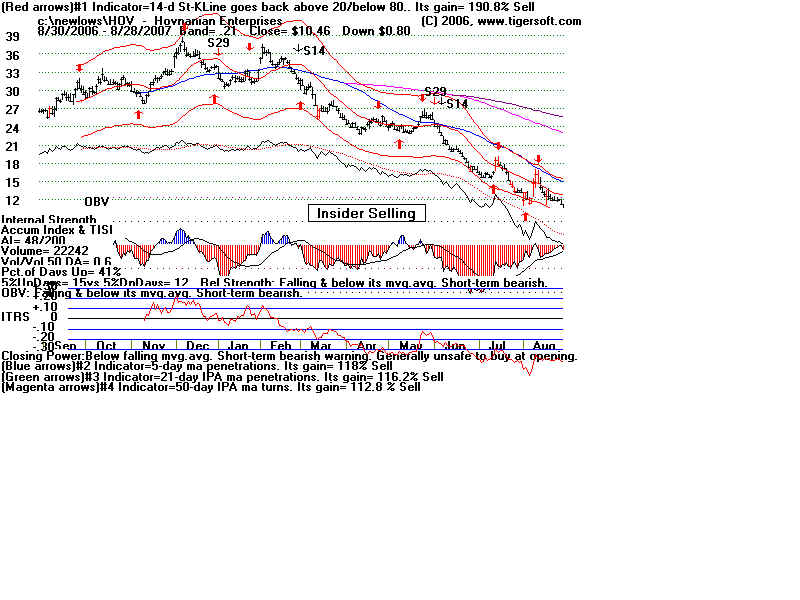
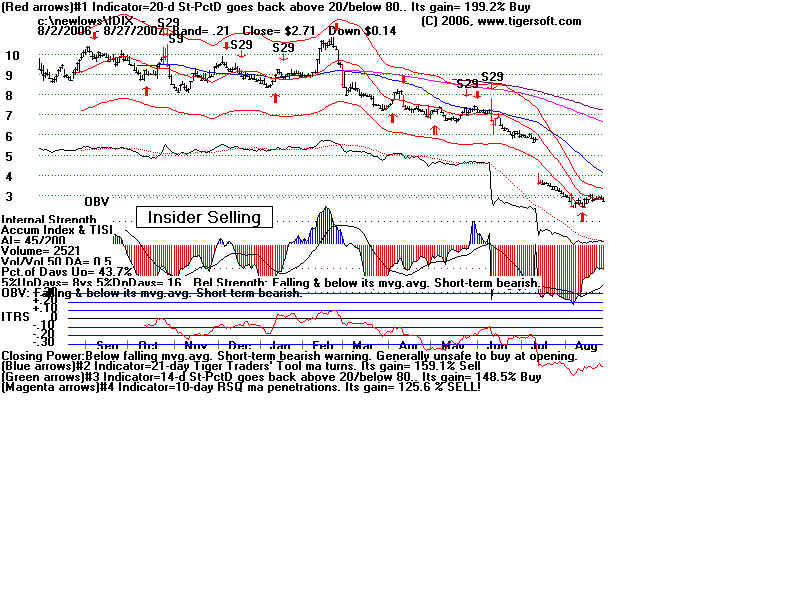
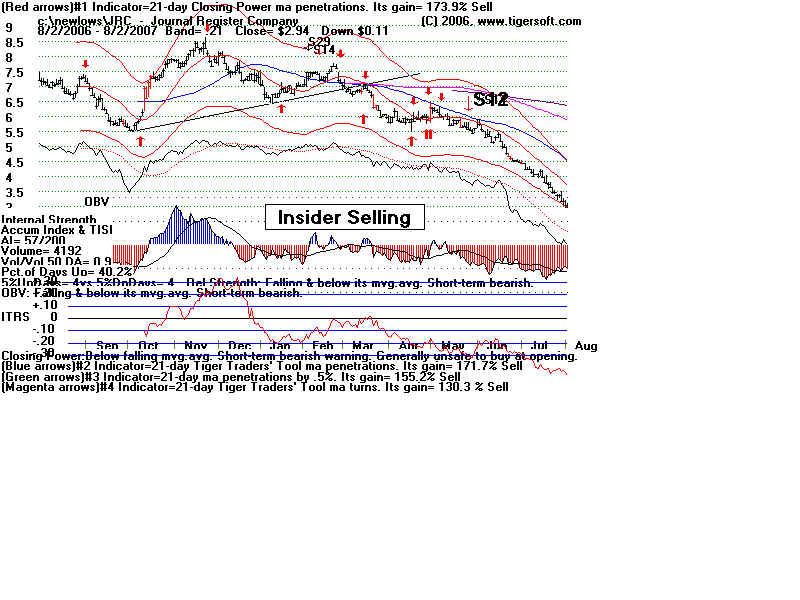
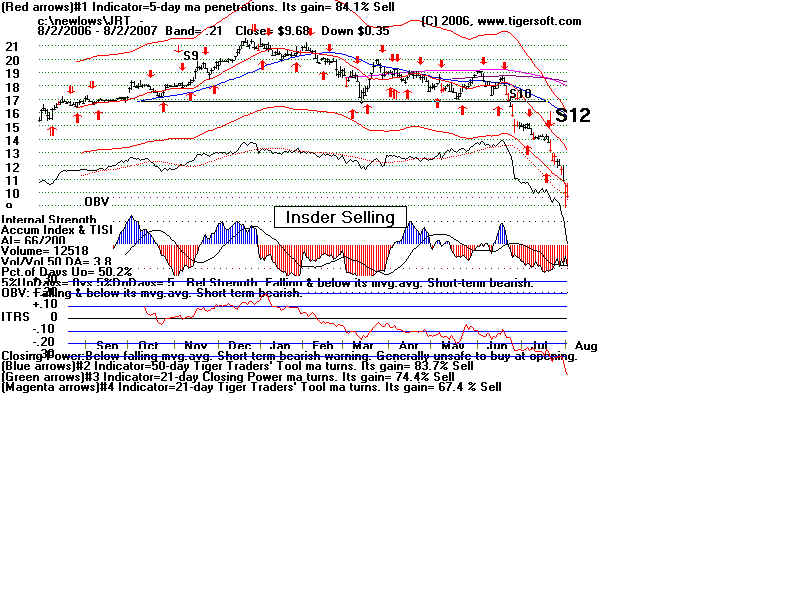
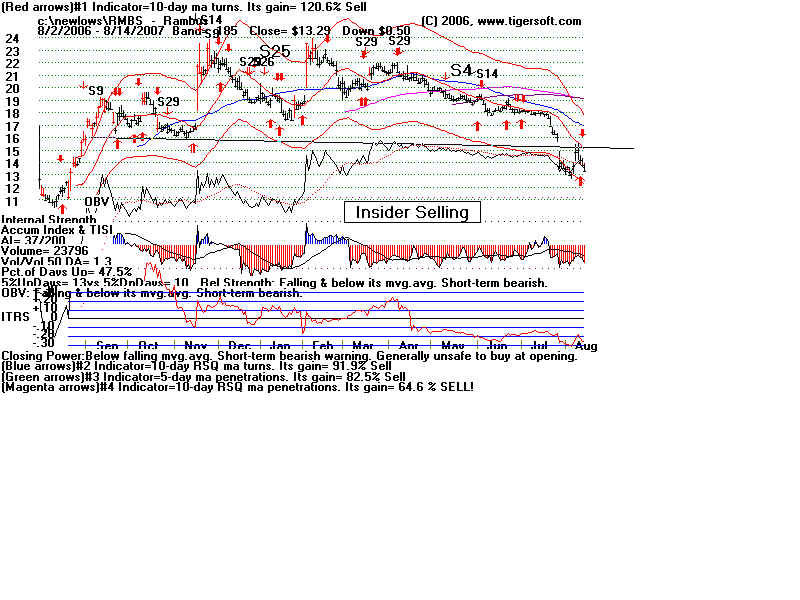
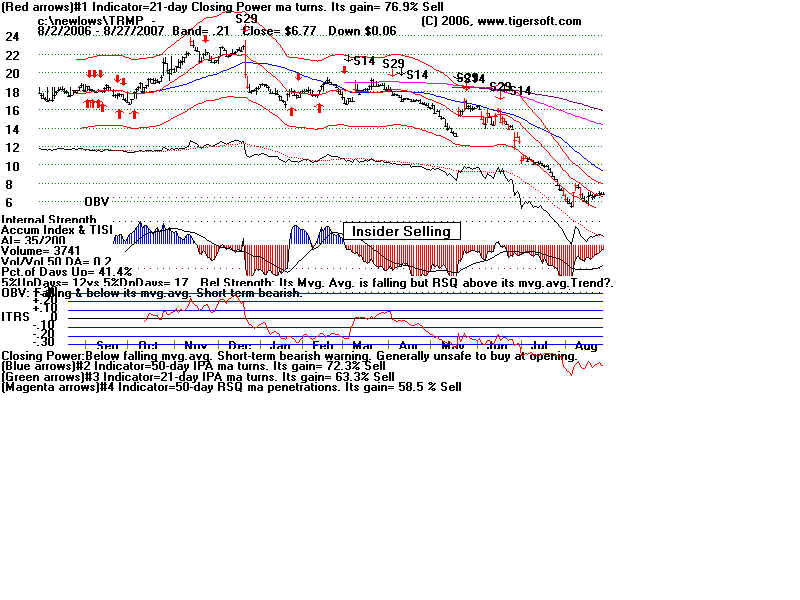
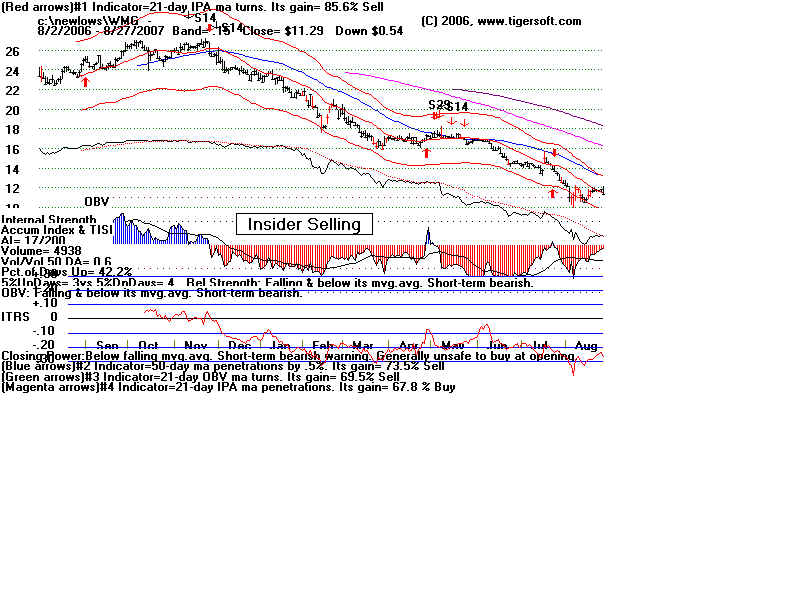
Weak Stocks - Note How Many Show Significant Insider
Informed Selling, shown when the stock does not rally with the general
market under the weight of selling, shows bery negative (red) Accumulation
and then falls sharply when the supporters cease to hold the stock up.
Stocks are often held up artificially to let big sellers get out
at a price advantage. 8/2/2007
Please consider getting Tiger Soft and Power-Ranker to Find these stocks
each night or subscribe to the Full Hotline including Stock Recommendations
for Tiger Software. Study these to see what predicts biggest decliners.
-
-
-
-
-
-
--
--
--
---
-
-
--
-