Peerless Buy B20
Created 8/21/2012
(C) 2014 William Schmidt, Ph.D. All rights reserved.
--------------------------------------------------------------------------------------------------------------------------------------------
Buy B20s produced impressive
gains. There have been 22 of the
new Buy B10 signals since 1928. The average gain was 12.5%.
There were no losses. If the DJI was close to the 21-day ma when
the B20 occurred, the odds were 80% that there would be no
paper loss. The signal is based on a simple and logically bullish
concept. I think it should be added to our Peerless arsenal.
August and September B20s were much weaker.
August-Sept Buy B20s
are much weaker.
Date Pct LA/MA IP21 65-day
Gain Change
---------------------------------------------------------------------------
#1 8/2/1933 +.049 .952 -.104 .218
Paper Loss = 2.3%
#2 9/2/1975 +.018 1.01 -.022 -.011
Paper Loss = None
#3 8/31/2007 +.034 1.01 -.007 -.02
Paper Loss = 1.9%
#4 8/17/1934 +.016 1.011 .018 18% below recent high.
----------------------------------------------------------------------------------
Avg. 2.7%
Clearly dropping these would have helped the average gain
for all Buy B20s.
Buy
B20s tells us that over any 8-day period, there were 4 days where
the ratio of daily NYSE advances to declines was greater than 2.5.
The DJI must not be in a bear market, as defined by:
a) the 65-day Pct. Change is below -.135 or
b) the DJI is more than 17% below its recent highs.
Example:
NYSE NYSE
A/D Ratio
Advances Declines
---------------------------------------------------------------------
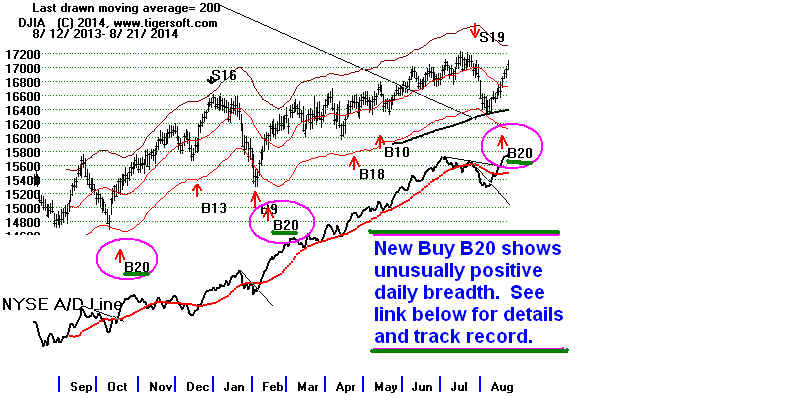
8/7/2014 1471 1679
.876
8/8/2014 2397 773
3.101
8/11/2014 2314 834
2.775
8/12/2014 1285 1828
.703
8/13/2014 2341 808
2.897
8/14/2014 2116 1003
2.110
8/15//2014 1534 1575
.974
8/18/2014 2481 692
3.585 Forth A/D Ratio
over 2.5
brings Buy B20
Note again that Buy B20s cannot be
trusted when a bear market is close or
prevails. They may tell us a bottom is near, but by themselves they are not
reliable.
There is one more factor. Avoid using a B20
in an over-bought market,
one which I would define as having a the 65-day Pct. Change is over +.15
Cases: :
Gain
LA/MA 65-day Pct Change Paper Loss
8/10/1933 +1.8%
1.005 +.264
2.2%
9/21/1938 +13.1%
1.000 +.174
10.5%
BUY B20 GAINS
There have been 22 of the new Buy B10 signals since 1928. The average
gain was 12.5%.
They were highest when the LA/MA (DJI close/21-dma) was between .982 and
1.007.
In these 10 cases, the average gain was 13.6%.
Average gains were next highest in the7 cases where the LA/MA was above
1.007.
In these cases, the average gain was 12.6%. The average for the 5 with
LA/MAs
below .981 was stilll an impressive 10.2%
But having a high IP21 score here is quite
detrimental to the success of the Buy B20.
In the 4 instances when the IP21 was above +.065, the Peerlesss gain was
only 2.9%.
Apparently, a high IP21 plus very good breadth can register an oversold
market
condition and more of a pull-back is likely. |
Interestingly, very low IP21 readings, below -.065, did not prevent
some very good
Buy B20 gains In the 5 cases where the IP21 was below -.05, the average
gain was 12.0%
Paper Losses
Remarkably, paper losses were non-existent in 8 of
the 10 cases where the Buy B20
occurred with the LA/MA between .982 and 1.007. In the two
other cases, the paper
losses were only 0.9% and 1.9%.
Paper losses were much larger in the 12 cases where the Buy B20 took
place with a
LA/MA below .982 or above +1.007.
--------------------------------------------------------------------------------
Cases: 1929-2014
Table 1: Normal Buy B20s,
where the LA/MA is between .982 and 1.007.
Normal Buy B20s
Date Peerless LA/MA IP21 65-day
Gain Pct Change
---------------------------------------------------------------------------
#1 2/2/1939 +3.5% .989 -.161 -.056
Paper loss = none
#2 5/29/1947 +8.9% 1.004 -.002 -.045
Paper loss = 0.8%
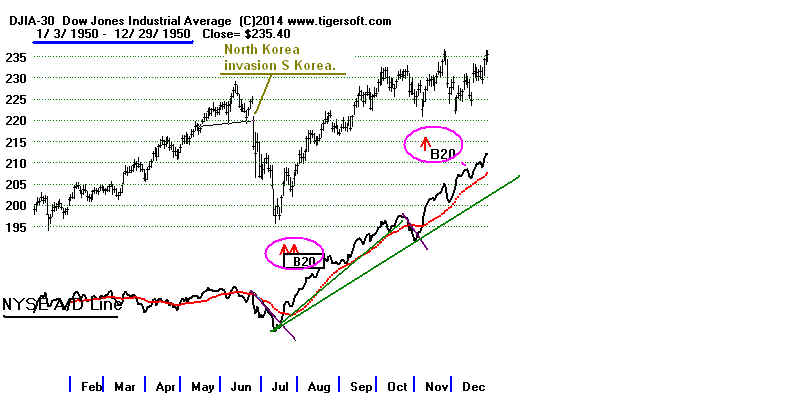
#3 7/20/1950 +24.7% .994 -.045 -.035
Paper loss = 1.9%
#4 7/27/1950 +25.7% 1.004 -.012 -.030
Paper loss = none
#5 11/9/1950 +14.0% .996 +.028 +.052
Paper loss = none
#6 1/12/1954 +39.9% 1.001 +.058 +.055
Paper loss = none
#7 7/16/2010 +4.4% .996 -.033 -.093
Paper loss = none
#8 10/5/2011 +10.6% .985 -.034 -.130
Paper loss = none
#9 7/1/ 2013 +3.3% .996 -.057 +.027
Paper loss = none
#10 2/13/2014 +6.0% 1.005 +.016
Paper loss = none
-----------------------------------------------------------------
Number = 10 Avg = +13.6%
8/18/2014 open 1.006 +.023
-----------------------------------------------------------------------------------------------------------------------------------------------------
Table 2 Valid Buy B20s with High or Low LA/MA:
    Cases where LA/MA is unusually high or low,
         but not in or on the verge of Bear Market


              Low LA/MA Cases not in a Bear Market:

Date            Peerless                 LA/MA      IP21      65-day
                         Gain                              Pct Change
 ---------------------------------------------------------------------------
#1  8/2/1933             +.049            .952    -.104     .218
     Paper Loss = 2.3%

#2  9/28/1938            +.178            .975    +.004    +.024
     Paper Loss = None

#3  11/10/1943           +.236            .968    -.204    -.022
     Paper loss = 2.3%

#4  11/5/1948            +.01             .962     +.151    -.015
     Paper loss = 4.2%

#5  11/12/1948           +.036            .944     +.071    -.047
     Paper loss = 4.2%
 -----------------------------------------------------------------
  Number = 5                    Avg = +10.2%


              High LA/MA Cases not in a Bear Market:

Date                  Peerless     LA/MA         IP21        65-day
                        Gain                               Pct Change
 ---------------------------------------------------------------------------
#1 12/7/1943            +.229           1.012     -.14     -.025
     Paper Loss = None

#2 12/5/1945            +.032           1.012     +.133    .122
     Paper loss = 2.1%

#3 1/22/1958            +.459           1.012     -.011     .02   14% below recent peak
     Paper loss = 2.0%
     Rslly did stop at upper band.

#4  9/2/1975             +.018           1.01     -.022    -.011
     Paper Loss = None

#5 8/31/2007            +.034           1.01      -.007    -.02
     Paper Loss = 1.9%

#6 11/1/2011            +.038           1.008      +.21     -.04
     Paper loss = 3.7%

#7 10/17/2013           +.074           1.011      -.051    -.007
     Paper loss = None
 -----------------------------------------------------------------------------------------
   Number = 7                    Avg = +12.6%


-----------------------------------------------------------------------------------------------------------------------------------------------------
         Tables 4 and 5 show the cases occurring when the LA/MA is
          outside the normal range and DJI is in a bear market.

          These should not be treated as Buy B20s.
 Table 4        LA/MA below .982


 Date          Peerless Gain           LA/MA            65-day
                                                        Pct Change
--------------------------------------------------------------------------------------
 7/24/1931            +.037            .950             -.108   26% below recent peak
 10/28/1937           -.051            .967             -.267
 4/8/1938             +.048            .976             -.150   42% below recent peak.
 4/20/1939            +.068            .975             -.135   19% below recent high.
 9/11/1946            +.067            .905             -.184   19% below recent peak
 11/6/2008            -.023            .974             -.354   33% below recent high
------------------------------------------------------------------------------
          No=6    Avg = 2.4%
Table 5
        LA/MA is above 1.007

Date          Peerless Gain           LA/MA            65-day
                                                       Pct Change
--------------------------------------------------------------------------------------
11/16/1932            -.005           1.008              .001   19% below recent high.
 8/17/1934            +.016           1.011             -.018   18% below recent high.
11/22/1935            +.079           1.01              +.144   29% below recent high.
10/17/1946            +.069           1.01              -.151   19% below recent peak.
12/4/1946             +.078           1.009             -.107   20% below recent peak.
6/5/1970              +.016           1.009             -.118   24% below recent peak.
10/16/1974            +.02            1.012             -.17    26% below recent peak
1/7/2008              -.071           1.008             -.151   35% below recent high
---------------------------------------------------------------------------------------
         No=8    Avg = 2.5%
============================================================================
Comments from Peerless Hotline
The unusually positive breadth we have seen on this recovery
has a reliably bullish
track record. Don't sell too quickly. The DJI should reach
the upper band.
See below how positive the track record of a new Buy signal
is. It is based
simply on looking back over any 8 trading days' period and
counting the
number of the days in this period that the ratio of NYSE
advancers to decliners
is better than 2.5:1. When there are 4 or more such days,
it is a bullish sign.
There are a lot fewer cases of this than I expected. Testing
shows the trading
results can be further improved by requiring the DJI's LA/MA
(close divided by 21-dma) to be between .982 and 1.007.
Good results are also generally seen if one allows these
signals to occur
down to an LA/MA of .96. An LA/MA above 1.007 often also
works, but too
often there subsequently is a pullback from the upper band,
thereby making
signals this high up off the 21-day ma more likely to be
un-timely. As a
measurement of real and underlying market strength, a high
percentage of
these signals are very good. (More on this tomorrow night.)
Historical Cases of New Signal (not yet numbered)
Date Gain
La/Ma 65-day pct change
of at time of
Buy next
Signal Peerless
Sell
---------------------------------------------------------------------------
8/10/1933 +1.8% 1.005
+.264
9/21/1938 +13.1% 1.000
+.174
2/2/1939 +3.5% .989
-.056
5/29/1947 +8.9% 1.004
-.045
7/20/1950 +24.7% .994
-.035
7/27/1950 +25.7% 1.004
-.030
11/9/1950 +14.0% .996
+.052
long period of time no signals
7/16/2010 +4.4% .996
-.093
10/5/2011 + 10.6% .985
-.130
7/1/2013 +3.3% .996
+.027
2/13/2014 +6.0% 1.005
+.016
8/18/2014 open 1.006
+.023