Sell S9vs: 1966-2011
(C) 2011 William Schmidt, Ph.D.
7/22/2011
New Peerless Buys and Sells
are always being looked for
on our Hotline as the market sets up what might be an
important
technical pattern. The research is detailed, time-consuming
and
often unproductive. There are a lot dead-ends. But once
in
a while, we learn a new way to reliably call market tops and bottoms
with
our tools.
In
our 7/22/201 Hotline, I wrote:
7/22/2011
"The Volume Fuel for An
Extension of The Summer Rally is
Running Low... The research I have
just done for the S9vs suggests
we are at or near a top, in which there
is a 45% chance for a decline
below the lower band."
Lengthy back-testing showed how solid a new "revised Sell
S9v" On an
intermediate-term
basis, adding it the exisiting Peerless system's track record
since 1966 would have
produced a +2.3% loss and new gains of +2.6%, + 5.2%
and whatever is the
result of the current (July 2011) pair of Sell S9vs. The most
recent 2011 S9vs
may be the most important to date. Regardless, the Sell S9V
is reliable and suffers
only very minor paper losses. There has been only one
loss in 21 cases, only
one paper loss of more than 2.5% and when the S9V
occurs, there is a 50%+
probability of a decline below the lower band.
The exact formula for
the V-Indicator is revealed to full Peerless/Tiger customers
and will be published
in the forthcoming Peerless books. .
2011's S9Vs
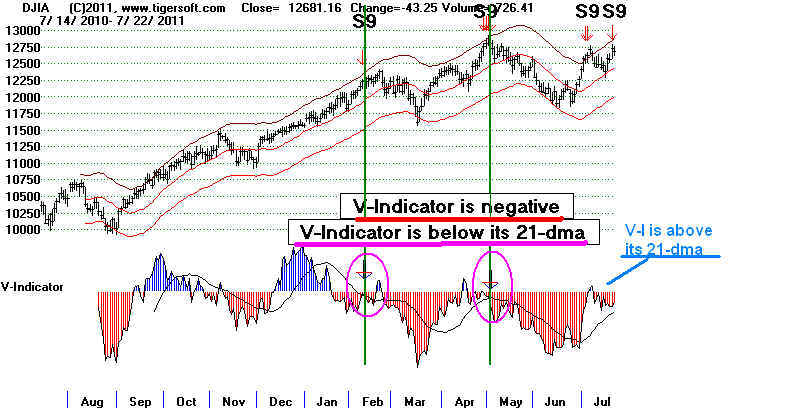
S9v Sell signals, as presented here, do duplicate many
of
other, more regular S9s which are based on negative divergences
by the P-Indicator and IP21 from the DJI when it is at the
upper band. Many of the dates of these signals are the same
for our regular S9s.
Results in 21 cases:
1 decline to MA and
then a 2.3% paper loss.
2 2011 declines to LB
in which the final outcome here is not decided.
8 declines to LB
10 declines below LB
Paper Losses:
In the 20 S9v cases since 1966,
there was one +3% paper loss, five +2% paper
losses and three 1% paper loss.
In 12 of the 20 cases, the DJI fell immediately or so
quickly that there was no paper
loss of more than 1/2%.
Sell S9vs: 1966-2011
Date DJI
la/ma ann-roc P Pch
IP21 VI Opct Outcome
----------------------------------------------------------------------------
(1-6)
7/21/2011 12724.41 1.025 .513 269 -16 .085 -51 .005 ?(1-5)
Decline to LB in 1 week. Final outcome not determined. No Paper Loss.
7/5/2011 12569.87 1.037 .412 239 57 -.034 -48 .08
Decline to LB in 3 weeks. Final outcome not determined. Still open.
1% paper loss.
5/2/2011 12807.36 1.028 .467 212 -50 .147 -17 .33
Decline below LB in six weeks. NO PAPER LOSS
There was no other Peerless sell here. Peerless Gain = +5.9%
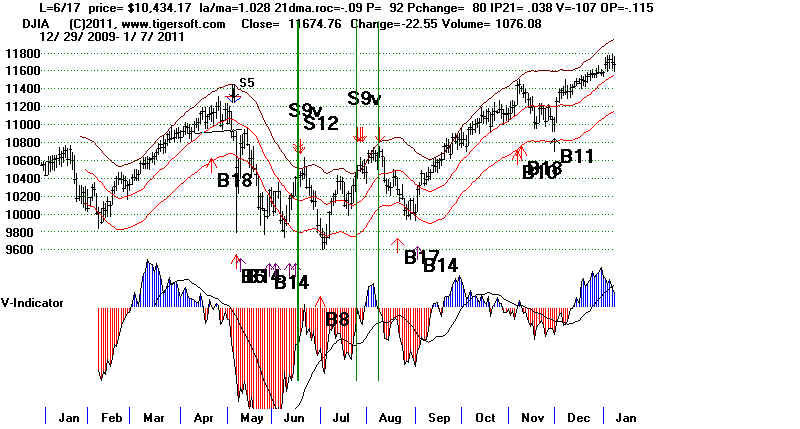
8/9/2010 10698.75 1.025 .572 477 -19 .246 -15 .047 decline to LB
There was no regular Peerless here. then decline to LB in 6 weeks.
It would have gained an additional +4.0% NO PAPER LOSS
7/26/2010 10542.43 1.041 .459 442 170 .166 -11 .037 1 wk higher,
There was no regular Peerless here. then decline to LB in 5 weeks..
It would have gained an additional +2.6% PAPER LOSS = 1%
6/17/2010 10434.17 1.028 .09 92 80 .038 -107 -.115 2 weeks higher
There was a regular S9/S12 here. Decline below LB
Gain = +6.3% PAPER LOSS = 1%
 (7-11)
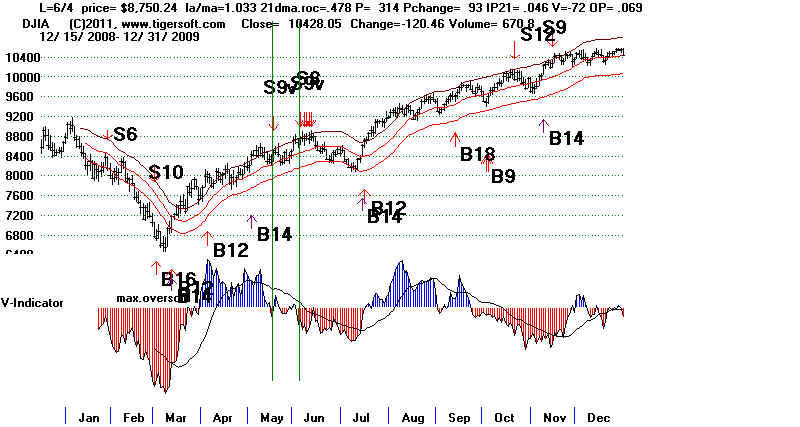
6/4/2009 8750.24 1.033 .478 316 92 .046 -73 .068
Also a regular S9. declined to LB in 5 weeks..NO PAPER LOSS
5/18/2009 8504.08 1.033 .54 335 63 -.005 -11 .045
Peerless gave a better Sell S9 on 6/4/2009 at 8750.24
Initially declined to 21-dma
and then to lower band in 5 weeks PAPER LOSS = 3%
(7-11)
6/4/2009 8750.24 1.033 .478 316 92 .046 -73 .068
Also a regular S9. declined to LB in 5 weeks..NO PAPER LOSS
5/18/2009 8504.08 1.033 .54 335 63 -.005 -11 .045
Peerless gave a better Sell S9 on 6/4/2009 at 8750.24
Initially declined to 21-dma
and then to lower band in 5 weeks PAPER LOSS = 3%
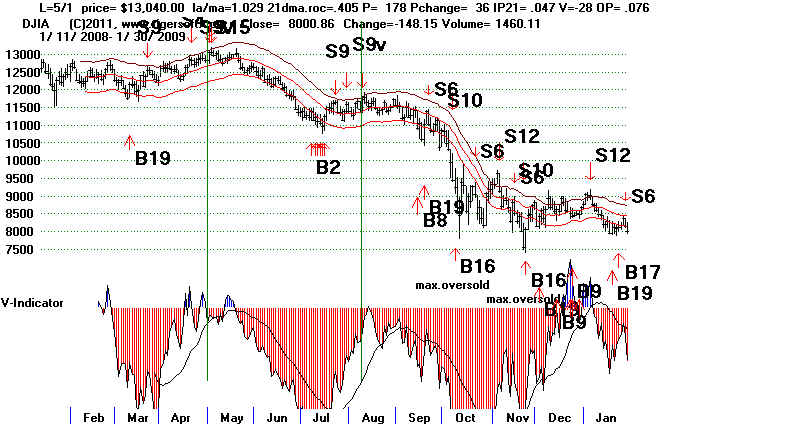
 8/8/2008 11734.32 1.030 .529 91 70 .088 -81 .072 crash followed
Peerless was already on a Sell S9 from 7/30/2002.
Decline below LB in 6 weeks, but fell much further. NO PAPER LOSS
5/1/2008 13040.80 1.029 .405 178 36 .047 -28 .076 crash followed
Also a regular S15. Decline below LB in 5 weeks,but fell much further.NO PAPER LOSS
8/8/2008 11734.32 1.030 .529 91 70 .088 -81 .072 crash followed
Peerless was already on a Sell S9 from 7/30/2002.
Decline below LB in 6 weeks, but fell much further. NO PAPER LOSS
5/1/2008 13040.80 1.029 .405 178 36 .047 -28 .076 crash followed
Also a regular S15. Decline below LB in 5 weeks,but fell much further.NO PAPER LOSS
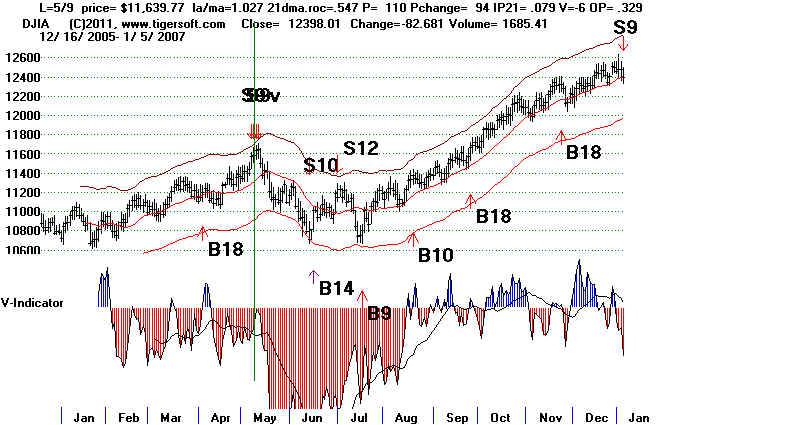
 5/9/2006 11639.77 1.027 .547 110 94 .079 -6 .326 Decline below LB
Also a regular S9. Decline below LB in 5 weeks,but fell further.NO PAPER LOSS
5/9/2006 11639.77 1.027 .547 110 94 .079 -6 .326 Decline below LB
Also a regular S9. Decline below LB in 5 weeks,but fell further.NO PAPER LOSS
 (12-16)
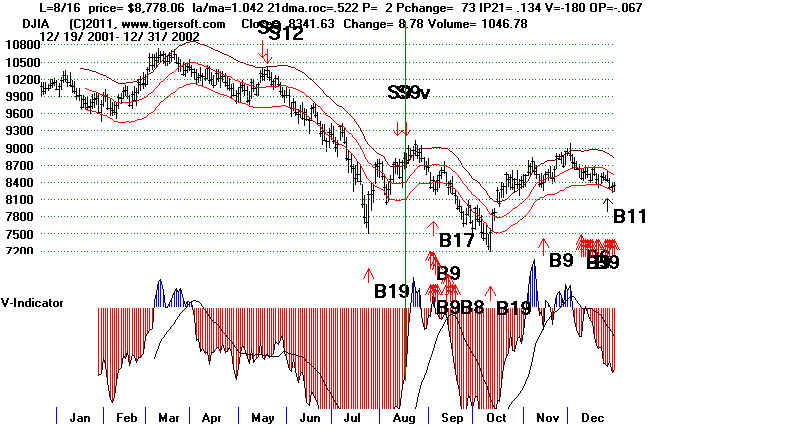
8/16/2002 8778.06 1.042 .522 2 73 .134 -180 -.067 w wk higher
Peerless was already on a Sell S9 from 8/12/2002.
Decline below LB in five weeks PAPER LOSS = 2%
(12-16)
8/16/2002 8778.06 1.042 .522 2 73 .134 -180 -.067 w wk higher
Peerless was already on a Sell S9 from 8/12/2002.
Decline below LB in five weeks PAPER LOSS = 2%
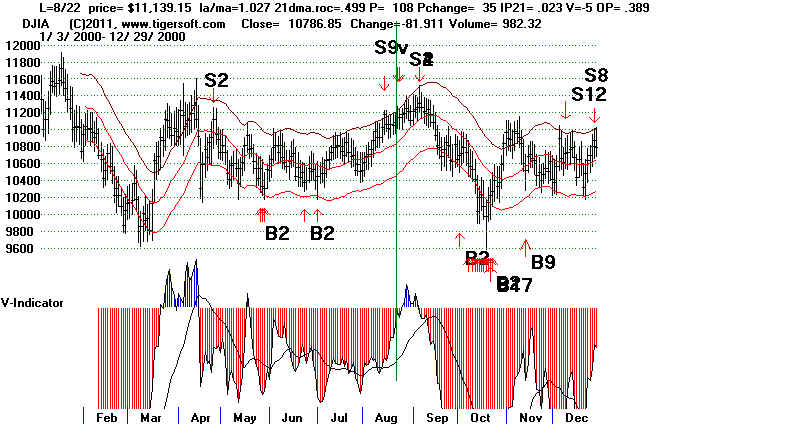
 8/22/2000 11139.15 1.027 .499 108 35 .023 -5 .389 rallied 1 wk more
and then Decline below LB in four weeks PAPER LOSS = 2%
This would have reversed the existing Peerless Buy
slightly lower and earlier than Sell S4 right at the top.
8/14/2000 11176.14 1.039 .403 32 18 -.004 -53 .22 rallied 2 weeks and
This would have reversed the existing Peerless Buy
slightly lower and earlier than Sell S4 right at the top. PAPER LOSS = 2%
Decline below LB in five weeks
8/22/2000 11139.15 1.027 .499 108 35 .023 -5 .389 rallied 1 wk more
and then Decline below LB in four weeks PAPER LOSS = 2%
This would have reversed the existing Peerless Buy
slightly lower and earlier than Sell S4 right at the top.
8/14/2000 11176.14 1.039 .403 32 18 -.004 -53 .22 rallied 2 weeks and
This would have reversed the existing Peerless Buy
slightly lower and earlier than Sell S4 right at the top. PAPER LOSS = 2%
Decline below LB in five weeks
 8/23/1999 11299.76 1.04 .427 -292 66 .064 -74 -.041
Also a regular S9. Decline below LB in four weeks NO PAPER LOSS
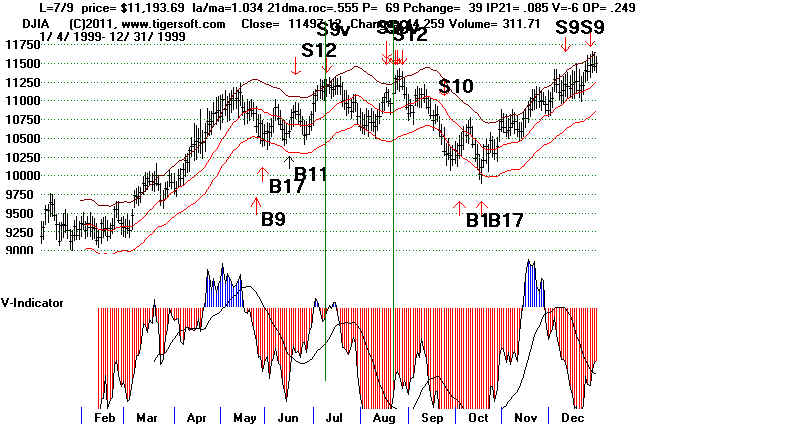
7/9/1999 11193.69 1.034 .555 69 39 .085 -6 .251
Peerless was already on a Sell. Fell to lower band in 3 weeks.NO PAPER LOSS.
Using Peerless to reverse this S9V would have brought a 7.1% gain.
8/23/1999 11299.76 1.04 .427 -292 66 .064 -74 -.041
Also a regular S9. Decline below LB in four weeks NO PAPER LOSS
7/9/1999 11193.69 1.034 .555 69 39 .085 -6 .251
Peerless was already on a Sell. Fell to lower band in 3 weeks.NO PAPER LOSS.
Using Peerless to reverse this S9V would have brought a 7.1% gain.
 (16-21)
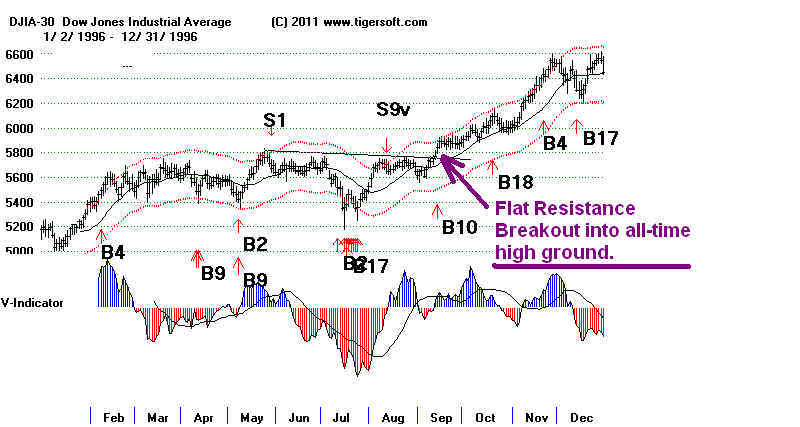
8/12/1996 5704.98 1.034 .42 76 8 .118 -7 .313
Decline to a little below ma.
Using Peerless to reverse this S9V would have brought a 2.3% loss.
Here the DJI refused to breakdown and instead made a classic flat-topped
breakout into all-time high territory. This is a bullish situation.
The V-Indicator also turned positive for 3 weeks. This is bullish.
(16-21)
8/12/1996 5704.98 1.034 .42 76 8 .118 -7 .313
Decline to a little below ma.
Using Peerless to reverse this S9V would have brought a 2.3% loss.
Here the DJI refused to breakdown and instead made a classic flat-topped
breakout into all-time high territory. This is a bullish situation.
The V-Indicator also turned positive for 3 weeks. This is bullish.
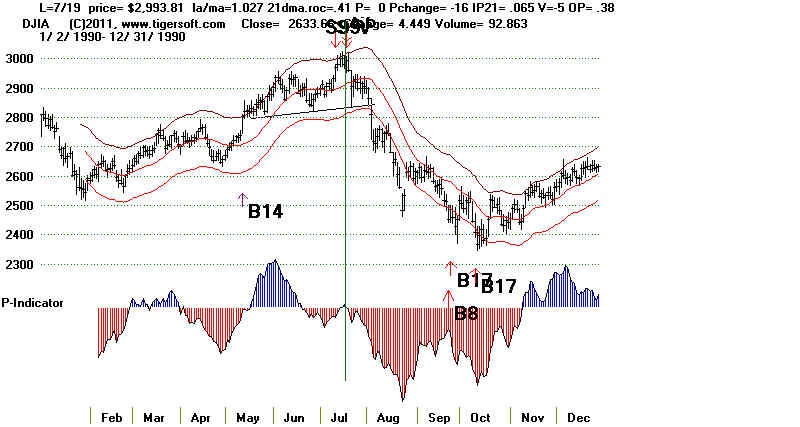
7/19/1990 2993.81 1.027 .41 0 -16 .065 -5 .274
Also a regular S9. Decline below LB NO PAPER LOSS
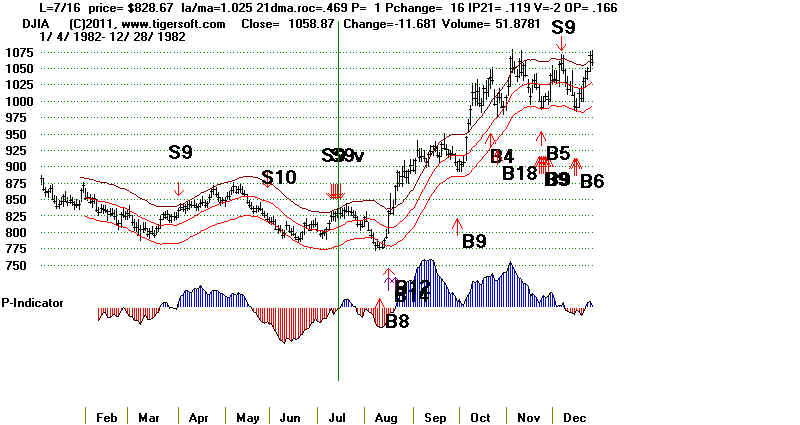
 7/16/1982 828.67 1.025 .469 1 16 .119 -2 .166
Also a regular S9. Fell to LB NO PAPER LOSS
7/16/1982 828.67 1.025 .469 1 16 .119 -2 .166
Also a regular S9. Fell to LB NO PAPER LOSS
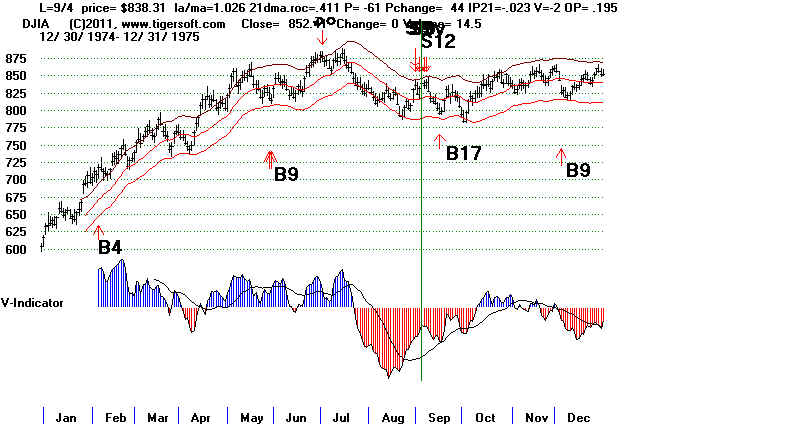
 9/4/1975 838.31 1.026 .411 -61 44 -.023 -2 .193
Also a regular S9/S12. Fell to LB NO PAPER LOSS
9/4/1975 838.31 1.026 .411 -61 44 -.023 -2 .193
Also a regular S9/S12. Fell to LB NO PAPER LOSS
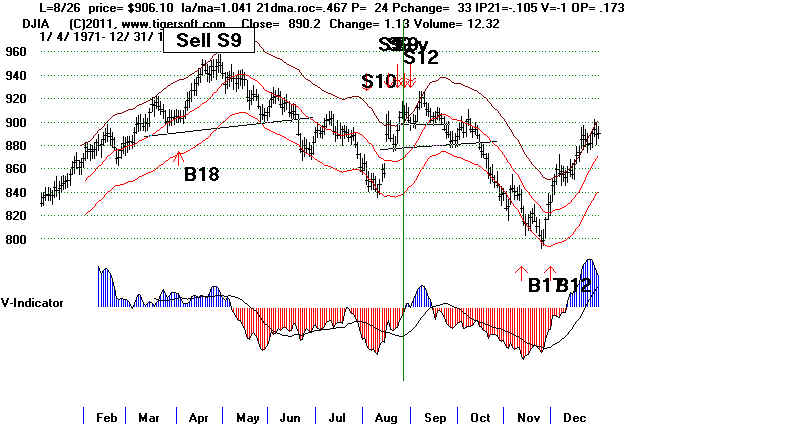
 8/26/1971 906.10 1.041 .467 24 33 -.105 -1 .176
Rose another week and then Decline below LB in 8 weeks. PAPER LOSS = 2%
Also an S9 on 8/17/71 and regular S12 on 8/23/1971 and 8/31/71.
8/26/1971 906.10 1.041 .467 24 33 -.105 -1 .176
Rose another week and then Decline below LB in 8 weeks. PAPER LOSS = 2%
Also an S9 on 8/17/71 and regular S12 on 8/23/1971 and 8/31/71.
 ============================================================================
Eliminated because of DJI being too far above the 21-dma:
LA/MA
8/20/1982 869.29 1.074 .55 -1 46 -.06 -1 -.191 Big LOSS.
8/24/1970 759.58 1.048 .483 43 44 .111 -1 .102 Big LOSS.
There is a decline to (MA+LB)/2 or 747.47
7/17/1970 735.08 1.053 .52 -56 34 -.011 -2 .269 Fell to LB
============================================================================
Eliminated because of DJI being too far above the 21-dma:
LA/MA
8/20/1982 869.29 1.074 .55 -1 46 -.06 -1 -.191 Big LOSS.
8/24/1970 759.58 1.048 .483 43 44 .111 -1 .102 Big LOSS.
There is a decline to (MA+LB)/2 or 747.47
7/17/1970 735.08 1.053 .52 -56 34 -.011 -2 .269 Fell to LB