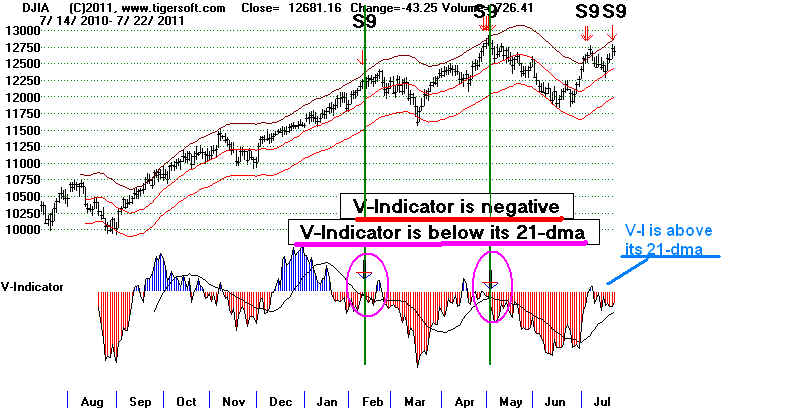
Here I present new research on S9V Sell signals. Below are all the cases when
the V-Indicator was negative and the P-Indicator was above 0 for the dangerous time
period May to September. The DJI must close at least 2.4% over the 21-day ma.
No exclusion is made because of the level of ANNROC or any other key value.
The data below show that we want to better refine the S9V by:
1) excluding cases after 9/16
2) excluding cases where ANROC is below .170
3) excluding case where ANROC is above .648
When we make these adjustments to Sell S9Vs, we get a total of 22 cases since 1965.
There are only 2 failures. In both cases, the DJI went sidewise for a month or more
before making a bullish breakout. So losses here would have been limited.
Date of Unrefined LA/MA ANNROC P-I P-I IP21 V-I OBV-Pct 65-day
S9V Change Pct Change
--------------------------------------------------------------------------------------------------------------------------------------------
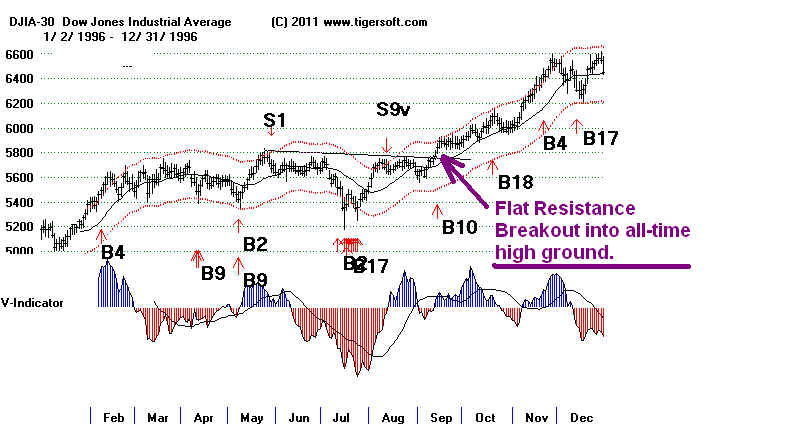
#8 8/9/1996 1.031 .348 68 81 .107 -10 .243 .037
Failed - DJI went sidewise for a month and then broke out above flat resistance and ran upwards.
---------------------------------------------------------------------------------------------------------------------------------------
#20 5/18/2009 1.033 .54 334 63 -.005 -11 .047 .072
Failed - Premature... DJI went sidewise for a month and then resumed new bull market.
------------------------------------------------------------------------------------------------------------------------------------------
All these charts are shown just below.
Date of Unrefined LA/MA ANNROC P-I P-I IP21 V-I OBV-Pct 65-day
S9V Change Pct Change
--------------------------------------------------------------------------------------------------------------------------------------------
9/17/1965 (late) 1.026 .455 95 -8 .065 -8 .282 .057
Failed - DJI rallied.
-------------------------------------------------------------------------------------------------------------------------------------------
#1 6/19/1970 1.042 .954 11 63 .057 -1 .050 -.059
Success - DJI fell to lower band
--------------------------------------------------------------------------------------------------------------------------------------------
#2 7/24/1970 1.039 .644 46 38 .024 -1 .326 -.026
Success - DJI fell to lower band
--------------------------------------------------------------------------------------------------------------------------------------------
8/24/1970 1.029 -.143 (too low) 43 44 .111 -1 .109 .147
Failed to bring decline. DJI went sidewise for 3 months.
-------------------------------------------------------------------------------------------------------------------------------------------
#3 8/26/1971 1.041 .467 24 33 -.105 -1 .183 -.001
Success - DJI declined from 906 to 790 in 3 months.
-------------------------------------------------------------------------------------------------------------------------------------------
#4 5/26/1972 1.026 .318 0 9 .021 -1 .333 .064
Success - DJI declined almost to lower band.
------------------------------------------------------------------------------------------------------------------------------------------
8/14/1972 1.039 .653 (too high) 48 8 .109 -1 .121 .041
Success - DJI declined almost to lower band.
------------------------------------------------------------------------------------------------------------------------------------------
#5 8/7/1974 1.025 .387 32 48 -.043 -1 -.004 -.057
Success - DJI fell from 800 to 580 in 2 months.
------------------------------------------------------------------------------------------------------------------------------------------
#6 8/16/1982 1.025 .469 1 16 .119 -2 .174 -.012
Success - DJI fell slightly below lower band.
-----------------------------------------------------------------------------------------------------------------------------------------
#7 7/18/1990 1.024 .408 15 15 .049 -4 .339 .075
Success - DJI fell from 3000 to 2360 in 3 months.
----------------------------------------------------------------------------------------------------------------------------------------
#8 8/9/1996 1.031 .348 68 81 .107 -10 .243 .037
Failed - DJI went sidewise for a month and then broke out above flat resistance and ran upwards.
---------------------------------------------------------------------------------------------------------------------------------------
#9 7/8/1998 - 1.03 .141 2 7 -.025 -17 .061 .021
Success - DJI briefly rose 2% and then fell nearly 20% in 2 months.
---------------------------------------------------------------------------------------------------------------------------------------
#10 6/30/1999 1.024 .417 64 44 .059 -2 .180 .096
Success - DJI briefly rose 2% and then fell to lower band.
---------------------------------------------------------------------------------------------------------------------------------------
#11 8/11/2000 1.026 .265 14 55 -.023 -62 .238 .063
Success - DJI briefly rose 2%-3% and then fell below lower band.
---------------------------------------------------------------------------------------------------------------------------------------
#12 5/17/2002 1.028 .175 51 15 -.014 -149 .081 .036
Success - DJI fell from 10200 to 7800 in 10 weeks.
---------------------------------------------------------------------------------------------------------------------------------------
#13 8/16/2002 1.042 .522 2 73 .134 -180 -.069 -.144
Success - DJI fell from 8700 to 7250 in 2 months.
--------------------------------------------------------------------------------------------------------------------------------------
#14 6/7/2004 1.03 .177 351 188 .034 -22 .028 -.019
Success - DJI fell to lower band.
-------------------------------------------------------------------------------------------------------------------------------------
#15 9/2/2004 1.025 .194 396 70 .088 -5 .029 .008
Success - DJI fell to lower band.
------------------------------------------------------------------------------------------------------------------------------------
#16 5/8/2006 1.025 .388 15 25 .034 -56 .256 .067
Success - DJI fell to lower band.
------------------------------------------------------------------------------------------------------------------------------------
5/16/2007 1.025 .648 (too high) 90 45 .149 -7 .627 .074
Limited Success - DJI fell to lower band, but it had risen considerably since this S9V.
-----------------------------------------------------------------------------------------------------------------------------------
#17 7/13/2007 1.026 .374 192 -91 .005 -15 .090 .113
Success - DJI fell back 10% in a month.
-----------------------------------------------------------------------------------------------------------------------------------
9/25/2007 (late) 1.025 .355 47 -117 .027 -39 .192 .031
Success - DJI did rise 4% before falling10% and marking bull market high.
-----------------------------------------------------------------------------------------------------------------------------------
#18 5/1/2008 1.029 .405 178 36 .047 -28 .082 .044
Success - Perfect Sell before beginning of bear market.
-----------------------------------------------------------------------------------------------------------------------------------
#19 8/5/2008 1.024 .403 91 136 .073 -87 .093 -.111
Success - Perfect Sell as bear market continued and DJI fell rapidly.
-----------------------------------------------------------------------------------------------------------------------------------
#20 5/18/2009 1.033 .54 334 63 -.005 -11 .047 .072
Failed - Premature... DJI went sidewise for a month and then resumed new bull market.
----------------------------------------------------------------------------------------------------------------------------------
#21 6/3/2009 1.027 .351 221 169 .008 -96 -.018 .282
Success - DJI quickly fell slightly below lower band.
----------------------------------------------------------------------------------------------------------------------------------
7/15/2009 1.028 .006 (too low) 177 221 .001 -50 -.11 .069
Failed - DJI began resumed powerful new bull market.
----------------------------------------------------------------------------------------------------------------------------------
6/16/2010 1.025 -.253 (too low) 12 2 -.013 -150 -.203 -.022
Success - DJI quickly fell below lower band.
----------------------------------------------------------------------------------------------------------------------------------
7/23/2011 1.031 .149 (too low) 272 96 .101 -90 .045 -.063
Success - DJI did rise 4% but then it fell below slightly lower band.
---------------------------------------------------------------------------------------------------------------------------------
6/15/2012 1.026 .161 (too low) 112 106 .058 -40 -,073 -.033
Failed - DJI fell only to 21-dma and then rose for 3 months
--------------------------------------------------------------------------------------------------------------------------------
#22 7/11/2013 1.028 .268 258 217 -.044 -25 .188 .053
Success - DJI fell to lower band.
-------------------------------------------------------------------------------------------------------------------------------
9/13/2013 1.025 .030 (too low) 31 84 -.035 -37 .016 .025
Success - DJI fell to lower band.
-------------------------------------------------------------------------------------------------------------------------------
Current internals 1.022 .095 (too low) 216 60 .054 -59 -.094 .024
===================================================
(C) 2011 William Schmidt, Ph.D.
7/27/2011
S9vs here occur when the DJI is above the 2.45% over the
21-dma with the
V-Indicator 0 or less and the annualized
rate of change of the
21-dma is between .40 and .60.
The level of the
P-Indicator, IP21 or ObvPct are not
factored in here.
Seasonality, however, is very important in
making this signal
useful for profitable short sales and
taking profits.
----------------------------------------------------------------------------------------------------------
Sell S9vs cannot be properly studied for the period
1929-1965.
This is because the necessary data before 1966 is not
available. NYSE Up and Down volume can only be estimated,
as I have for all the data before 1966, by employing the
ratio of NYSE advances to NYSE declines and total NYSE volume.
S9v Sell signals, as presented here, do duplicate many of
other, more regular S9s which are based on negative divergences
by the P-Indicator and IP21 from the DJI when it is at the
upper band. Many of the dates of these signals are the same
for our regular S9s.
The lesson here is that S9vs have an independent potency
in their own right, despite levels of the P-Indicator or the
V-Indicator, when used advisedly, as shown below, only in the
period from June to Septembers. In addition, S9vs have to be
mistrusted when the DJI is more than 5% over the 21-day ma,
as this often shows the market is taking off after a bear
market. See in the last table how each Sell S9v has all the
key values for the date of the signal shown:
DJI daily closing price
Last Price/21-dma of DJI closing prices
Annualized Rate of Change for 21-day ma
P-Indicator
P-Indicator Daily Change
IP21
V-Indicator
ObvPct
There were 59 "RAW" S9Vs. There were 21 instances
of the
DJI subsequently falling below the lower band in 3 months.
In 13 more cases, the DJI fell to the lower band and in
3 more cases it fell half way between the 21-dma and the
lower band. If short sales in these cases were all profitable,
Sell S9vs succeeded in 37 of 59 cases.
Subsequent declines to the 21-day ma would also have generated
profitable short-term trades in 4 more cases. So for a trader,
the success rate of an S9v would have been 41/59
In 18 cases, the DJI kept rising and a loss on a short sale
taken with the S9v would have occurred.
We can improve the success rate by taking only the
Sell S9vs in February and from May to September. In these
months there were 26 S9vs and only 2 losses. 12 of the
26 produced DJI declines below the lower band. In 8 cases
the
DJI fell to the lower band.
SEASONAL SELL S9vs:
1965-2011
There
were 19 S9Vs from May to September. Only 1
produced a loss, if one's minimum target was half way
between the 21-day ma and the 3.5% lower band.
9 of these 20 led to declines below the lower band.
7 resulted in declines to the lower band.
RAW SELL S9vs By Month and Subsequent
Action
----------------- Decline to -------------------
Loss
MA (MA+LB)/2 LB Below LB
N (total)
Jan 3
2
5
1996,1987,
1975
2000, 1997
Feb
1
1 3
5
1999
2011 (2002, 1997, 1980)
March 3
3
(2003, 1999, 1995)
April 2
1 3
6
1999, 1995
1992 (2011, 2008, 2001)
-------------------------------------------------------------------------------------------------
May
1
2
3
2009
(2008, 2006)
June
1
1
2009
July
1
4 1
6
2011
(2010,1999, 1982,1970) 1990
August 2
1
1 6
10
1982,1970
1996
2010 (2008, 2002, 2000-2, 1999, 1971)
Sept
1
1
1975
------------------------------------------------------------------------------------------------
Oct 1
3
1
6
2002,1998
2010-2, 1966
2007
Nov 3
1 1
5
2010, 1996, 1995
2000 2010
Dec 2
3 2
7
2003, 1995
(1999, 1987,1982) 1997,1973
============================================
17
4
3
13
21
N=58
RAW Sell S9vs by Year
in The 4-Year
Presidential Cycle
The year before the Presidential Election year was generally
a bad year to employ an S9v. 11 of 22 brought losses.
Despite
this, a 4 S9vs in July and August in the year before a Presidential
Election Year would all been profitably traded by a short seller.
In 2 of the 4 cases the DJI fell below the lower band.
7/5/2011
12569.87 Declined to ma
8/23/1999 11299.76 Declined
below Lower Band
7/9/1999 11193.69
Declined to lower band
8/26/1971 906.10
Rose another week and then Declined below Lower Band.
The year after
a Presidential Election was the best. There was only one loss
and 5 of the 11 brought declines below
the lower band.
----------------- Decline to -------------------
Loss MA (MA+LB)/2 LB Below LB
N (total)
Pres. Elect.
Year (PE) 2
1
2 7
12
PE +1
1
2
2 5
10
PE +2 4
1
5 4
12
PE +3 11
2
4 5
22
--------------------------------------------------------------------------------------------------
18 4 3
13 21
N=58
RAW Sell S9vs
59 Sell S9vs - 1965-2001
(As I remember the necessary data only started being
available in Barrons in September 1965. Some of the 1965
signals should probably be left out. This will have to be
checked. )
Date DJI la/ma ann-roc P Pch IP21 VI Opct Outcome
--------------------------------------------------------------------------------
7/21/2011 12724.41 1.025 .513 269 -16 .085 -51AR .005 ?
(1-5)
7/5/2011 12569.87 1.037 .412 239 57 -.034 -48AR .08 declined to ma
4/27/2011 12690.96 1.025 .475 307 69 .142 0 .311 Decline below LB
2/8/2011 12333.15 1.027 .559 297 57 .166 -7 .381
1 wk higher, then decline to LB
8/9/2010 10698.75 1.025 .572 477 -19 .246 -15 .047 decline to LB
7/26/2010 10542.43 1.041 .459 442 170 .166 -11 .037 1 wk higher,
then decline to LB
(6-10)
11/16/2009 10406.96 1.039 .489 26 135 .001 -146 .173 2 mo up and
then Decline below LB
10/22/2009 10081.31 1.026 .404 155 92 .073 -101 -.115 declined 1/2(ma+lb)
10/14/2009 10015.86 1.027 .406 246 11 .014 54 -.061 decline 1/2(ma+lb)
6/4/2009 8750.24 1.033 .478 316 92 .046 -73 .068 declined to LB
5/18/2009 8504.08 1.033 .54 335 63 -.005 -11 .045 decline to 21-dma
(11-15)
8/8/2008 11734.32 1.030 .529 91 70 .088 -81 .072 crash followed
Decline below LB
5/1/2008 13040.80 1.029 .405 178 36 .047 -28 .076 crash followed
Decline below LB
4/3/2008 12626.03 1.031 .401 3 77 .027 -144 .021 1 mo up,
then crash.Decline below LB
12/18/2007 13727.03 1.04 .416 33 50 .001 -82 .113
Decline below LB
10/2/2007 14047.31 1.032 .605 226 -87 .086 31 .257 1wk up.
Then Decline below LB
(16-20)
5/9/2006 11639.77 1.027 .547 110 94 .079 -6 .326 Decline below LB
12/16/2003 10129.56 1.029 .437 297 52 .039 -33 .204 LOSS.DJI rose to
10613.85 before falling below the LB to 10063.64 on 3/23/2003
3/17/2003 8141.92 1.04 .597 126 98 .117 -30 .207 LOSS..
1 wk rally, then declined to ma at 8145.77
10/18/2002 8322.40 1.066 .581 -167 79 .037 -190 .066 LOSS..
Rallied for 6 weeks before declined to LB at 8303.78 on 12/27/2002
8/16/2002 8778.06 1.042 .522 2 73 .134 -180 -.067 w wk higher
then Decline below LB
(21-25)
2/25/2002 10145.70 1.031 .424 52 18 .053 -162 .023 rallied 1 month and
then Decline below LB
4/17/2001 10216.73 1.041 .478 19 83 .115 -70 .175 rallied for 6 weeks
and then plunged in 9/11 panic.Decline below LB
11/6/2000 10971.21 1.049 .434 -89 58 .066 -77 .032 fell to the LB
8/22/2000 11139.15 1.027 .499 108 35 .023 -5 .389 rallied 1 wk more
and then Decline below LB
8/14/2000 11176.14 1.039 .403 32 18 -.004 -53 .22 rallied 2 weeks and
Decline below LB
(26-29)
1/14/2000 11722.98 1.03 .522 90 27 -.058 -28 .441 Decline below LB
12/28/1999 11476.71 1.026 .52 -315 1 -.052 -85 .157 fell to LB
8/23/1999 11299.76 1.04 .427 -292 66 .064 -74 -.041 Decline below LB
7/9/1999 11193.69 1.034 .555 69 39 .085 -6 .251 fell to lower band
(30-35)
A series of bad sells from October 98 to April 99.
4/29/1999 10173.03 1.026 .482 -7 5 -.008 -22 -.131 LOSS.. reached
11026.14 in a month before falling to LB at 10466.92 on 5/27
3/8/1999 9727.60 1.039 .539 -192 27 .052 -53 -.142 Big LOSS.
2/23/1999 9544.42 1.026 .543 -254 5 .065 -58 .04 fell to MA only.
10/22/1998 8533.14 1.061 .562 -4 -46 .06 -56 .204 Big LOSS.
12/3/1997 8032.01 1.04 .552 74 -63 .053 -16 .339 Fell to LB
2/18/1997 7067.46 1.035 .409 95 -5 .098 -3 .026 Decline below LB
(36-40)
1/10/1997 6703.79 1.035 .424 102 -11 .055 -5 .318 rise for 5 weeks and
then fell below LB to 6391.69 on 4/11/1997 Decline below LB
11/16/1996 6177.71 1.025 .417 45 62 .094 -3 .062 Big LOSS.
8/12/1996 5704.98 1.034 .42 76 8 .118 -7 .313 Decline to ma.
1/29/96 5304.98 1.029 .484 88 9 .198 -7 .183 Big LOSS.
11/16/95 4969.36 1.032 .475 -49 3 .11 -26 .215 Big LOSS.
3/24/95 4138.67 1.027 .40 -3 13 .137 -2 .327 Big LOSS.
(41-45)
12/27/1995 3861.69 1.028 .487 4 -36 .103 -12 .243 Big LOSS.
4/16/1992 3366.50 1.032 .41 -66 -11 .072 -11 .329 up slightly
for a month and then decline to LB
7/19/1990 2993.81 1.027 .41 0 -16 .065 -5 .274 Decline below LB
12/21/1987 1990.38 1.051 .599 26 55 .147 -1 .306 Fell to LB
1/7/1987 1993.95 1.033 .426 -1 157 .149 -3 .094 Big LOSS.
(46-50)
12/28/1982 1058.87 1.029 .597 17 -34 -.114 -1 -.057 Fell to LB
8/20/1982 869.29 1.074 .55 -1 46 -.06 -1 -.191 Big LOSS.
7/16/1982 828.67 1.025 .469 1 16 .119 -2 .166 Fell to LB
2/13/1980 903.84 1.028 .478 -26 1 -.01 -1 .202 Decline below LB
9/14/1975 838.31 1.026 .411 -61 44 -.023 -2 .193 Fell to LB
(51-55)
4/11/1975 789.50 1.033 .403 -46 37 .088 -1 -.05 LOSS.
1/2/1975 632.04 1.057 .579 -72 105 .017 -2 .247 Big LOSS.
12/27/1973 851.01 1.034 .482 -84 63 .016 -2 -.048 rose another week
and then Decline below LB
8/26/1971 906.10 1.041 .467 24 33 -.105 -1 .176 rose another week and
then Decline below LB
8/24/1970 759.58 1.048 .483 43 44 .111 -1 .102 Big LOSS.
There is a decline to (MA+LB)/2 or 747.47
(56-59)
7/17/1970 735.08 1.053 .52 -56 34 -.011 -2 .269 Fell to LB
10/27/1966 809.57 1.045 .44 -17 44 -.023 -6 .131 Fell to (MA+LB)/2
(9/17/1965 928.90 1.026 .455 85 -8 .065 -8 .282 Big LOSS.)<1>
<1>This case is excluded because ot was not based on acceptable data.
Superior results can be obtained for the period 1966-2011 by
1) only allowing Sell S9Vs between May and Augist.
2) requiring that the LA/MA be under 1.0425
This eliminates 2 losses (8/20/1982 and 8/24/1970) and 1 decline to the LB (17/1/70)
When IP21 was above .14, a decline only to the LB was likely.
8/9/2010 10698.75 1.025 .572 477 -19 .246 -15 .047 decline to LB
7/26/2010 10542.43 1.041 .459 442 170 .166 -11 .037 1 wk higher, then decline to LB
S9vs here occur when:
1) the DJI is 2.45% to 4.26% over the 21-dma
2) the V-Indicator 0 or less
3) and the annualized is .40 to .575
and only between May and September.
The level of the P-Indicator, IP21 or ObvPct are not
factored in here. Seasonality, however, is very important in
making this signal useful for profitable short sales and
taking profits.
Results in 19 cases:
1 decline to MA and then a 2.3% paper loss.
1 decline to MA (The final outcome here is not decided.
8 declines to LB (+42.1%)
9 declines below LB (+47.4%)
Conclusion:
Sell S9vs add little to the Peerless system of intermediate-term signals since 1966,
but they are a very useful supplemental Sell signal for traders. It may be, however that
the 2011 S9vs will play out so well, that the signals should be included
On an intermediate-term basis, adding them would have produced a +2.3% loss and
new gains of +2.6% and 5.2%. Perhaps, the 2011 S9vs will make this signal worth adding to
the regular Peerless system. The new gains from it, over and above the regular Peerless
still are only marginally convincing. But for traders, who want one more way to spot a
short-term reversal, the results are quite good. There is only 1 loss in 19 cases, 2.3%,
and only 6 of the 19 cases had a paper loss of more than 2%.
Paper Losses:
There was one +3% paper loss, five +2% paper losses and one 1% paper loss.
In 12 of 19 cases, the DJI fell immediately or so quickly that there was no paper loss
of more than 1/2%.
Date DJI la/ma ann-roc P Pch IP21 VI Opct Outcome
----------------------------------------------------------------------------
7/21/2011 12724.41   1.025  .513    269  -16  .085  -51  .005   ?(1-5)
  (1-5)
7/5/2011  12569.87   1.037  .412    239   57 -.034  -48  .08
                        declined to ma  NO PAPER LOSS  Still open...

5/2/2011  12807.36   1.028  .467    212  -50  .147  -17  .33
                  Decline below LB in six weeks.  NO PAPER LOSS
 There was no other Peerless sell here.  Peerless Gain = +5.9%


8/9/2010  10698.75   1.025  .572    477  -19  .246  -15  .047 decline to LB
There was no regular Peerless here.      then decline to LB in 6 weeks.
It would have gained an additional +4.0%       NO PAPER LOSS

7/26/2010 10542.43   1.041  .459    442  170  .166  -11  .037 1 wk higher,
There was no regular Peerless here.        then decline to LB in 5 weeks..
It would have gained an additional +2.6%        PAPER LOSS = 1%

6/4/2009   8750.24   1.033  .478    316   92  .046  -73 .068
Also a regular S9.            declined to LB in 5 weeks..NO PAPER LOSS

  (6-10)

5/18/2009  8504.08   1.033   .54    335   63 -.005  -11 .045
Peerless gave a better Sell S9 on 6/4/2009 at 8750.24
                          Initially declined to 21-dma
                 and then to lower band in 5 weeks   PAPER LOSS = 3%

8/8/2008   11734.32  1.030  .529     91   70  .088  -81 .072 crash followed
Peerless was already on a Sell S9 from 7/30/2002.
                          Decline below LB in 6 weeks, but fell much further. NO PAPER LOSS

5/1/2008   13040.80  1.029  .405    178   36  .047  -28 .076 crash followed
Also a regular S15.  Decline below LB in 5 weeks,but fell much further.NO PAPER LOSS


5/9/2006   11639.77  1.027  .547    110   94  .079   -6 .326  Decline below LB
Also a regular S9. Decline below LB in 5 weeks,but fell further.NO PAPER LOSS


8/16/2002   8778.06  1.042  .522      2   73  .134 -180 -.067 w wk higher
Peerless was already on a Sell S9 from 8/12/2002.
                                           Decline below LB in five weeks    PAPER LOSS = 2%
   (11-15)

8/22/2000 11139.15  1.027   .499    108   35  .023   -5  .389 rallied 1 wk more
          and then  Decline below LB in four weeks   PAPER LOSS = 2%
This would have reversed the existing Peerless Buy
slightly lower and earlier than Sell S4 right at the top.

8/14/2000 11176.14  1.039   .403     32   18 -.004  -53  .22 rallied 2 weeks and
This would have reversed the existing Peerless Buy
slightly lower and earlier than Sell S4 right at the top. PAPER LOSS = 2%
                    Decline below LB in five weeks

8/23/1999 11299.76  1.04    .427   -292   66  .064  -74 -.041
Also a regular S9.      Decline below LB in four weeks   NO PAPER LOSS

7/9/1999  11193.69  1.034   .555     69   39  .085   -6  .251
Peerless was already on a Sell. Fell to lower band in 3 weeks.NO PAPER LOSS.
Using Peerless to reverse this S9V would have brought a 7.1% gain.

8/12/1996  5704.98  1.034   .42      76    8  .118   -7  .313
            Decline to a little below ma.
  Using Peerless to reverse this S9V would have brought a 2.3% loss.
  Here the DJI refused to breakdown and instead made a classic flat-topped
  breakout into all-time high territory.  This is a bullish situation.
  The V-Indicator also turned positive for 3 weeks.  This is bullish.


   (16-19)
7/19/1990  2993.81  1.027   .41       0  -16  .065   -5  .274
Also a regular S9.     Decline below LB    NO PAPER LOSS

7/16/1982   828.67  1.025   .469      1   16  .119   -2  .166
Also a regular S9.     Fell to LB   NO PAPER LOSS

9/14/1975   838.31  1.026   .411    -61   44 -.023   -2  .193
Also a regular S9/S12.   Fell to LB  NO PAPER LOSS

8/26/1971   906.10  1.041   .467     24   33 -.105   -1  .176
         Rose another week and then Decline below LB in 8 weeks. PAPER LOSS = 2%
Also an S9 on 8/17/71 and regular S12 on 8/23/1971 and 8/31/71.

 Eliminated because of DJI being too far above the 21-dma:
                    LA/MA
8/20/1982   869.29  1.074   .55      -1   46 -.06    -1 -.191 Big LOSS.

8/24/1970   759.58  1.048   .483     43   44  .111   -1  .102 Big LOSS.
                            There is a decline to (MA+LB)/2 or 747.47

7/17/1970   735.08  1.053   .52     -56   34 -.011   -2  .269 Fell to LB
(16-19)
7/19/1990 2993.81 1.027 .41 0 -16 .065 -5 .274
Also a regular S9. Decline below LB NO PAPER LOSS
7/16/1982 828.67 1.025 .469 1 16 .119 -2 .166
Also a regular S9. Fell to LB NO PAPER LOSS
9/14/1975 838.31 1.026 .411 -61 44 -.023 -2 .193
Also a regular S9/S12. Fell to LB NO PAPER LOSS
8/26/1971 906.10 1.041 .467 24 33 -.105 -1 .176
Rose another week and then Decline below LB in 8 weeks. PAPER LOSS = 2%
Also an S9 on 8/17/71 and regular S12 on 8/23/1971 and 8/31/71.
Eliminated because of DJI being too far above the 21-dma:
LA/MA
8/20/1982 869.29 1.074 .55 -1 46 -.06 -1 -.191 Big LOSS.
8/24/1970 759.58 1.048 .483 43 44 .111 -1 .102 Big LOSS.
There is a decline to (MA+LB)/2 or 747.47
7/17/1970 735.08 1.053 .52 -56 34 -.011 -2 .269 Fell to LB