BUY B17 - Rising Trend Cases
Includes Judged Head and Shoulders Pattern
Rules.
(C) 2011 William Schmidt, Ph.D. - 6/17/2010
The Buy B17 signal takes place
when the DJI falls sufficienlty below the 21-day mvg.avg.
but still shows a nearly positive (or even positive Accumulation Index) and a fairly high
reading from the P-Indicator. There should be improvement from the previous low
readings for these indicators. The IP21 standards generally loosen as the DJI moves
down
from the 21-day ma. The DJI can be as much as 6.7% below the 21-day ma, but must be
at least 1.7% below it. Seasonal considerations are built into these
parameters which
make it easier to get a Buy signal in late October and November. B17s cannot appear
less than 12 trading days after a Sell S9.
There have been 52 cases of B17s in rising markets, occuring not more than 13.5% below
bull market's previous peak. The average gain was 8.8% and the median gain was
7%. There
were 3 losses and 3 gains of more than +20% and 18 gains of more than 10%.
There was only 1 June B17 signal and it was at the end of the month.
In 50 closed out Buy B17s, there were 19 cases of paper losses greater than 1%.
11 of these were more than 3% and 4 were more than 5%.
Buy B17 Paper Losses =>3%
Not included +2 (1% - 1951). 1953 (1.6%), 1959 (2%), 1976 (2%), 1986 (2%),
1990 2 (1% and 2%), 1999 (2%),
3/5/1935 3%
1/ 12/ 1939 7% loss
3/21/1939 5% loss
8/10/43 5% loss
2/13/46 7% loss
9/26/55 4% loss
2/5/57
3%
loss
9/9/59
4% loss
2/11/60
3% loss
12/9/80
3% loss
Where a head and shoulders (H/S) pattern appears, it seems best to wait for the neckline
to be tested and hold, or if is broken to wait for the DJI to have some headroom
before buying. If you see a potential head and shoulders pattern developing, the
judged Peerless Right Shoulder Apex rule should be applied. This involves selling
when the A/D Line turns down or its recent steep uptrendline is violated.
When the H/S neckline is violated, the minimum downside objective was usually reached.
This is calculated by taking the height of the pattern at its maximum and subtracting that
number from the point where the neckline is violated. In such cases, the simplest
and safest approach is to wait for the A/D Line downtrend to be broken after the
minimum downside objective has been reached. This usually occurs in a market
that is ready to rise quickly. So, hesitation can be somewhat costly.
All the cases of head and shoulders tops with rising market Buy B17s have their graphs
shown below.
The average gain is still 8.7% if only the automatic signals are used. There were 3
losses.
Using the judged head and shoulders pattern prevents all the bigger paper losses.
There were ten instances of B17s impacted by Head/Shoulders patterns. Study them
so that you can spot them.
Buy B17s by Month
No. Avg. Cases
Jan 2 5.6%
-2.0 13.2
Feb 9 5.6%
1.5 12.2 0.7 10.2
3.7 5.0 8.8 14.8 1.4
March 3 11.3%
18.6 -0.1 15.3
April 2 0.9%
-1.6 3.4
May 3 5.4%
6.6 5.9 3.7
June 1 11.3%
July 2
4.0%
2.3 5.7
Aug
3 7.2%
-0.5 9.2 14.0
Sept
9 10.4%
7.9 9.5 5.9
8.7 9.9 6.5 30.6 3.0 11.9
Oct
7 8.5%
5.3 12.0 10.3
4.6 6.5 7.5 13.4
Nov 6
16.0%
5.5 5.6 8.6
28.2 34.1 13.9
Dec 4
11.2%
18.5 3.5
14.4 8.4
Buy B17s: 1928-2011
=================
Date
DJIA
Gain
Paper Loss
at next Sell
1. 12/ 10/ 1928
263.9
+18.5%
none
la/ma = .94 21-dma roc=.119 P= -43 (+9) IP21= .01
V=-595 OP= .136 11% below top
2. 3/ 5/ 1935
100.1
+18.6%
3% loss
la/ma = .973 21-dma roc= -.185 P= -72 (-37)
IP21= -.042 10% below top
The Buy B17 occured as the DJI made a false breakdown below 5x tested support.
See chart below.
3. 1/ 12/ 1939
147.3
-2.0%
7% loss
Head/Shoulders
la/ma = .973 21-dma roc=
-.11 P= -12 (-25) IP21= .017 V= -45 OP =
.057 7% below top
Note the first head and shoulders in chart below. Using the rule
to sell on the right shoulder apex
of the head and shoulders pattern when the A/D Line uptrend was broken would
have meant
selling at 148.10 or at the next day's week opening. This would have
avoided an 8% decline
after the head and shoulders pattern's neckline support failed.
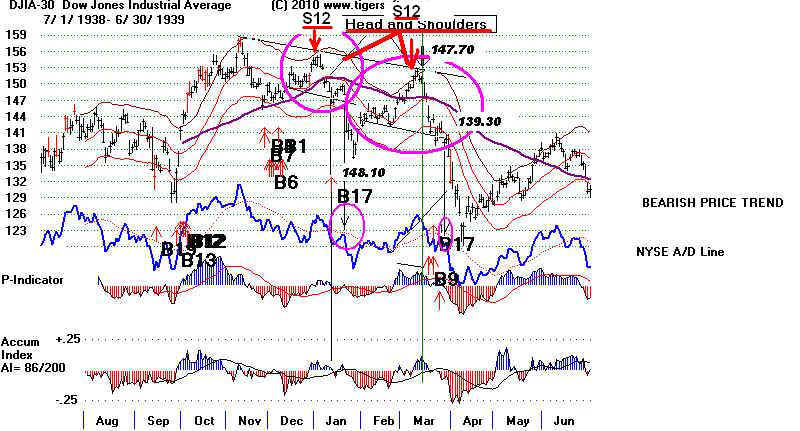
4. 3/21/1939
143.40
-0.1%
15%
loss Head/Shoulders
la/ma = .975
21-dma roc= -.121 P= 11 IP21= .001
12% below top
Note the second head and shoulders in chart below. Using the rule
to sell on the right shoulder apex
of the head and shoulders pattern when the A/D Line uptrend was broken would
have meant
selling at 139.30 on 3/28/1939 or at the next day's week opening. This
would have avoided a 9% decline
after the head and shoulders pattern's neckline support failed.
Note head and shoulders in chart.
5. 8/10/43
136.20
-0.5%
5% loss
la/ma = .971 21-dma roc= -.711
P= -38 IP21= -.202 7% below top
Using right shoulder HS apex rule and A/D Line
trend-break the position
should have been reversed at 138.50 on 11/1/1943. This woul dhave meant a small 1%
gain.
Head/Shoulders
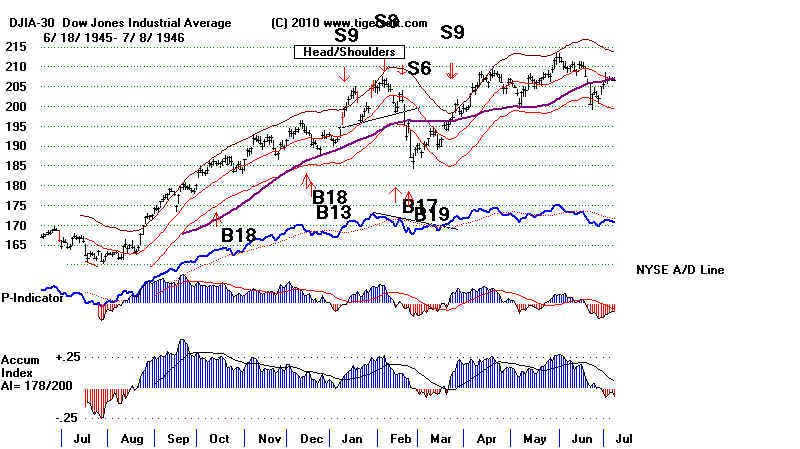
6. 2/13/46
198.7
+1.5%
7% loss
la/ma=.98 21-dma roc- .188 P= -35 IP21=
.115 Non-symmetrical HS Pattern followed.
In the chart below, note the minimum downside objective had been
reached when the
Buy B19 occurred.
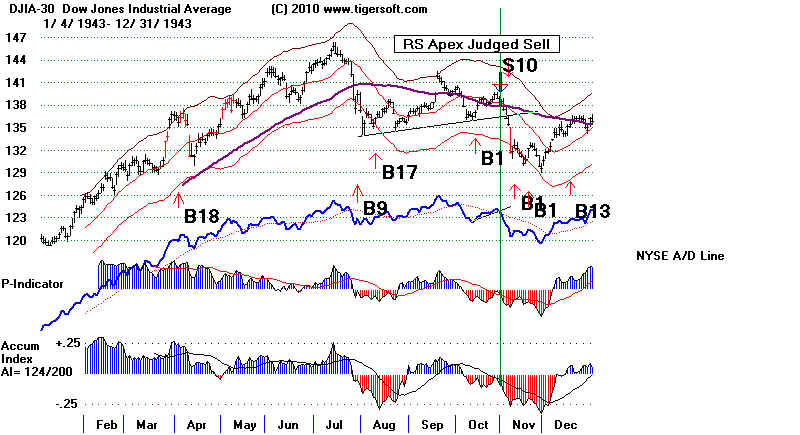
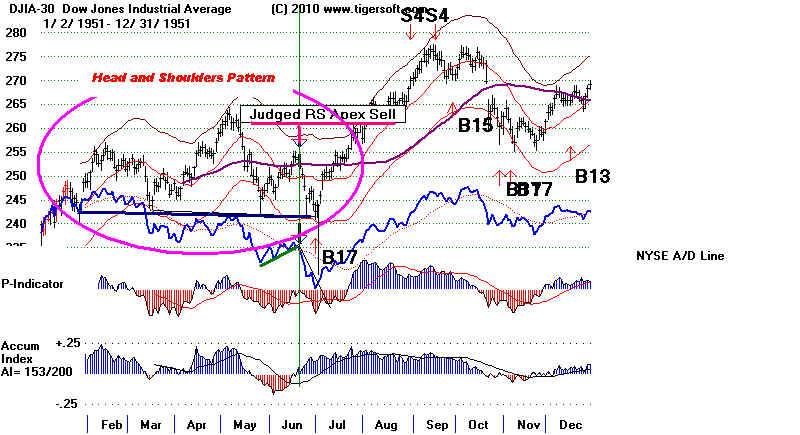
7. 6/29/51
242.60 +11.3%
none
la/ma=.973 21-dma roc- .339 P= -140 IP21= .102
uncompleted
non-symmetrical HS Pattern
In the chart below, see that prices rose when the neckline held and A/D Line
downtrend ended.
8. 10/29/51
260.4 +5.3%
1% paper loss
la/ma=.962
21-dma roc= -.478 P= -73 (+22) IP21=.019 6% down from high
9. 11/5/51
259.8
+5.5%
1% paper loss
la/ma=.97
21-dma roc= -.692 P= -105 (-1) IP21= -.035 -286 -.172 6% down from high
10. 4/7/53
275.2 -1.6% 1.6% paper loss
la/ma=.964 21-dma roc=.40 P=-2
IP21=-.018
11. 9/26/55
455.6 +7.9%
4% loss
la/ma=.957 21-dma roc= -.143 P=
-26 (-59) IP21= .08 -300
.169 6% down from high
12. 10/11/55
438.6 +12.0%
none
la/ma=.934 21-dma roc= -.958 P= -95 (-20) IP21= .018 -494 - .042 6% down from high
13. 10/18/55
448.6 +9.5%
none
la/ma=.974 21-dma roc= -.906 P= -58 (+14) IP21= .007 -424 - .146 6% down from high
14. 2/5/57
470
+10.3%
3% loss
la/ma=.982 21-dma roc= -.132 P= 12 IP21=-.064 8% down from high
15. 2/13/57
462.1 +12.2%
none
la/ma=.977 21-dma roc= -.606 P= -112
IP21=-.067 12% down from high
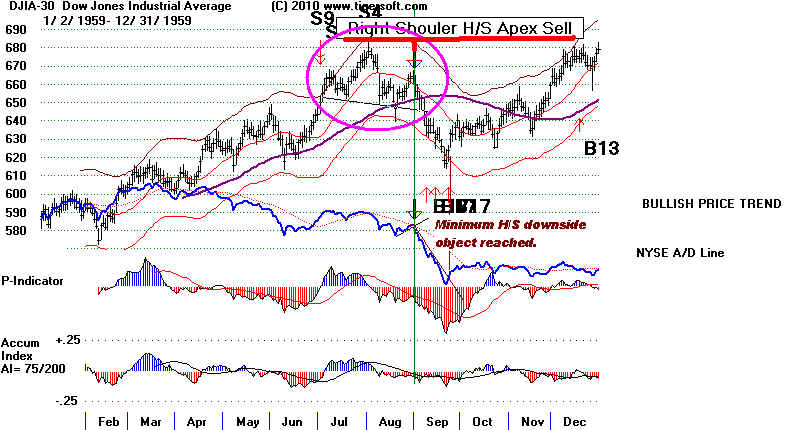
16. 9/9/59
637.6 +5.9%
4% paper loss Simultaneous H/S
la/ma=.974 21-dma roc=
-.294 P= 14 IP21=-.016
5% down from high
17. 9/15/59
630.8 +8.7%
2% loss Simultaneous H/S
la/ma=.971 21-dma roc= -.51 P= -172 IP21=-.045
5% down from high
18. 9/23/59
624
+9.9%
none Simultaneous H/S
la/ma=.972 21-dma roc= -.541 P= -203 IP21=-.085
8% down from high
In the chart below, see that it would
have been safer not use a Buy B17 until the minimum
downside objective has been reached.
That was the bottom. One could also have waited
for the steep A/D Line downtrend to be
violated to the upside to Buy again.
19. 2/11/60
618.60 +0.7%
3% loss
la/ma=.972 21-dma roc= -.705
P= -124 IP21= -.172 13% down from high
20. 11/13/67
859.74 +5.6%
none
la/ma=.975 21-dma roc=
-.719 P= -232 (+10) IP21= -.218 V=-19 OP=-.515 10% down from high
21 2/14/68
937.38 +10.2%
none 13% down from high
la/ma=.971 21-dma roc=
-.762 P= -260 (+10) IP21= -.178 V=-22 OP=-.425 10% down from high
2% paper loss
22 2/20/69
916.65
+3.7%
none 10% down from high
la/ma=.974 21-dma roc=
-.167 P= -139 (-31) IP21= .016 V=-2 OP= .115
23 2/28/69
905.21 .
+5.0%
none H/S Shoulders
la/ma=.97 21-dma roc=
-.423 P= -264 (-1) IP21= -.056 V=-3 OP= .041 10% down from high
-----------------------------------------------------------------------------------------------------------------------------------------------------
This signal should be considered void,
because there was a simultaneous Sell S10.
X 2/26/73
959.79
+1.4%
4% paper loss
la/ma=.972 21-dma roc= -.613
P=-260 (9) IP21= -.126 V= -4 OP= -.31
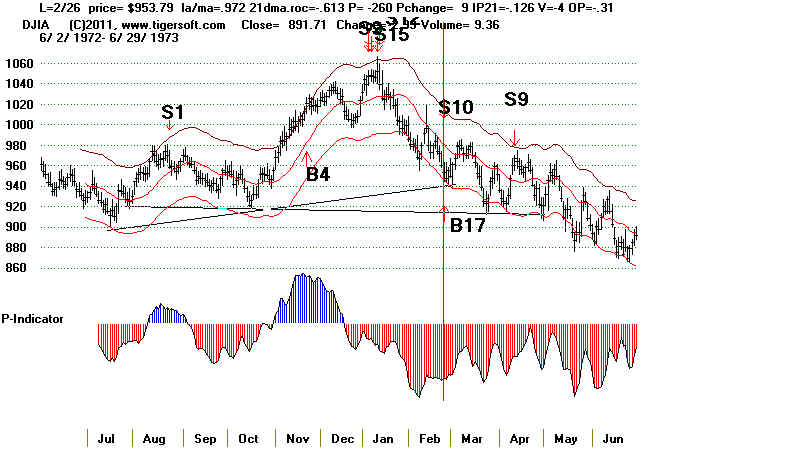
-----------------------------------------------------------------------------------------------------------------------------------------------------
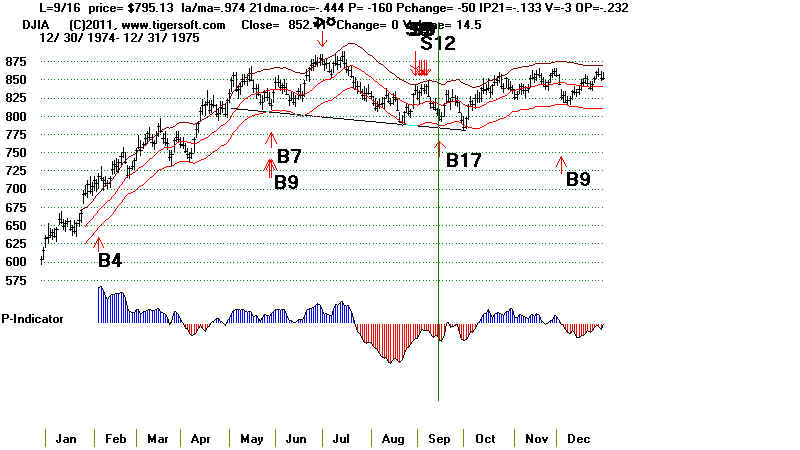
24 9/16/75
795.13
+6.5%
none incomplete H/S
Shoulders
la/ma=.974 21-dma roc=
-.444 P=-160 (-50)
IP21= -.133 V= -3 OP= -.232
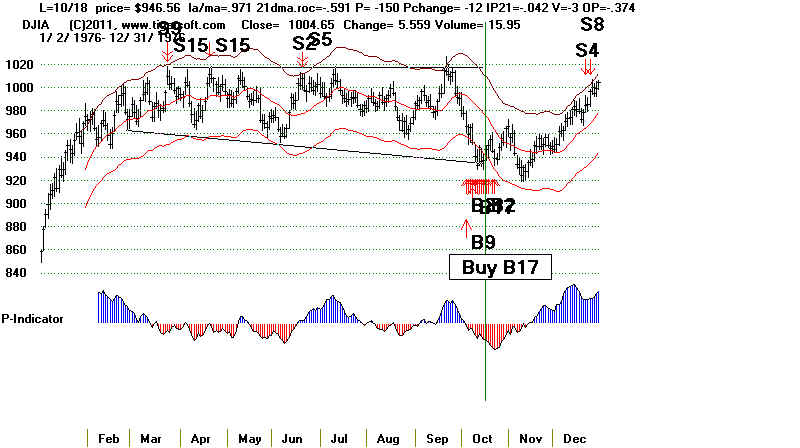
25 10/8/76
952.38
+4.6%
2%
Paper Loss
la/ma=.964 21-dma roc=
-.415 P=-150 (-12)
IP21= -.042 V= -3 OP= -.374
26 5/15/79
825.88
+6.6%
none H/S Shoulders
la/ma=.972 21-dma roc= -.484 P= -150 (+38)
IP21= -.107 V= -3 OP= .072
Minimum downside objective reached from
completed H/S Pattern.
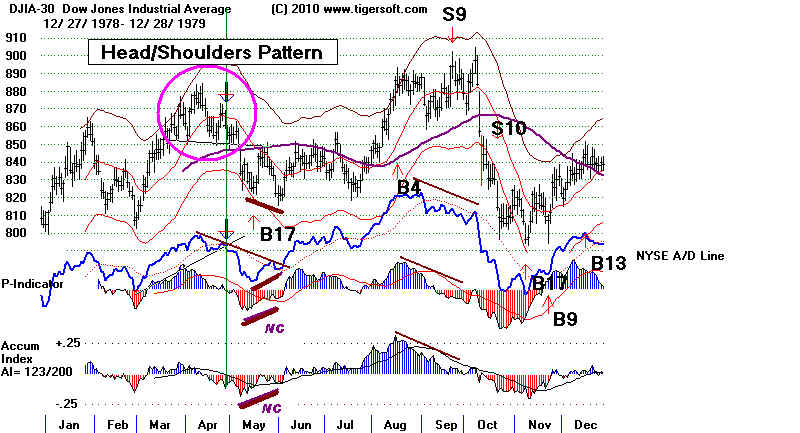
27 11/7/79
796.67
+8.6%
none
la/ma=.972 21-dma roc=
-.882 P=-275 (+34)
IP21= -.101 V= -9 OP= -.573
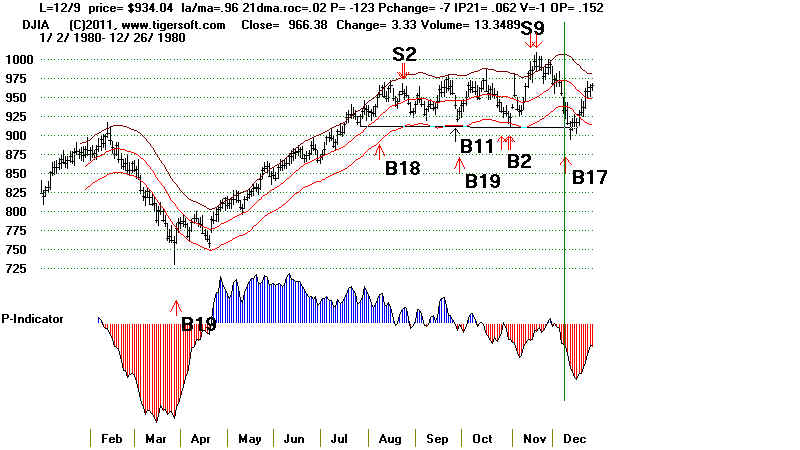
28 12/9/80
934.04
+3.5%
3% Paper Loss H/S
pattern
la/ma=.96 21-dma roc= -.02
P=-123 (-7)
IP21= -.062 V= -1 OP= -.152
Minimum downside objective reached from completed H/S Pattern.
DJI still needed to test best support line.
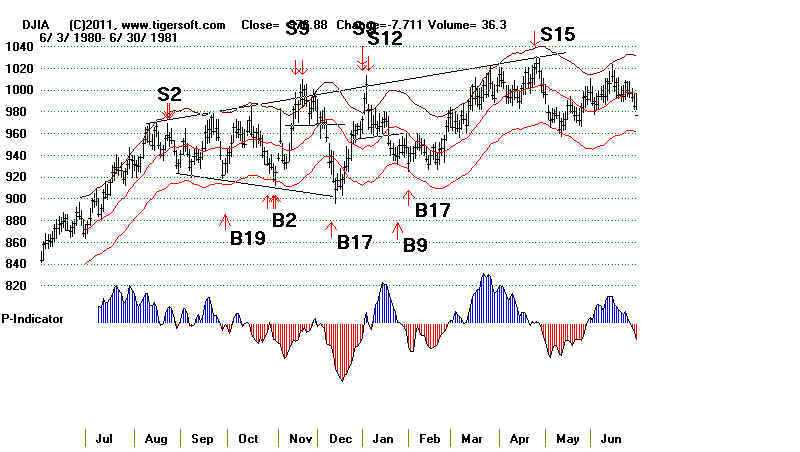
29 2/2/81
932.25
+8.8%
none H/S pattern
la/ma=.971 21-dma roc=
-.501 P= -120 IP21= -.005
Minimum downside objective reached from
completed H/S Pattern.
30 8/9/83
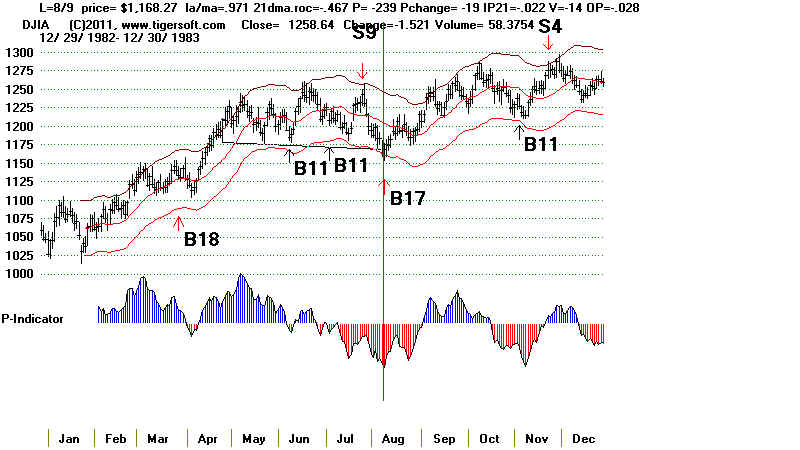
1168.27 .
+9.2%
none
la/ma=.971 21-dma roc=
-.467 P--239 (-19) IP21- .022
V= -14 OP= -.028
Supoprt line held after B17 and fifth test.
31 7/14/86
1973.45
+2.3%
2%
6% down from high
la/ma=.962 21-dma roc=
-.285
32 9/11/86
1792.89
+30.6%
none
la/ma=.955 21-dma roc= -.27
33 11/19/86
1826.63
+28.2%
none
la/ma=.98 21-dma roc= .134 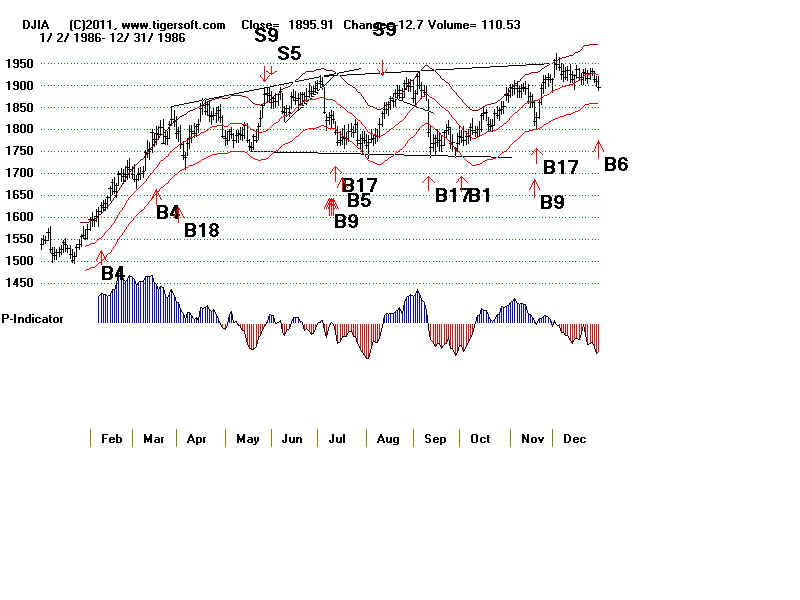
34 5/19/87
2221.28
+5.9%
none
la/ma=.97 21-dma roc=
-.256
35 9/4/87
2561.38
+3.0%
none
la/ma=.963 21-dma roc=
-.147
36 11/11/88
2067.03
+34.1%
none
la/ma=.963 21-dma roc=
-.367
37 10/17/89
2638.73
+6.5%
1%
la/ma=.974 21-dma roc=
-.214
38 10/26/89
2613.73
+7.5%
none
la/ma=.967 21-dma roc=
-.261
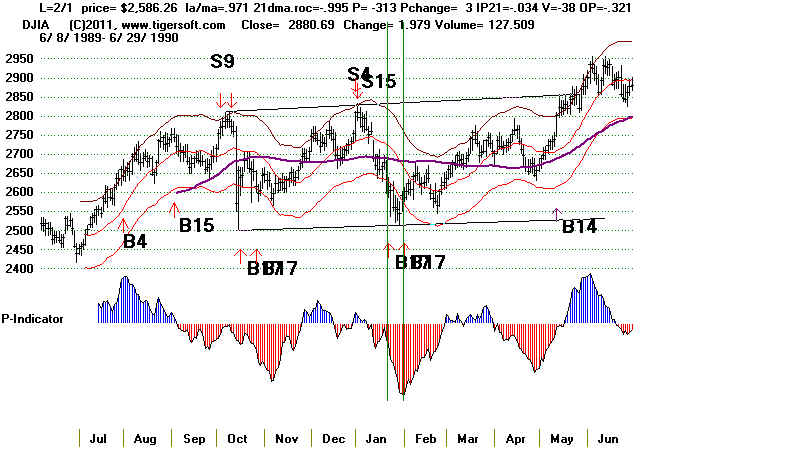
39 1/23/90
2615.32 .
+13.2%
2%
paper loss
la/ma=.961 21-dma roc=
-.331 P= -93 ( -24
) IP21= + .03 V= -19 OP= .02
40 2/1/1990
2586.26
+14.8%
1%
paper loss
la/ma=.971 21-dma roc=
-.995 P= -313 (+3 )
IP21= - .034 V= -38 OP= - .321
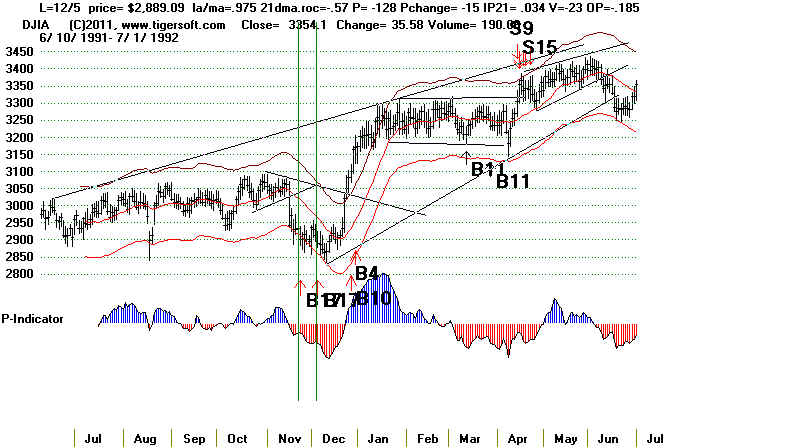
41 11/22/91
2902.73
+13.9%
none
la/ma=.962 21-dma roc=
-.447 P= -62
(-5 ) IP21= .055 V= -16 OP= - .123
42 12/5/91
2889.09
+14.4%
none
la/ma=.975 21-dma roc=
-.57 P= -128 (-15 )
IP21= .034 V= -23 OP= - .185
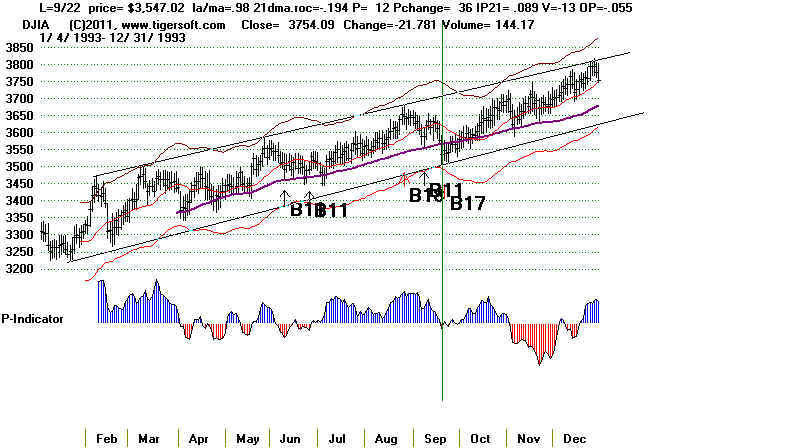
43 9/22/93
3547.02
+11.9%
none
la/ma=.98 21-dma roc=
-.194 P= +12 (+36 )
IP21= - .089 V= -13 OP= - .055
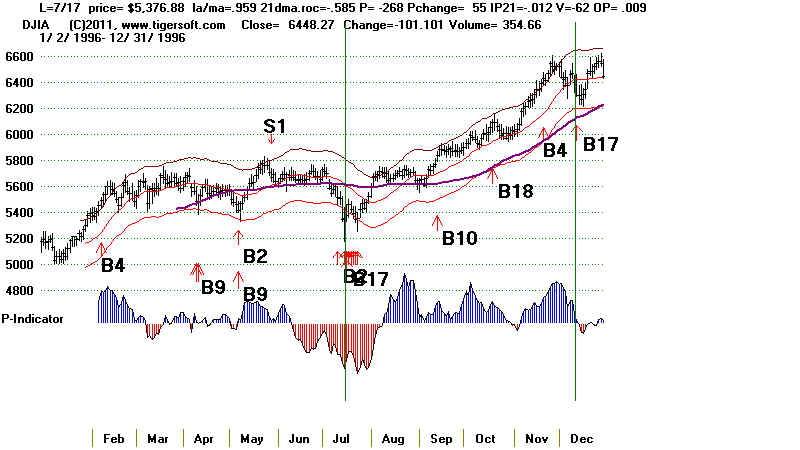
44 7/17/96
5376.88
+5.7%
none
la/ma=.959 21-dma roc=
-.585 P= -268 (+55 )
IP21= - .012 V= -62 OP= .009
45 12/12/96
6303.71
+8.4%
none
la/ma=.981 21-dma roc=
.07 P= 22 (-47)
IP21= .083 V= -20 OP= .055
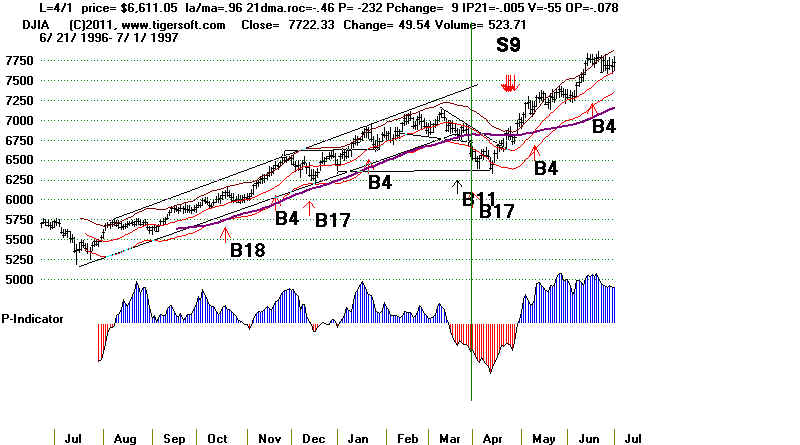
46 4/1/97
6611.05
+3.4%
none H/S pattern
la/ma=.960 21-dma roc=
-.46 P=-232 (+9)
IP21= -.005 V= -55 OP= -.078
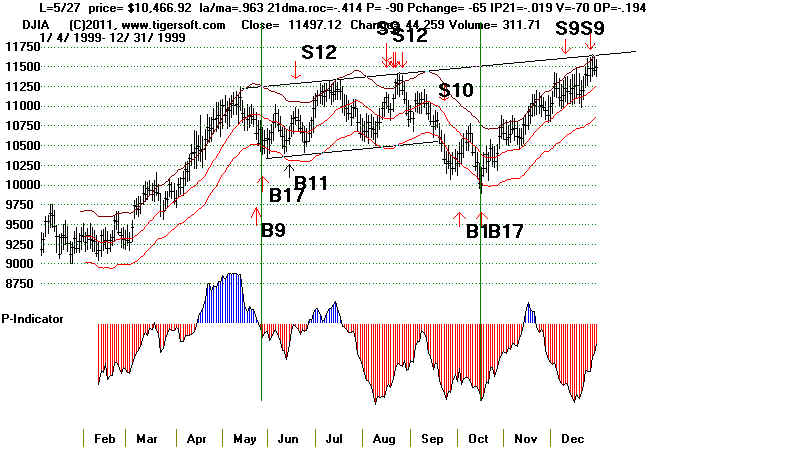
47 5/27/99
10466.32
+3.7%
2% paper loss
la/ma=.963 21-dma roc=
-.414 P=-90 (-65)
IP21= -.019 V= -70 OP= -.194
48 10/18/99
10116.28
+13.4%
none
la/ma=.973 21-dma roc=
-.785 P= -505 (-60) IP21= -.075 V= -159 OP= -229
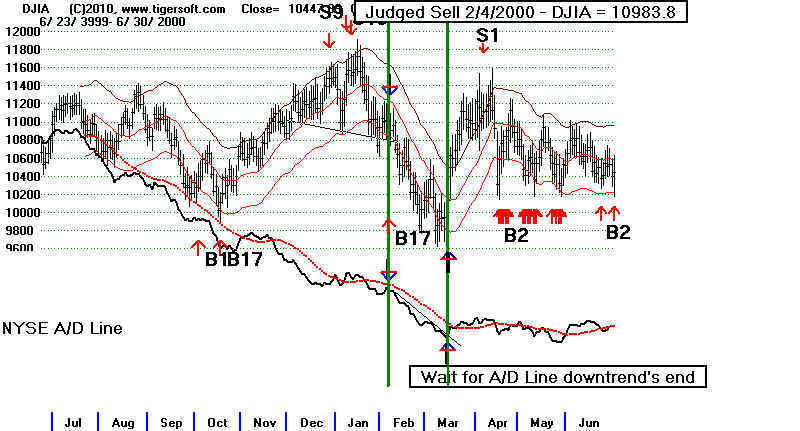
49 2/4/2000
10963.8
+1.4%
11% paper
loss H/S pattern
la/ma=.975 21-dma roc=
-.168 P= -53 IP21= -.102
See in the chart below that a judged Sell based on
the right shoulder apex being
clinched as A/D
Line turned down would have also have occurred on 2/4/2000.
This should have
negated the Buy B17. The DJI subsequently fell 11%
more with the
Head and Shoulders pattern playing out its minimum downside
objective.
Later buying when the A/D Line downtrend was broken would
have avoided the
11% paper loss and meant buying on 3/15/2000 at 10131.41
or at the next
day's opening.
50 3/2/07
12114.1
+15.3%
none
la/ma=.962 21-dma roc=
-.479 P= 77 (-82) IP21= -.022 V= -202 OP= -.089
51 8/20/10
10721.21
+14% 12045 on 6/8/2011 at H/S pattern
neckline.
la/ma=.983 21-dma roc= -.12 P= -36 (-77) IP21= .146 V= -108 OP= .002
52 6/8/11
12048.94
open
la/ma=.97 21-dma roc= -.608 P= -157 (-127) IP21= -.067 V= -203 OP= -.217
-----------------------------------------------------------------------------------------------------------------