A Very High Daily Ratio of Advancing Stocks' Volume on
the NYSE to Declining Stocks' Volume.
There were 34 Buy B14s since 2013. The average gain was 8.7%.
There were only 2 losses. The biggest avg. gains tended to come in the year
after the Presidential Election ( 12.4% ), in June (12.4%) and from
December to January. The smallest average B12 gains came in the third year
of the Presidential cycle (only +5.2%), in April, May, October and November (+2.6%).
Buy B14s taking place after the 20th of the month were also relatively small,
averaging only 4.9%.
BUY B14s:
1928-2013 19400612 B14 121.5 .112 fell back to 119.7
1.03 -1.614 -54 76 -268 -.126 -427 -.127 -.181
--------------------------------------------------------------------
19440906 B14 144.4 .136 fell to 142.9
.983 -.073 85 29 456 -.029 76 .022 .019
--------------------------------------------------------------------
19450308 B14 158.9 .032 fell to 152.3 head/shoulders
1.002 .263 150 32 681 .168 179 .449 .078
--------------------------------------------------------------------
19461009 B14 163.1 .126 no paper loss
.956 .293 -1 66 -4 .012 -45 -.124 -.214
--------------------------------------------------------------------
19470307 B14 177.1 .043 fell to 163.6 head/shoulders
.979 -.355 -14 33 -59 .09 -61 -.195 .053
--------------------------------------------------------------------
19480909 B14 180.3 .053 fell to 176
.989 .02 70 63 298 11 17 .037 -.062
--------------------------------------------------------------------
19490606 B14 165.2 .335 fell to 161.6
.959 -.765 -100 33 -389 -.15 -.128 -.297 -.05
--------------------------------------------------------------------
19530609 B14 263.4 .134 fell to 257.7
.963 -.668 -88 34 -301 -.083 -.143 .433 -.076
--------------------------------------------------------------------
19680408 B14 884.42 .043 no paper loss
1.047 .695 97 43 224 .042 13 .436 -.017
--------------------------------------------------------------------
19820817 B14 831.24 .272 no paper loss
1.029 .076 -66 65 -128 -.064 -5 -.321 -.031
--------------------------------------------------------------------
19870102 B14 1933.49 .244 no paper loss
1.005 -.137 -161 17 -317 .036 -19 -.261 .093
--------------------------------------------------------------------
19880531 B14 2031.12 .075 fell to 1989.33
1.021 -.007 -87 41 -149 .024 -4 .019 .003
--------------------------------------------------------------------
19900511 B14 2801.58 .06 no paper loss
1.034 .316 -16 46 -31 .085 3 .327 .061
--------------------------------------------------------------------
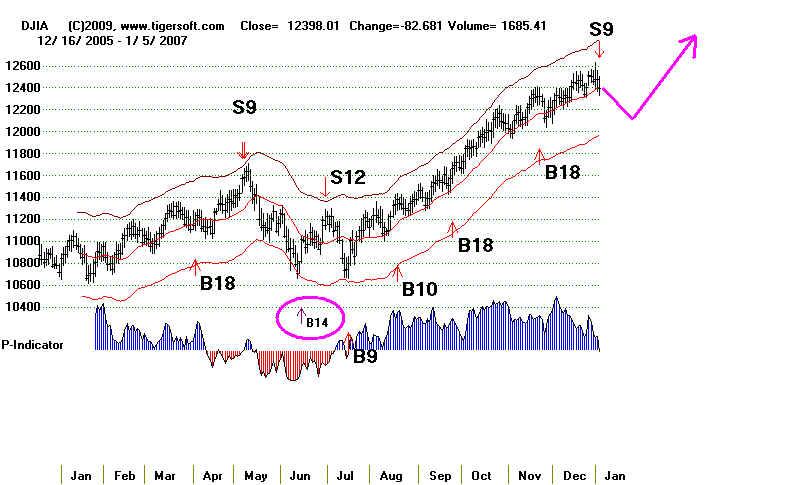
20060119 B14 10880.71 .064 fell to 10667.39
1.00 .006 360 112 332 .02 -24 -.017 .057
--------------------------------------------------------------------
20060615 B14 11015.19 .126 fell to 10739.35
.996 -.435 -179 92 -165 -.063 -317 -.108 -.013
--------------------------------------------------------------------
20070829 B14 13289.29 .04 fell to 13113.38
1.004 .07 -69 139 -63 .053 -157 -.039 -.018
--------------------------------------------------------------------
20070918 B14 13739.39 .006 no paper loss
1.033 .592 330 9 305 .116 48 .164 .007
--------------------------------------------------------------------
20071128 B14 13289.45 .025 no paper loss
1.004 -.521 -420 92 -378 -.092 -313 -.129 -.003
--------------------------------------------------------------------
20080318 B14 12392.66 .013 fell to 12099.66
1.011 .043 -329 138 -297 .09 -263 -.03 -.081
--------------------------------------------------------------------
20090312 B14 7170.06 .174 no paper loss
.998 -1.186 -493 227 -459 -.11 -317 -.232 -.17
--------------------------------------------------------------------
X 20090504 B14 8426.74 -.001 no paper loss
1.049 .667 554 -7 516 .115 153 .164 .034
Not allowed in early May. Too many declines here.
--------------------------------------------------------------------
20090715 B14 8616.21 .192 no paper loss
1.028 .006 177 221 165 .001 -50 -.11 .069
--------------------------------------------------------------------
20091109 B14 10226.94 .004 mo paper loss
1.029 .434 -47 67 -44 .051 -157 .10 .091
--------------------------------------------------------------------
X 20100510 B14 10795.14 -.035 fell to 9816.49
.98 -.229 -50 92 -48 .055 -320 .145 .078
Not allowed in early May. Too many declines here.
--------------------------------------------------------------------
20100527 B14 10258.99 .015 fell to 9816.49
.97 -.992 -377 99 -366 -.007 -420 -.377 -.012
--------------------------------------------------------------------
20100602 B14 10249.54 .016 fell to 9816.49
.982 -1.025 -487 26 -473 -.008 -476 -.449 -.015
---------------------------------------------------------------------
20100610 B14 10172.53 .023 no paper loss
.994 -.668 -248 95 -240 -.049 -267 -265 -.038
---------------------------------------------------------------------
20100707 B14 10018.28 .052 no paper loss
.99 .238 86 175 84 .006 -90 -.089 -.088
---------------------------------------------------------------------
20100901 B14 10269.47 .247 no paper loss
.995 -.423 -41 138 -40 .048 -171 -.199 .024
---------------------------------------------------------------------
20110815 B14 11482.9 .007 fell to 10817.65
.964 -.992 -317 91 -316 -.089 -285 -.142 -.096
---------------------------------------------------------------------
20110829 B14 11539.25 .002 no paper loss
1.021 -.635 -23 170 -23 -.032 -245 .08 -.07
---------------------------------------------------------------------
20111010 B14 11433.18 .058 no paper loss
1.03 .474 101 221 100 .104 -40 .305 -.097
--------------------------------------------------------------------
X20111027 B14 12208.55 -.009 fell to 11231.78
1.07 1.255 561 208 559 .172 138 .263 -.008
too high
---------------------------------------------------------------------
20111128 B14 11523.01 .05 no paper loss
.974 -.688 -269 -11 -268 -.052 -199 -.058 .033
---------------------------------------------------------------------
20120727 B14 13075.66 .038 fell to 12878.88
1.023 .418 266 14 266 .226 -40 -.146 -.002
---------------------------------------------------------------------
20121231 B14 13104.14 .158 no paper loss
.997 .075 98 42 98 .011 -21 -.029 -.027
--------------------------------------------------------------------
No. = .087
12 7 7 6 2 PE 8 .079 PE +1 7 .124 PE +2 10 .100 PE +3 9 .052 January 2 .154 February - ---- March 4 .066 April 1 .043 May 4 .037 June 6 .124 July 3 .094 August 3 .106 September 4 .111 October 3 .058 November 3 .026 December 1 .158 1-10 14 .105 11-20 12 .092 21-31 8 .049 |
--------------------------------------------------------------------------------------------------------------------------
(last revised 7/28/2012)
This has been a Peerless signal for a long
time. It relies on a very
high DAILY ratio of advancing stocks' volume to declining
stocks'
volume. But more recently, as computerized program trading has become
more
and more dominant, with its very aggressive, short-term and
blanket-trading of large number of stocks, Buy B14s have proifferated
and
lost their potency. We have to treat separately all the B14s since
2004.
The B14s since 2004 gained only 3.9% on average in 21 cases. There
were only two small losses, but only 33% (7 cases) brought gains of
more than 5% on the DJI at the next Peerless Sell. Where the DJI is
2% or more over the 21-day ma, 4 of the 5 Buy B14s gained less than 1%.
In this exception, a new bull market leg was starting and the DJI gained
15.5%. In the last 10 years, the Buy B14 is often soon followed by Sell
at
the upper band.
B14s: 2005 - Present
1/19/2006  10880.71 Gain= .064
la/ma       MA-ROC             P-I   P-Ich        IP21           V-I         OP21
1.00   .006     360 112   .02   -24   -.017
      DJI fell to 10667 on 1/20 and then rose.
----------------------------------------------------------------------------
6/15/2006  11015.19 Gain= .012
la/ma       MA-ROC             P-I    P-Ich        IP21            V-I          OP21
.996  -.435    -179 92   -.063   -317 -.104
      DJI rose to 11200 and fell back to 10739.35 and rallied.
---------------------------------------------------------------------------
8/29/2007  13289.29 Gain=  .035
la/ma       MA-ROC           P-I    P-Ich          IP21            V-I           OP21
1.004  .07     -69  139   .103    370   .209
      DJI rose to 14156 and then started a bear market.
---------------------------------------------------------------------------
9/18/2007  13739.39 Gain=  .001
la/ma       MA-ROC           P-I       P-Ich          IP21            V-I         OP21
1.033  .592    339     9   .116    48    .156
       DJI rose to 14156 and then started a bear market.
---------------------------------------------------------------------------
11/28/2007 13289.45 Gain=  .025
la/ma       MA-ROC           P-I       P-Ich          IP21            V-I          OP21
1.004  -.521  -420   92   -.092   -313     -.213
       DJI rallied to upper band.
--------------------------------------------------------------------------

3/18/2008  12392.66  Gain=  .013
la/ma       MA-ROC           P-I       P-Ich          IP21            V-I          OP21
1.011  .042   -327  138    .088   -263   -.029
       DJI rallied to upper band
----------------------------------------------------------------------------
3/12/2009  7170.06 Gain=  .186  (using normal Peerless signals)
la/ma       MA-ROC           P-I       P-Ich          IP21            V-I            OP21
.998  -1.186  -496  227  -.113    -317   -.221
       DJI moved higher for 6 weeks.
       No paper loss.
---------------------------------------------------------------------------
5/4/2009   8426.74 Gain =  .009
la/ma       MA-ROC           P-I       P-Ich          IP21            V-I            OP21
1.049  .667     553  -7   .115    153  .157
      DJI moved to 8800 (4% higher) but fell after S9s and S8s.
------------------------------------------------------------------------
7/15/2009   8616.21  Gain=  .155
la/ma       MA-ROC           P-I       P-Ich          IP21            V-I           OP21
1.028  .006    177   221   .001   -50    -.11
--------------------------------------------------------------------------
11/9/2009   10226.94 Gain=  .004
la/ma       MA-ROC           P-I       P-Ich          IP21            V-I           OP21
1.029  .434    -47   67    .051   -157   .095
       DJI moved up only 1% higher and then gave a Sell S9
It did not retreat to the lower band until January.
---------------------------------------------------------------------------

5/10/2010   10785.14 Gain= -.035
la/ma       MA-ROC           P-I       P-Ich          IP21            V-I          OP21
.998  -.229    -50   82    .055   -320   .14
       DJI rallied only to resistance of falling 21-dma
and fell sharply.
------------------------------------------------------------------------
5/27/2010   10258.99 Gain=  .015
la/ma       MA-ROC           P-I       P-Ich          IP21            V-I          OP21
.970  -.882    -377   99  -.007   -420   -.365
------------------------------------------------------------------------
6/2/2010   10249.54 Gain=  .016
la/ma       MA-ROC           P-I       P-Ich          IP21            V-I           OP21
.982 -1.025     487   26   -.008  -476  -.435
  DJI needed to retest lows before rallying to upper band.
------------------------------------------------------------------------
6/10/2010   10172.53 Gain=  .023
la/ma       MA-ROC           P-I       P-Ich          IP21            V-I           OP21
.994  -.668    -240  95    -.049  -267  -.256
   DJI rallied to the upper band and S9/S12.
------------------------------------------------------------------------
X   6/15/2010   10404.77 Gain=  .0
la/ma       MA-ROC           P-I       P-Ich          IP21            V-I           OP21
1.029  .434    -47   67    .051   -157   .095
   This signal cancelled by Sell S12 the same day.
--------------------------------------------------------------------------

9/1/2010   10269.47 Gain= .103
la/ma       MA-ROC           P-I       P-Ich          IP21            V-I           OP21
.995  -.423    -41   138   .048  -171  -.189
   DJI rallied to the upper band and S9/S12.
   Cancelled by simultaneous Sell S12.
------------------------------------------------------------------------
8/15/2011   10482.9 Gain= .007
la/ma       MA-ROC           P-I       P-Ich          IP21            V-I           OP21
.995  -.423    -41   138   .048  -171  -.189
   DJI rallied to the upper band and S9/S12.
   Cancelled by simultaneous Sell S12.
------------------------------------------------------------------------
8/29/2011   11539.25 Gain= .002
la/ma       MA-ROC           P-I         P-Ich          IP21            V-I           OP21
1.021  -.635    -23   170  -.032   .245   .078
   DJI rallied to the upper band and S9/S12.
   Cancelled by simultaneous Sell S12.
------------------------------------------------------------------------
10/10/2011   11433.18 Gain= .058
la/ma       MA-ROC           P-I       P-Ich          IP21            V-I           OP21
1.003  .474    101   221   .104   -40    .294
   DJI rallied above the upper band.
------------------------------------------------------------------------
X   10/27/2011   11208.55 Gain= -.009
la/ma       MA-ROC           P-I       P-Ich          IP21            V-I           OP21
1.07  1.255    561  208   .172    138   .248
   DJI way too overbought to trust this signal.
   It will be taken out in a future version of software.
------------------------------------------------------------------------

11/28/2011   11523.01 Gain= .05
la/ma       MA-ROC           P-I         P-Ich          IP21            V-I           OP21
.974  -.688    -269   -11  -.053  -199   -.054
   DJI rallied to the upper band and S9/S12.
   Cancelled by simultaneous Sell S12.
------------------------------------------------------------------------
11/30/2011   12045.68 Gain= .004
la/ma       MA-ROC        P-I       P-Ich          IP21            V-I           OP21
1.02  .091    -70  +202   .055   -94    .075
   DJI rallied to the upper band and S9/S12.
   Cancelled by simultaneous Sell S12.
------------------------------------------------------------------------
7/27/2012   13075.66 Gain= open
la/ma       MA-ROC         P-I       P-Ich          IP21            V-I           OP21
1.023  .418    266  +14   .266    -40   -.133
------------------------------------------------------------------------
               21 closed out cases.  Avg Gain = 3.9%

========================================================================

                B14s between 1965 and 2010


                    As a whole, these B14s are profitable more than 85% of the time.  For all of them,
                    they average gain is +10.6% at the time of the next reversal.   Summer
                    Buy B14s are particularly bullish.

                    Overall, in 3 of the 28 cases, there were paper loss of more than 7%.
                    In one case, January 1982, a paper loss 14% would have been reached.
                   So, they should prove themselves by producing a further rally quickly.

                  The necessary data for the Buy B14 signal did not become available until
                    the end of 1965.  We can try to recreate the signal using advances
                    and declines in this period, but the signals' effectiveness in this period
                    must be considered separately.  As such, this signal did not occur
                    in the period 1929-1941.

       The Buy B14 in June, July and August were clearly more potent than they
          were from September to March.   5 of the 7 Buy B14s between June and August
          gained more than 21.5%.  The one Buy B14 signal in early September (the 6th)
          achieved a gain of 16.5%.   After the 6th of September, there was only one
          gain of more than 20% until April.

          Month    Number of Cases   Avg. Gain
          ----------     --------------------------   ---------------
          January                5                       7.5%
          February              0
           March                  5                        2.9%
           April                     2                        26.9%   (49.5, ,043)
           May                      2                         3.6%
           June                     3                       29.0%   (30.3, 55.5, 1.2)
           July                      1                        15.5%
           August                3                         17.4% (27.2, 21.6, 3.5)
           September          3                        6.6%
           October                3                        3.0%
           November           1                        2.5%
           December           0
           ----------------------------------------------------
                                       28                         10.6%

               In 7 of 15 cases when the annualized rate of change
                     was positive, the gains were minimal (under 2.5%) or there
                     were losses.


         There have been 28 B14s since 1942.  The average gain was
              10.6%, but in 12 cases the gain was less than 5%.  The average
              gain was this big because of the 8 cases in which the B14s
              gained more than 18% at the time of the  next Peerless Sell.
              Only 3 of the B14s would have been sold at a loss.    In 9 cases, the DJI
              fell back more than 1% before rallying.  In 4 cases it fell back
              more than 5%.  In 7 of 10 cases where the DJI was more than 1%
              below the 21-day ma when the signal occurred,   the DJI needed to
              retreat to the lower band before rallying.

             The most bullish B14s took place when the Accum. Index
             was below -.08.   In 6 of 7 cases, a bull market was about to begin,
             though the odds then were 2:1 that the lower band would have
              to be tested before the bull market began.

                 B14 signal            Subsequent low    Pct Gain
                    4/9/1942       99.7                92.90            (-.085) new bull market began
                    6/6/1949      165.2              161.60                 +.303
                    6/9/1953       263.4             255.50                 +.55
                    8/17/1982     831.24          only up                +.272
                    8/20/1982     869.29          only up                +.216
                    6/15/2006   11015.19      10739                rallied to 13800 (+24%)
                    11/28/2007 13289.45      only up             small rally to upper band

          Buy B14s that occurred within a few days of each other were quite bullish.
          But in the single case where they were separated by 20 days, the gain
          was only +.1% for the second occurrence.

Case 1
8/17/1982  831.24 1.029     .076   -66  65    -.064    -5     -.306  .272
     DJI roared ahead in new bull market.
--------------------------------------------------------------------------
8/20/1982  869.29 1.074      .55     -1  46    -.06    -1       -.192  .216
      DJI roared ahead in new bull market.
---------------------------------------------------------------------------

Case 2
1/2/1987   1933.49 1.005  -.137    -161 17    .036   -19     -.25    .211
      DJI roared ahead in resumed market.
----------------------------------------------------------------------------
1/5/1987   1971.32 1.024   .149    -88  73    .094   -13       -.121   .188
      DJI roared ahead in resumed bull market.
-----------------------------------------------------------------------------

Case 3
8/29/2007  13289.29 1.004 .07     -69  139   .103    370        .209  .035
      DJI rose to 14156 and then started a bear market.
---------------------------------------------------------------------------
9/18/2007  13739.39 1.033  .592     339  9    .116    48         .156  .001
       DJI rose to 14156 and then started a bear market.
---------------------------------------------------------------------------
There have been 28 B14s since 1942. The average gain was
10.6%, but in 12 cases the gain was less than 5%. The average
gain was this big because of the 8 cases in which the B14s
gained more than 18% at the time of the next Peerless Sell.
Only 3 of the B14s would have been sold at a loss. In 9 cases, the DJI
fell back more than 1% before rallying. In 4 cases it fell back
more than 5%. In 7 of 10 cases where the DJI was more than 1%
below the 21-day ma when the signal occurred, the DJI needed to
retreat to the lower band before rallying.
The most bullish B14s took place when the Accum. Index
was below -.08. In 6 of 7 cases, a bull market was about to begin,
though the odds then were 2:1 that the lower band would have
to be tested before the bull market began.
B14 signal Subsequent low Pct Gain
4/9/1942 99.7 92.90 (-.085) new bull market began
6/6/1949 165.2 161.60 +.303
6/9/1953 263.4 255.50 +.55
8/17/1982 831.24 only up +.272
8/20/1982 869.29 only up +.216
6/15/2006 11015.19 10739 rallied to 13800 (+24%)
11/28/2007 13289.45 only up small rally to upper band
Buy B14s that occurred within a few days of each other were quite bullish.
But in the single case where they were separated by 20 days, the gain
was only +.1% for the second occurrence.
Case 1
8/17/1982 831.24 1.029 .076 -66 65 -.064 -5 -.306 .272
DJI roared ahead in new bull market.
--------------------------------------------------------------------------
8/20/1982 869.29 1.074 .55 -1 46 -.06 -1 -.192 .216
DJI roared ahead in new bull market.
---------------------------------------------------------------------------
Case 2
1/2/1987 1933.49 1.005 -.137 -161 17 .036 -19 -.25 .211
DJI roared ahead in resumed market.
----------------------------------------------------------------------------
1/5/1987 1971.32 1.024 .149 -88 73 .094 -13 -.121 .188
DJI roared ahead in resumed bull market.
-----------------------------------------------------------------------------
Case 3
8/29/2007 13289.29 1.004 .07 -69 139 .103 370 .209 .035
DJI rose to 14156 and then started a bear market.
---------------------------------------------------------------------------
9/18/2007 13739.39 1.033 .592 339 9 .116 48 .156 .001
DJI rose to 14156 and then started a bear market.
---------------------------------------------------------------------------
4/8/1968   884.42  1.047  .695    97  43    .042    13      .413   .043
     DJI rose, reaching 922.82, then fell to lower band and rose sharply.
--------------------------------------------------------------------------
1/28/1982  864.25 1.011  -.056  -114 71    -.018   -5      .017   -.036
     DJI fell to 795.47 before rallying to 865.87 and then falling back again.
--------------------------------------------------------------------------

8/17/1982  831.24 1.029    .076   -66  65    -.064   -5     -.306   .272
     DJI roared ahead in new bull market.
--------------------------------------------------------------------------
8/20/1982  869.29 1.074     .55     -1  46    -.06    -1      -.192  .216
      DJI roared ahead in new bull market.
---------------------------------------------------------------------------

1/2/1987   1933.49 1.005  -.137   -161 17    .036   -19     -.25    .211
      DJI roared ahead in resumed market.
----------------------------------------------------------------------------
1/5/1987   1971.32 1.024  .149    -88  73    .094   -13      -.121   .188
      DJI roared ahead in resumed bull market.
-----------------------------------------------------------------------------

5/31/1988  2031.12 1.021  -.007     -87 41    .024   -4        .018    .011
      DJI rose to top of trading channel.
-----------------------------------------------------------------------------
5/11/1990  2801.58 1.034    .314     -16 46    .085    3        .309   .06
      DJI rose to 3000 and topped out.
----------------------------------------------------------------------------
1/19/2006  10880.71 1.00   .006     360 112   .02   -24       -.017   .064
      DJI fell to 10667 on 1/20 and then rose.
----------------------------------------------------------------------------
6/15/2006  11015.19 .996   -.435   -179 92   -.063   -317      -.104  .012
      DJI rose to 11200 and fell back to 10739.35 and rallied.
---------------------------------------------------------------------------
8/29/2007  13289.29 1.004 .07     -69  139   .103   370        .209  .035
      DJI rose to 14156 and then started a bear market.
---------------------------------------------------------------------------
9/18/2007  13739.39 1.033  .592    339  9    .116    48        .156  .001
       DJI rose to 14156 and then started a bear market.
---------------------------------------------------------------------------
11/28/2007 13289.45 1.004  -.521  -420  92   -.092   -313     -.213  .025
       DJI rallied to upper band.
--------------------------------------------------------------------------
3/18/2008  12392.66 1.011  .042   -327  138  .088    -263     -.029  .013
       DJI rallied to upper band
----------------------------------------------------------------------------
3/13/2009  7170.06  .998  -1.186  -496  227  -.113    -317    -.221  .04
       DJI moved higher for 6 weeks.
       No paper loss.
---------------------------------------------------------------------------
7/15/2009   8616.21  1.028  .006   177  221   .001   -50      -.11  .155
===========================================================================
                             Number of trades =  28
                               Avg. Gain=  10.6%
Also - not closed out.

5/10/2010   10785.14  .98  -.229   -50   82   .055   -320      .139

5/27/2010   10258.99  .97  -.882   -388  99  -.007   -420     -.364

6/2/2010    10249.54  .982 -1.025  -487  26  -.008   -476     -.433

6/10/2010   10172.53  .994  -.668  -248  95  -.049   -267     -.255