OPTIONS TRADING and TIGERSOFT"
BULLISH SPREADS
9/29/2009
(C) 2009 William Schmidt, Ph.D.
A bull call spread is obtained by
buying a call
option with a low exercise price, and selling
another call option with a higher exercise price. Both calls must have the same
underlying
security and expiration month An example. Assume XYZ is currently 100.
Assume the
call option with a strike price of $100 can be bought for $3 per share, or $300 per
contract,
while a call option with a strike price of $115 is selling at $1 per share, or $100
per contract.
A trader can then buy a long position on the $100 strike price option for $300 and
sell a
short position on the $115 option for $100. The net debit for this trade then is $300
- 100 = $200.
This is the most a buyer of this spread can lose. The trade is profitable if
the stock closes
on expirtion above $102. If the stock's closing price on expiration is $110, the
$100 call
option will end at $10 a share, or $1000 per contract, while the $115 call option
expires
worthless. Hence a total profit of $1000 - 200 = $800. In summary, the
trade's profit is limited
to $13 per share, which is the difference in strike prices minus the net debit (15
- 2). The
maximum loss possible on the trade equals $2 per share, the net debit.
The best and, by far, simplest way to find stocks that should be used for this
approach is
to take NASDAQ-100 stocks, or other stocks which are optionable, and run the Tiger
ANALYSIS
program and employ it with stocks the Tiger program finds to be
"BULLISH". These will
be stocks having a top Power-Ranking that are above the rising 50-day ma when the
Peerless
system is on a Buy. They should have rising CLosing Power Lines, too. A
Closing Power that
is making a new 12 month high ahead of price is considered a prime candidate here.
So is a
stock making a flat topped breakout or a stock with levels of current Accumulation
over +.25.
But the further up any of these stocks is arefrom the 50-day ma, the bigger the
risk, since in a
weak market, many stocks will retreat to the support of the rising 65-day mal.
Using the "BULLISH" screening criteria we get a
good working list for stocks that
should be profitable using this approach. Below is a list of the
"bullish" rated stocks
in the middle of March 2009, April 2009, May 2009, June 2009, July
2009, August 2000,
September 2009. The top 7 Bullish stocks are only considered here, for
brevity's sake.
In actual trading, other ranked "Bullish" should be considered.
March 13, 2009
HANS 36.99 still on red 5-day Stochastic
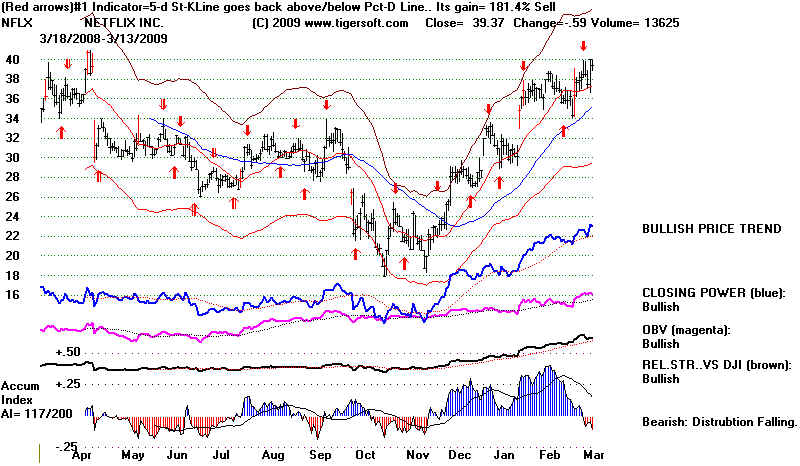
NFLX 39.37 IP21<0 on rally to Feb high. 40 is 12 mo
high. Closing Power is making NHs
March 13, 2009
September 29, 2009
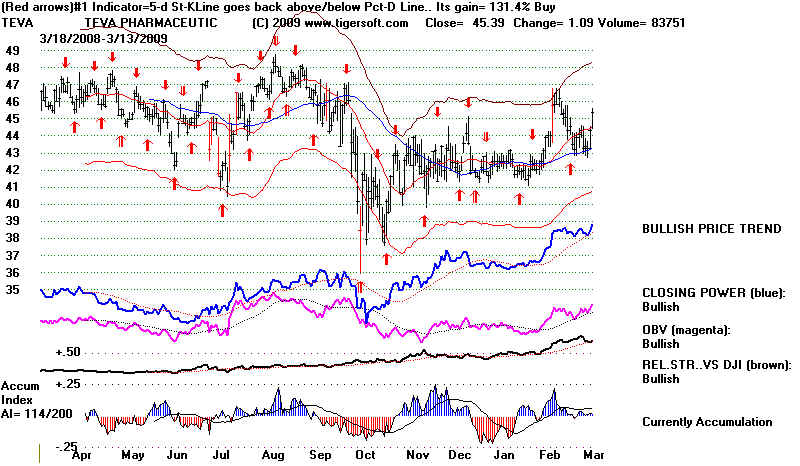
TEVA 45.39 IP21 is barely positive. On red Buy. 49 is 12 mo high.
Closing Power making 12 mo highs.
March 13, 2009
September 29, 2009
BRCM 19.11 IP21 <0 but strong CLosing Power. 30 is 12 mo high. Lots
of upside potential.
March 13, 2009
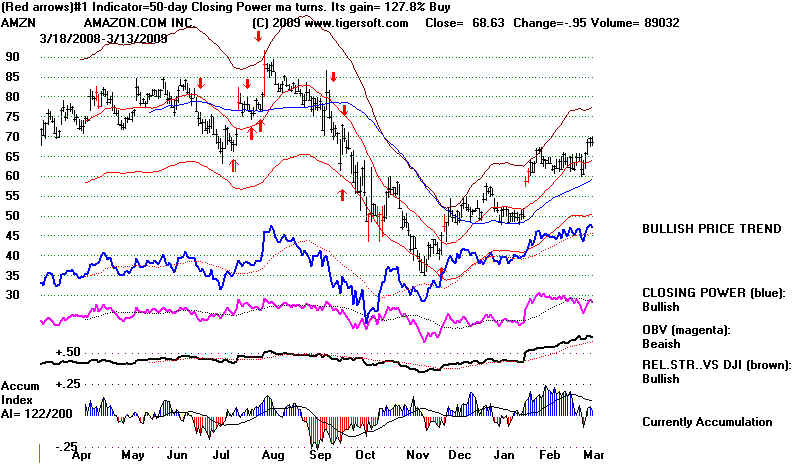
AMZN 68.83 Closing
Power close to making 12 mo high, even though 12 mo price high is at 91.
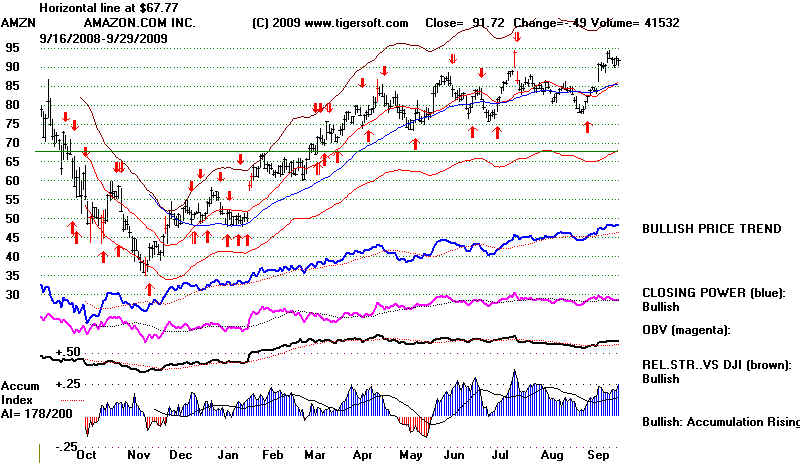
September 29, 2009
April 15, 2009
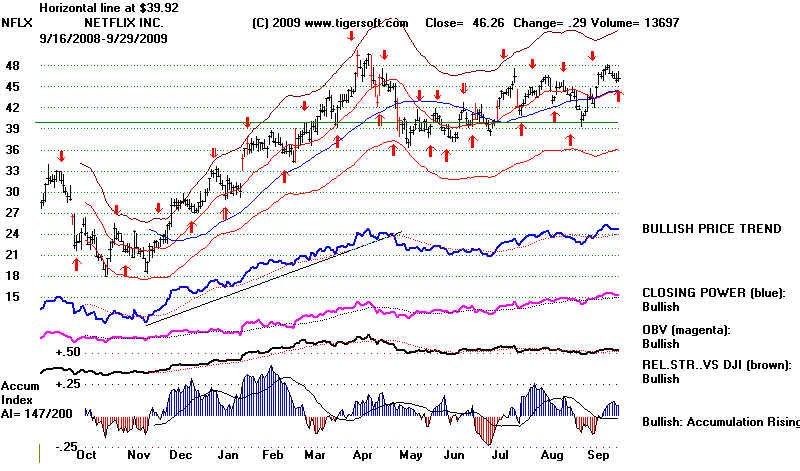
NFLX 46.59 on red Sell from 5-day Stochastic that has gained 150.6%
12-month high confirmed by Blue Closing Power.
All sysems are rated bullish, but IP21=.12
ORLY 36.66 -.NH by prices and Closing Power. Current AI over .25
AMZN 74.71 Closing Power NH... 12-mo high=91
HANS 35.82 Stalling out at 37 resistance. CP strong. 37
would be breakout.
ROST 38.83 42 was 12 mo high. CP NH
LRCX 25.62 43 is 12 mo high. All Bullish conditions.
CTSH 22.48 Current AI les than .25. Rel Strength was
rated "bearish". 37 was 12 mo high.
May 15, 2009
HANS 42.61 Current AI over +.25 on NH. CP lagged last
high.
CTSH 25.76 Current AI less than .25. All ratings were
"bullish"
SBUX 12.92 Previous bulge of AI to .36 CP strong.
JNPR 21.56 Current AI = .19 CP cmade NH
even though 12 mo high was .28
June 15, 2009
MXIM 16.31 Current Accum over .28 CP at NH despite 12 mo
price at 23.
JNPR 23.68 Current AI = .05 CP cmade NH
even though 12 mo high was .27
NTAP 19.82 Current AI=.20 CP bacl to 12 mo high
despite prices 7 points below 12 mo high.
CTSH 25.81 Current AI less than 0 . (not bullish at
this point)
AMZN 83.18 Current AI =.25...Closing Power NH... 12-mo high=91
SBUX 14.12 Previous bulge of AI to .36 CP at 12 mo high.
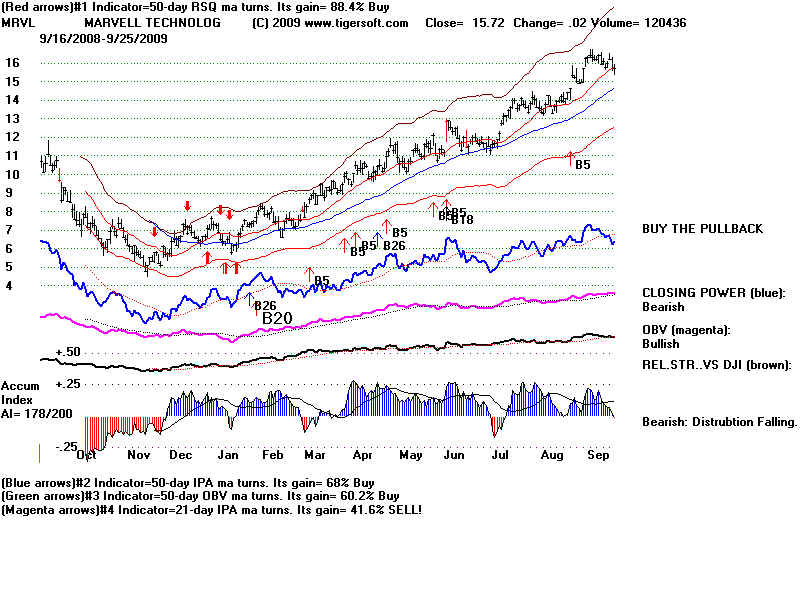
MRVL 12.47 Current AI =.26 .. CP rising but not at 12 mo high.
All indicators were "bullish"
QCOM 44.31 Current AI=.39 CP back to 12 mo highs, Price's 12 mo
high =57.
July 15, 2009
AMZN 84.15 Current AI =.12...Closing Power close to NH... 12-mo high=91
NTAP 20.92 Current AI=.22 CP 12 mo NH, despite prices
6 points below 12 mo high, at 27..
JNPR 25.19 Current AI = .05 CP made NH
even though 12 mo high was .27
MXIM 16.91 Current AI = .10 CP made NH even
though 12 mo high was .23
SBUX 14.42 AI<0 CP at 12 mo high.
MRVL 12.74 AI<0 but stock did rebound from rising 50-day ma
QCOM 46.06 Current AI=.12 CP at 12 mo highs, Price's 12 mo high
=57.
Aug 15, 2009
NTAP 23.59 Current AI=.22 CP 12 mo NH, despite prices 6
points below 12 mo high, at 26
All indicators were bullish.
JNPR 24.61 Current AI=.20 CP has made 12 mo high despite
price high being 27.4
BRCM 26.67 Current AI = .31 CP had been making 12 month highs ahead of
price.
Bulge of AI reached .50 two weeks earlier.
SBUX 14.42 Current AI = .40 CP and price
make 12 mo high. All indicators rated Bullish,
MRVL 13.69 Current AI= .20 OBV and Rel Strength rated
"bearish"
MXIM 18.71 Current AI=.25 CP making 12 mo highs. 12 mo
Price high = 22.
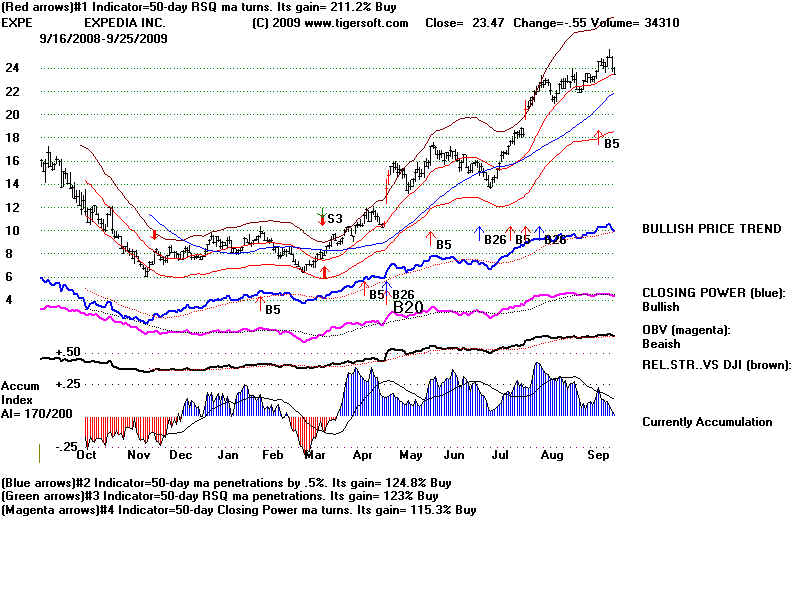
EXPE 22.12 Current AI=.32 CP and price making 12 mo high.
All indicators rated "bullish."
AAPL 166.78 Current AI=.20 All indicators rated "bullish."
CTSH 34.43 Current AI=.22 CP and prices making 12 mo high. All
indicators rated "bullish."
Sept 15, 2009
NTAP 24.72 Current AI=.04 CP and prices made 12 mo NH
All indicators rated "bullish."
JNPR 26.95 Current AI=.15 CPand prices made 12
mo high
BRCM 26.67 Current AI = .21 CP making 12 month highs with price.
Bulge of AI reached .50 two weeks earlier.
SBUX 19.79 Current AI = .23 CP and price
making 12 mo highs .
MRVL 16.21 Current AI= .14 OBV and price making 12 mo highs
.
All indicators rated "bullish."
MXIM 19.23 Current AI=.25 CP making 12 mo highsahead
of price at 20.
EXPE 23.71 Current AI=.20 CP and price making 12 mo high.
All indicators rated "bullish."
AAPL 175.16 Current AI=.16 All indicators rated
"bullish." Steadily rising CP.
==================================================================================
STEPS
TO TAKE TO USE TIGERSOFT HERE.
Update Your Data with
TigerSoft
Updating the data in NASD-100 (where many optionable stocks are).
Go to the Tiger Data Page from Tiger's blue, eight button Peercomm screen.
1. Double-Click Icon for TigerSoft to get to PERCOMM screen.
2. Click Internet button
3. Replace the "0123" between the slashes with the current Data address.
Presently, the current IP21 address is "34567"
The result shoud be that the line says "http://www.tigersoft.com/34567/index.html
When this change is made, click "Display
Web Page Chosen above".
Note that you also enter this address in your internet
surfer to go to the Data Page.
The top of the page will say "Tiger Data and Help
Page".
Become familiar with this page. This is the easiest place
for you to update your stocks
each night.
Find near the top of the page:
Quickie Downloads of Most Requested Data:
PEER04.exe DATA.exe DJI-30.exe HOTSTKS3.exe NASD-100.exe SECTORS.exe
More downloads are available on this page.
including OPTIONS.exe
Open by clicking on the link - NASD-100.exe
You may be able to run this file right from the
web-page. If not save it it to your computer
and then run it. Be sure that you see the
Tiger image on your computer and the installation
taking place.
When with download, click "Finish".
That should take you back to the Tiger
Data Page where you can download other Data. .
Next click the "X" at the
top of the screen. That should take you back to the PEERCOMM
screen. If not find the Tiger
PEERCOMM icon on your desktop and double click it.
That takes you to the 8 button blue
screen that is the starting pount for TigerSoft
SELECT THE CORRECT DIRECTORY
From the Peercomm screen click Select. Use the vertical scroll bar on the left and click
"nasd-100"
and then "OK".
Read the second line on the
Peercomm page. It will tell you the current assumed directory.
It should now say
"Current data directory: c:\nasd-100 101
symbols, updated mm/dd/yy
The last completed trading date
should be there or the previous trading day's date if it is before
6:30 PM.
RUN Tiger's Power-Ranker
From the Peercomm screen click ANALYZE The program takes a few minutes.
When it is finished, click on the button
that says "Go to Main Tiger Menu for Ranking and Graphs".
Unfortunately, this takes you to the
older TigerSoft program. So, click the "X" at the upper right.
That takes you to the Peercomm screen.
Run Peerless-2008 (current main graphing program)
Click the Peercomm button on the upper
right. This is the current Peerless/Tiger program.
Click Daily Stocks
and from the middle section, choose
"Bullish 12.
Top Power Ranked Stocks."
You should get a chart that looks like
this.
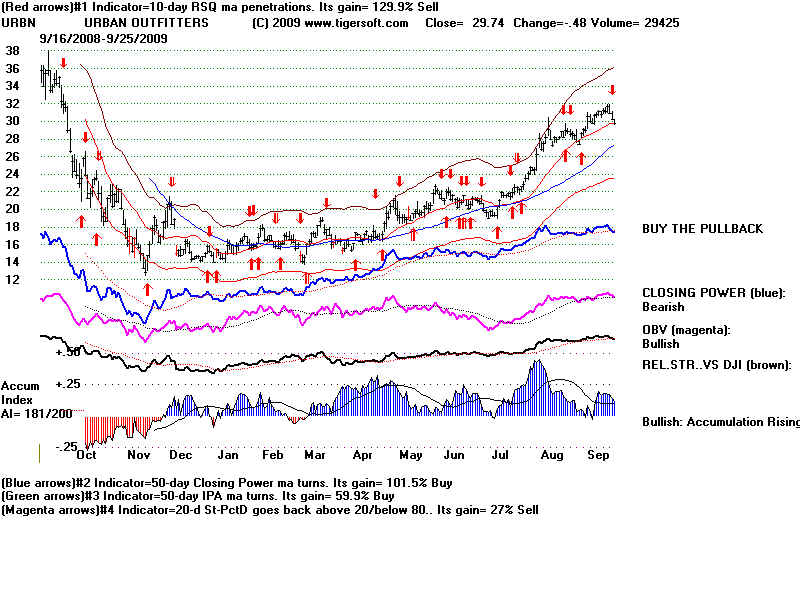
Place the signals on the screen
using "Signals-3"
and "Buys/Sells Compatible with 590day ma"
Use the first HELP selection to see the meaning of the signals.
Read also "Indicators, Terms and Concepts".and
"Evaluating Stocks Already
Owned."
Superimpose the Peeless signals to
be sure that we do not have a new major Sell.
Use "Signals-1" and "Superimpose DJI Saved Signals."
Look a whether the public is bullish
(rising Openings) and if the professionals are bullish
(CLosing Power). An uptrend of Closing Power is essential
to assure us that the stock's
uptrend is strong. Click Operations and Restore Simple Bar Chart.
Choose the first item under Indic.3
at the Tiger Basis of
Moves.
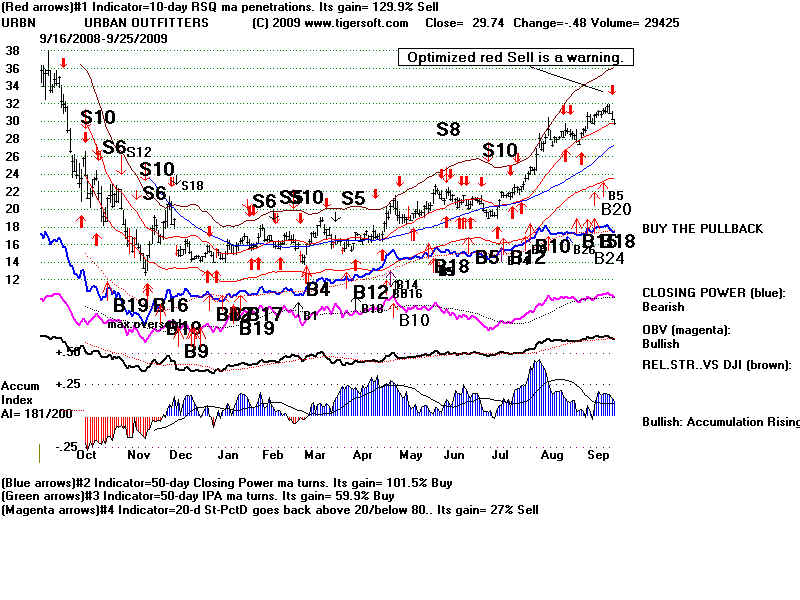
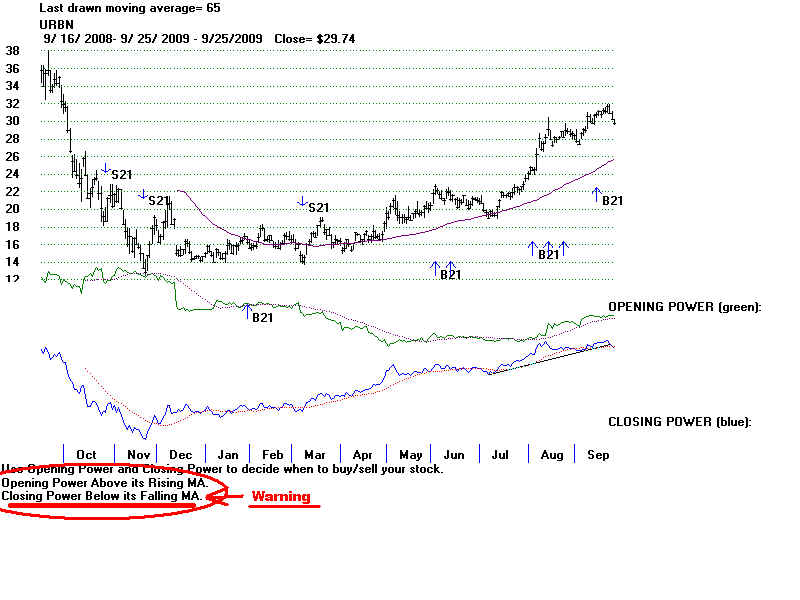
Note the warning at the lower left of the resulting chart:
"Closing Power below its Falling MA".
I would not be bullish on the stock at this point. The Buy B21
shows you the bullish Both-Up
condition. When the CLosing Power subsequently breaks its
uptrend, look for a retreat.
Draw a 65-day ma.using using Mvg Avg at the top. It would be better to become
bullish
when the stock is closer to the rising 65-day ma's support.
Get Next Stock - (Lower and Lower Power
Ranking)
Be sure your keyboard's
Num-Lock key is off. and click the "2" key on the right side. This
takes you to the next stock.