2007-2016
How To Use Peerless Signals
(C) 2016 William Schmidt and www.tigersoft.com
www.tigersoft.com/LATEST-CHARTS/INDEX.html
Peerless works best switching in and out of ETFs in a Retirement Fund
and keeping us in speculative stocks for as long as the general market is safe.
History also shows that there are times when the market sets up for very big moves
in a short time period. Our Hotline suggests when this is true and traders
can become very aggressive with leveraged ETFs and options.
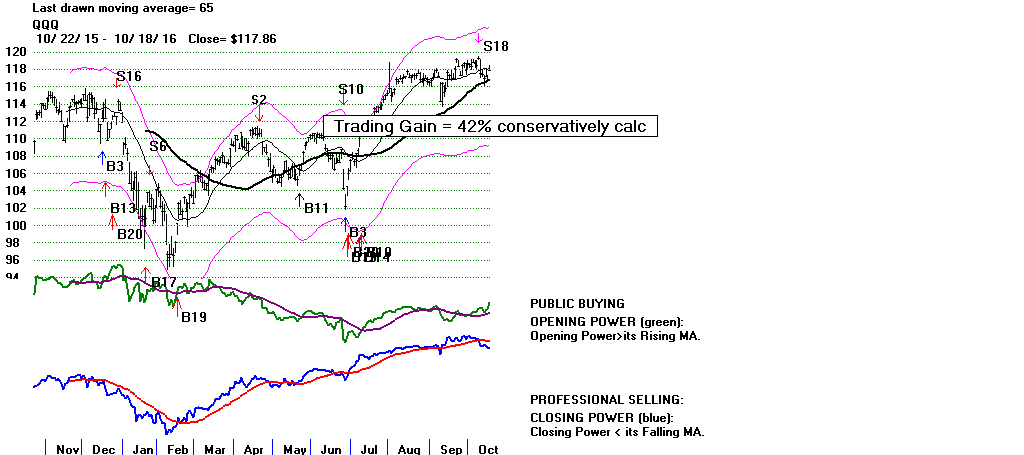
The Peerless/Tiger Software we offer gives you all the software we offer
except the Tiger Power Ranker. You can get charts of 8000+ trading
vehicles and then super-impose these signals on them. This works out
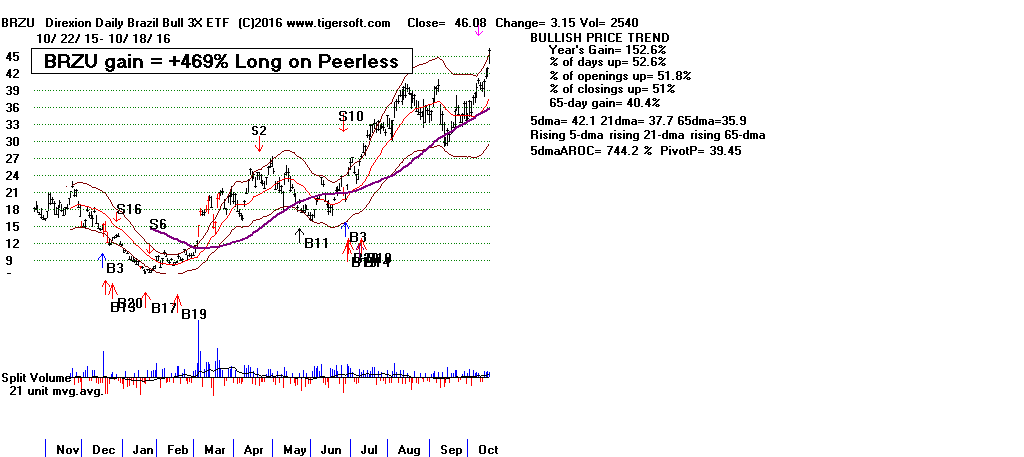
very well. Trading BRZU long only when Peerless was on a Buy ("B") signal
would have gained someone +469% for last year.
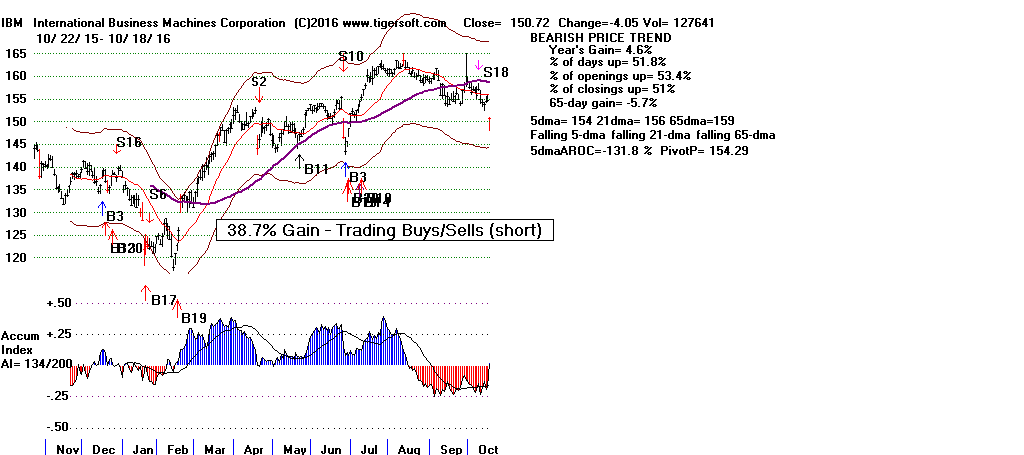
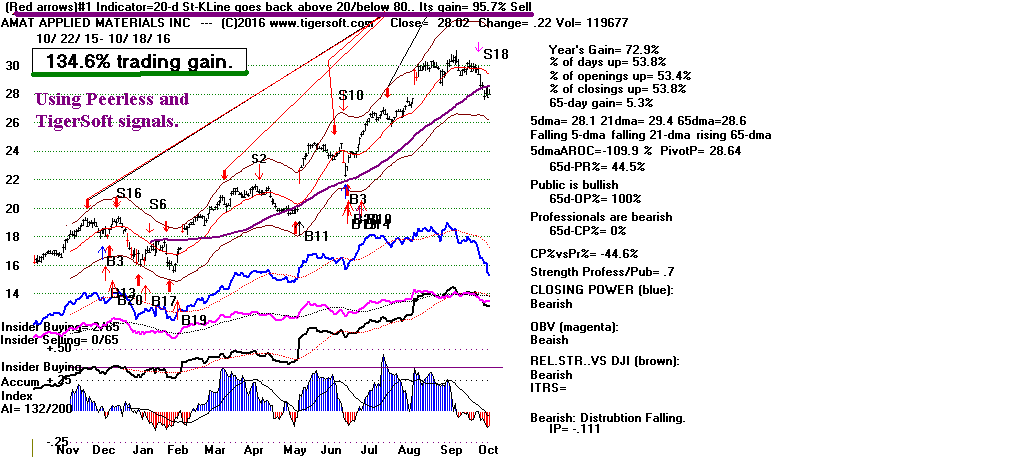
See for example QQQ, IBM and AMAT recently.
Below see the
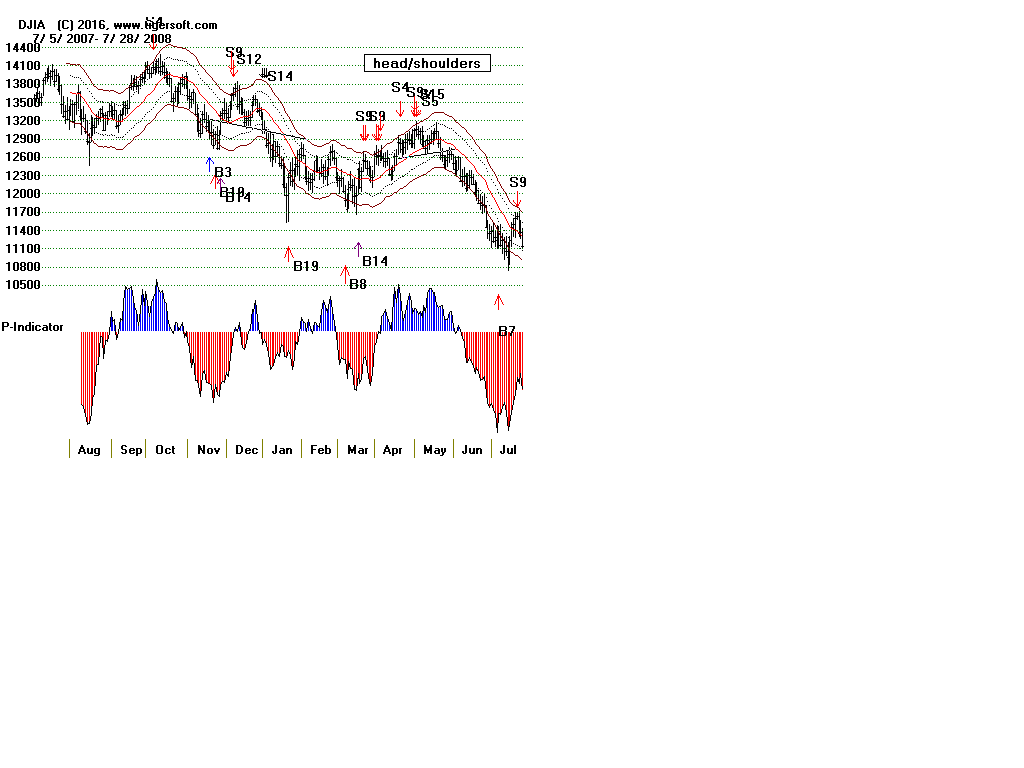
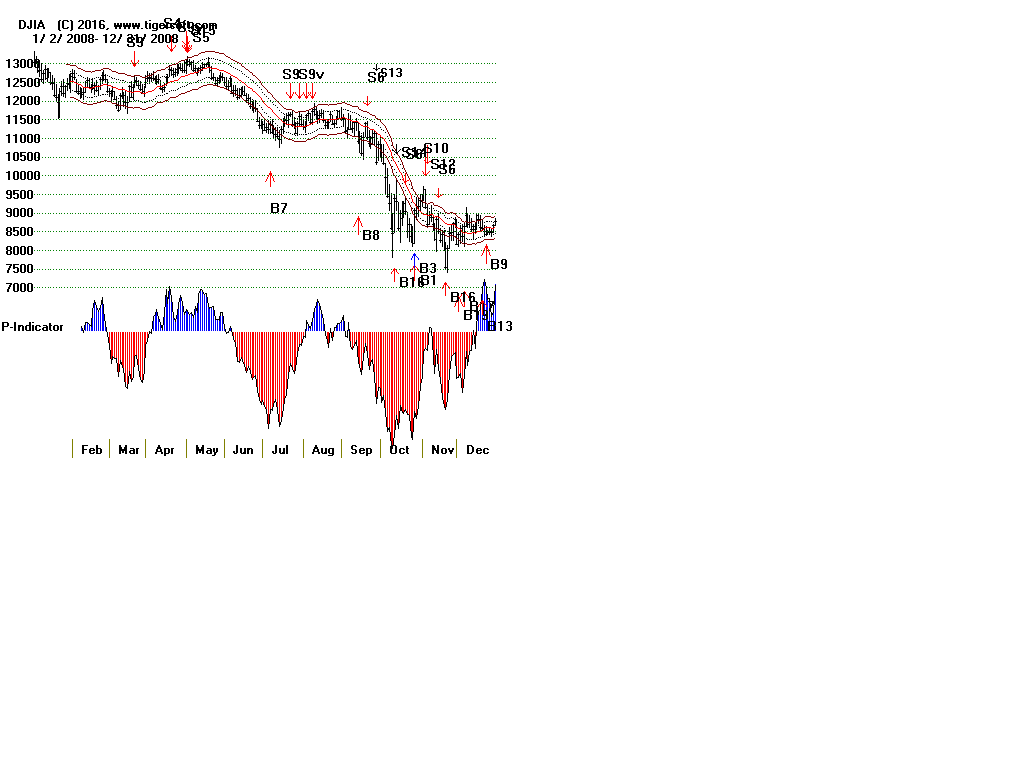
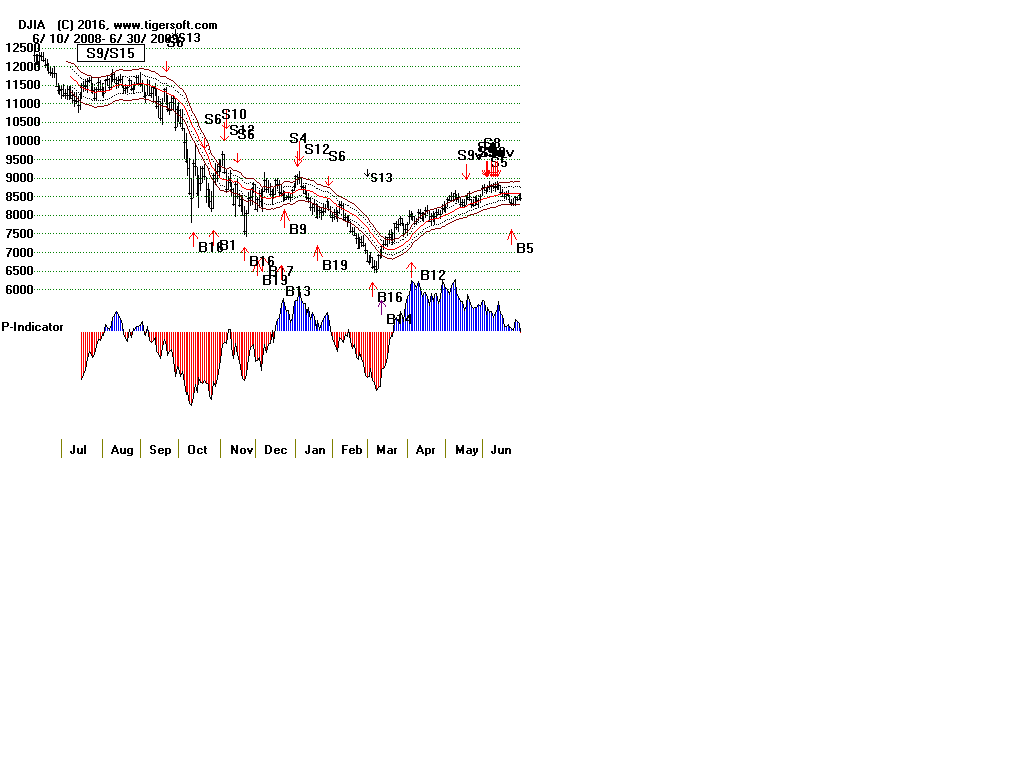
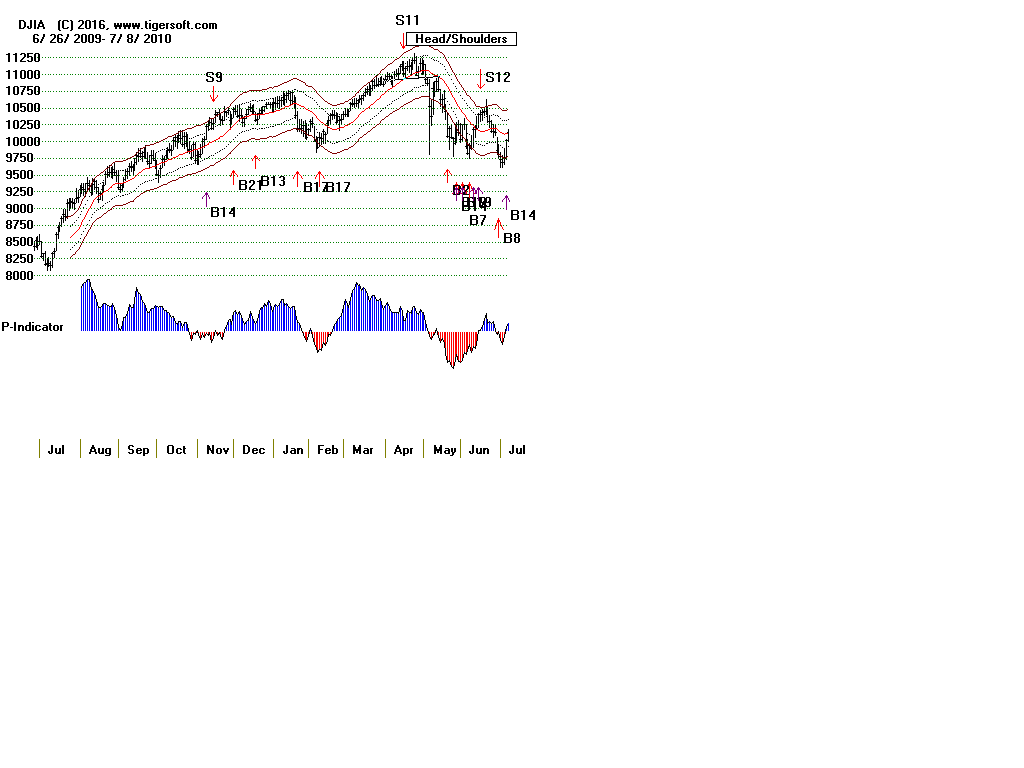
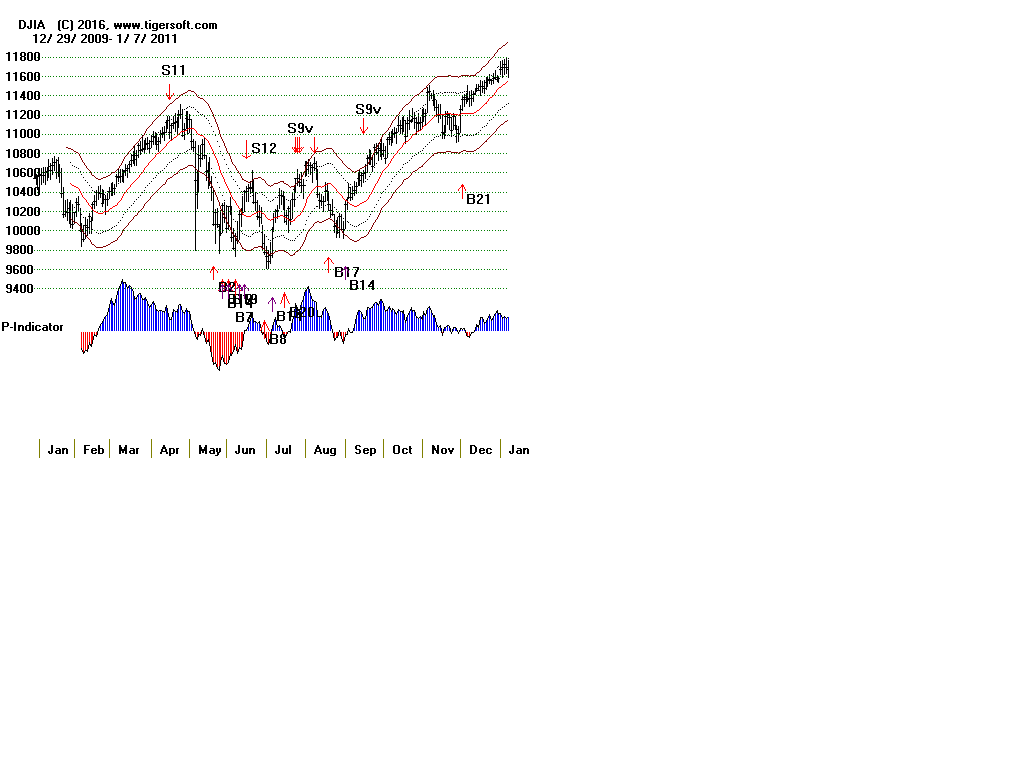
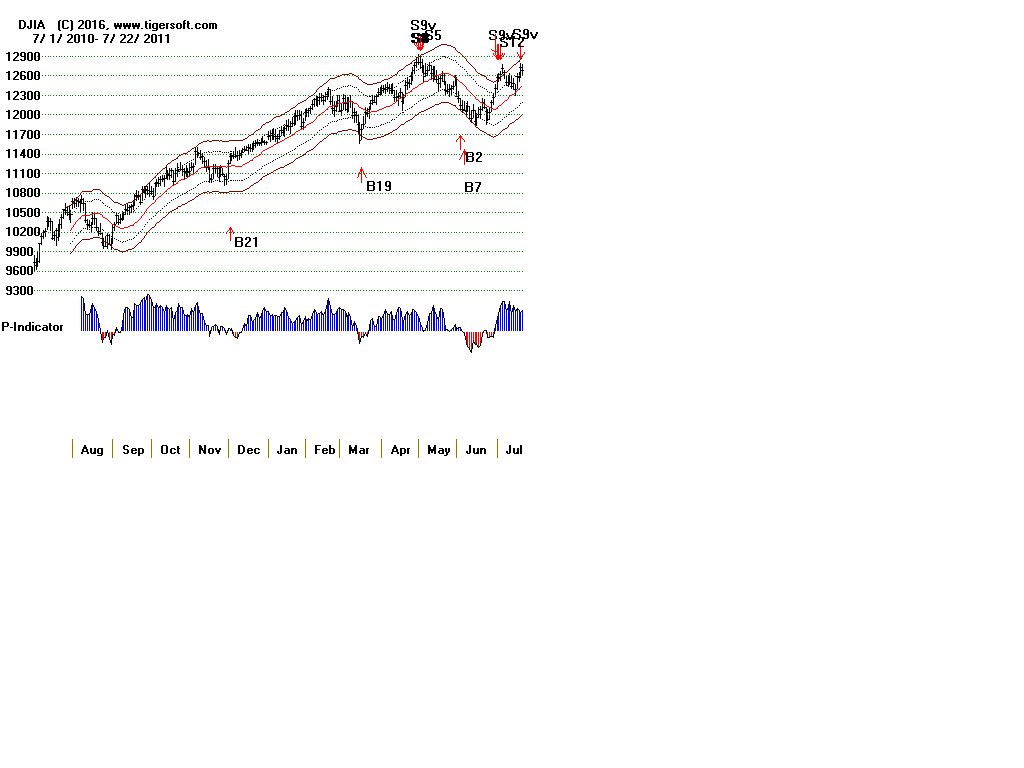
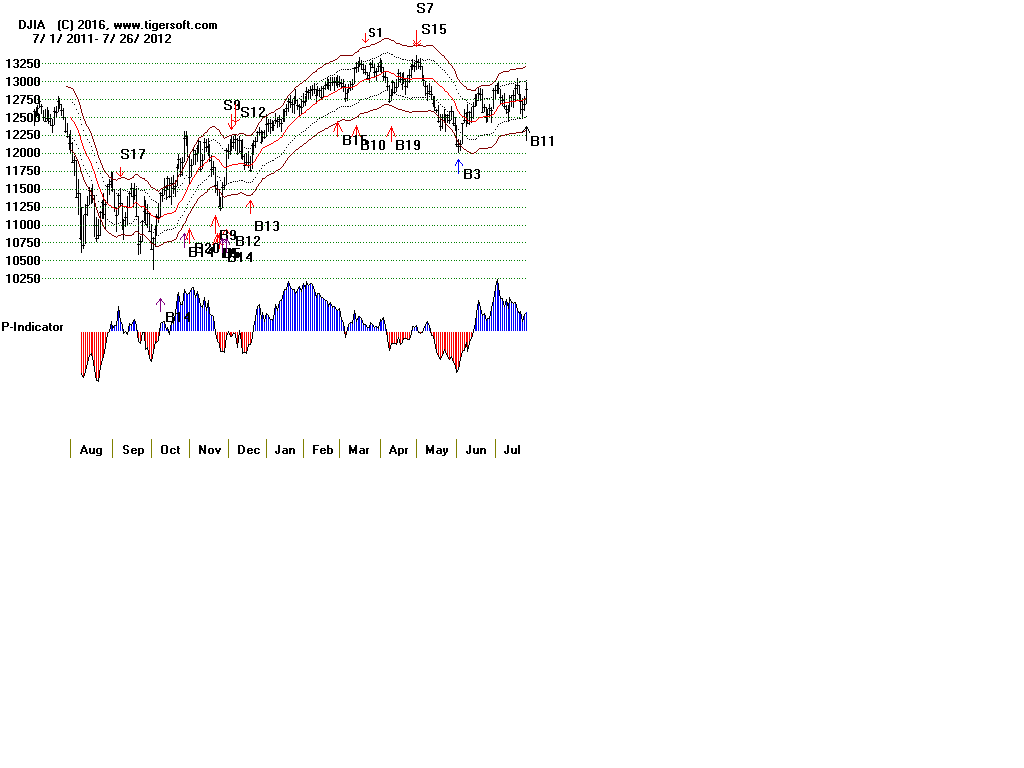
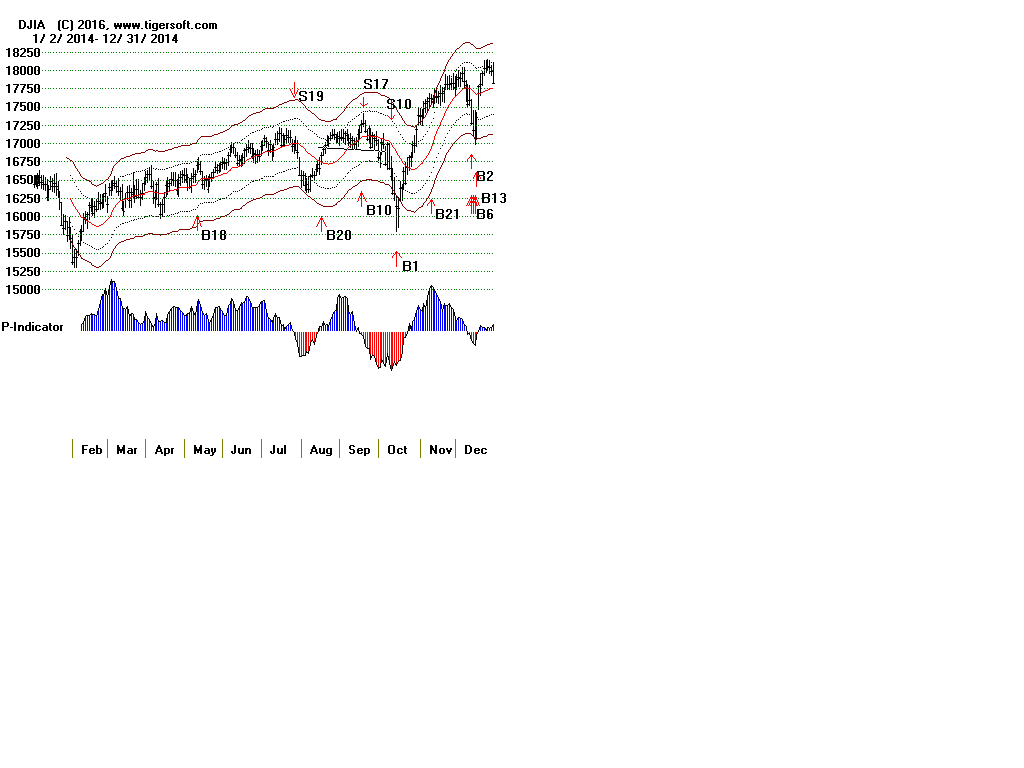
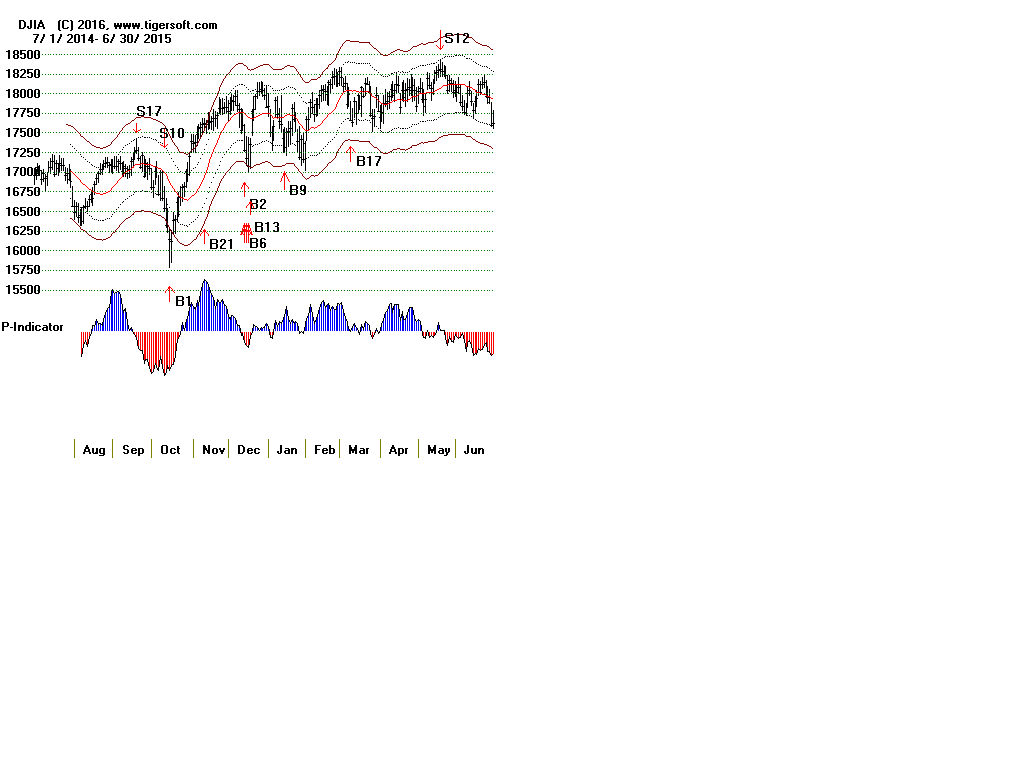
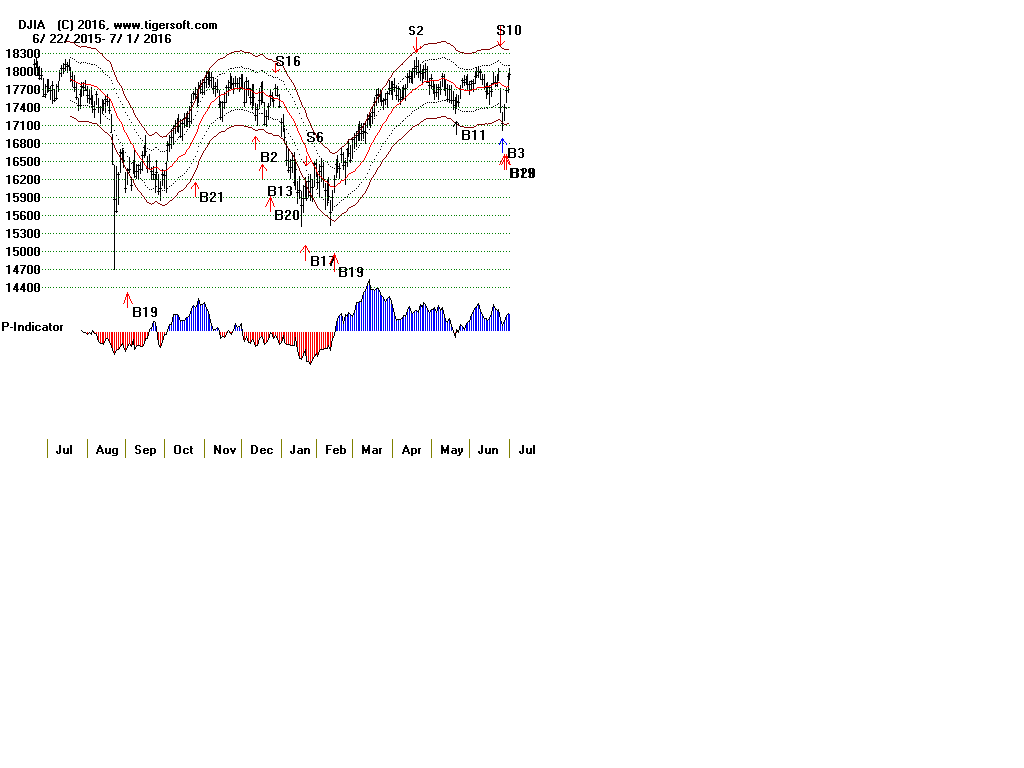
1. Dates and DJI Closings for each Signals: 2007-2016
2. All Peerless DJI Charts: : 2007-2016
Please note that it takes about 100 days of data for a signal
to be generated. So, the first 3 months of each chart may
not show all the early signals.
Example: "S19" is a particular Peerless Sell signal.
and "B19" is a particular Buy signal. Any Buy signal
can reverse a Sell Signal and vice verse. The numbers
give us a way to classify and study the history of each
particular signal.
All the signals have been back-tested to 1928 and
have been refined considerably because of this.
Our Hotline shows the research for each signal as
they occur and discusses potential new signals,
as well as discussing other short-term indicators
and giving the night's most Bullish and Bearish stocks,
using the Tiger Power Ranker, QuickSilver and
our MAXCPs/MINCPs strategies.
Peerless Software includes 6 months of Data and 3 months of Hotline.
Italicized Signals are those that reverse the direction of a trade from
a Buy to a Sell or from a Sell Short to a Cover Shorts.
Date Signal DJI Gain
-------------------------------------------
20070105 S19 12398.01 .015
20070306 B19 12207.59 .143
20070518 B18 13556.53 .029
20070712 B10 13861.73 .006
20070716 S5 13950.98 .066
20070717 S9 13971.55 .067
20070814 B3 13028.92 .060
20070829 B14 13289.29 .04
20070918 B14 13739.39 .006
20070919 S2 13815.56 .062
20071005 S4 14066.01 .079
20071119 B3 12958.44 .051
20071123 B19 12799.04 .064
20071128 B14 13289.45 .025
20071206 S12 13619.89 .099
20071207 S9 13625.58 .099
20080123 B19 12270.17 .023
20080307 B8 11899.69 .055
20080318 B14 12392.66 .013
20080324 S9 12548.64 .093
20080402 S9 12608.92 .097
20080421 S4 12825.02 .112
20080501 S15 13040 .127
20080502 S11 13058.2 .128
20080708 B7 11384.12 .022
20080723 S9 11632.38 .061
20080730 S9 11583.69 .058
20080808 S9 11734.32 .07
20080915 B8 10917.51 .009
20080922 S6 11015.69 .148
20080929 S13 10365.45 .094
20081013 B16 9387.61 -.038
20081021 S6 9033.66 -.003
20081028 B1 9065.12 .008
20081105 S12 9139.27 .174
20081114 S6 8497.31 .111
20081120 B16 7552.29 .185
20081202 B19 8419.09 .063
20081205 B17 8419.09 .063
20081218 B13 8604.99 .04
20081223 B9 8419.49 .063
20090105 S4 8952.89 .081
20090106 S12 9015.1 .087
20090121 B19 8228.1 -.01
20090129 S6 8149.01 .191
20090302 S13 6763.29 .025
20090305 B16 6594.44 .277
20090312 B14 7170.06 .174
20090403 B12 8017.59 .05
20090511 S3 8418.77 .011
20090518 S9 8504.08 .021
20090603 S4 8675.24 .041
20090604 S9 8750.24 .049
20090608 S8 8764.49 .05
20090623 B5 8322.91 .234
20090715 B14 8616.21 .192
20091109 B14 10226.94 .004
20091113 S9 10270.47 -.004
20091217 B13 10308.26 .069
20100122 B17 10172.98 .083
20100209 B17 10058.64 .095
20100416 S11 11018.66 .086
20100520 B2 10068.01 .034
20100527 B14 10258.99 .015
20100602 B14 10249.54 .016
20100608 B7 9939.98 .047
20100610 B14 10172.53 .023
20100616 S9 10409.46 .061
20100616 S12 10409.46 .061
20100630 B8 9774.02 .079
20100707 B14 10018.28 .052
20100726 S9 10542.43 .026
20100809 S9 10698.75 .04
20100819 B17 10271.21 .247
20100827 B2 10150.65 .262
20100901 B14 10269.47 .247
20101104 B10 11434.84 .12
20101217 B13 11491.91 .114
20110317 B19 11774.59 .088
20110502 S8 12807.36 .051
20110503 S9 12807.51 .051
20110503 S5 12807.51 .051
20110603 B2 12151.26 .022
20110607 B7 12070.81 .028
20110608 B17 12048.94 .03
20110630 S12 12414.34 .075
20110705 S9 12569.87 .086
20110721 S9 12724.41 .098
20110815 B14 11482.9 .007
20110830 S12 11559.95 .078
20110831 S9 11613.53 .083
20111003 B8 10655.3 . 135
20111010 B14 11433.18 .058
20111027 B14 12208.55 -.009
20111121 B9 11547.31 .048
20111122 B5 11493.73 .053
20111128 B14 11523.01 .05
20111205 S9 12097.83 .027
20111207 S12 12196.37 .035
20111219 B13 11766.26 .054
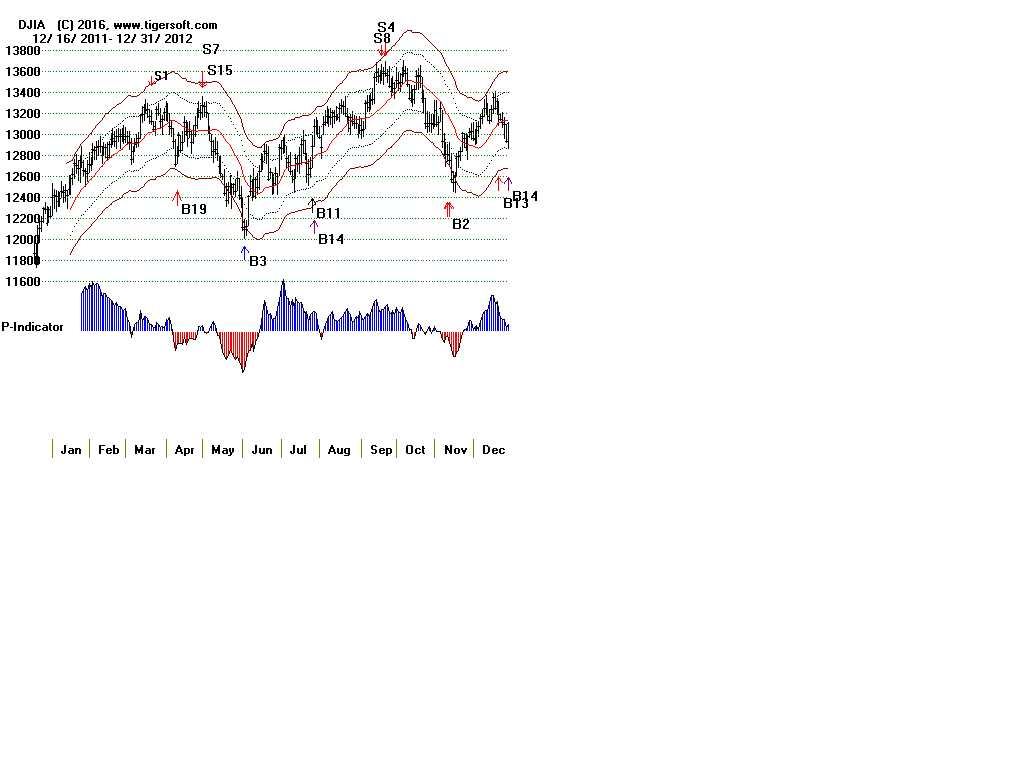
20120103 S12 12397.38 -.015
20120118 B10 12578.95 .043
20120229 B15 12952.07 .013
20120314 B10 13194.10 -.005
20120321 S1 13124.62 .024
20120411 B19 12805.39 .037
20120501 S7 13279.32 .089
20120604 B3 12101.46 .122
20120727 B14 13075.66 .038
20120919 S8 13577.96 .056
20120921 S4 13579.47 .056
20121112 B2 12815.08 .184
20121217 B13 13235.39 .147
20121231 B14 13104.14 .158
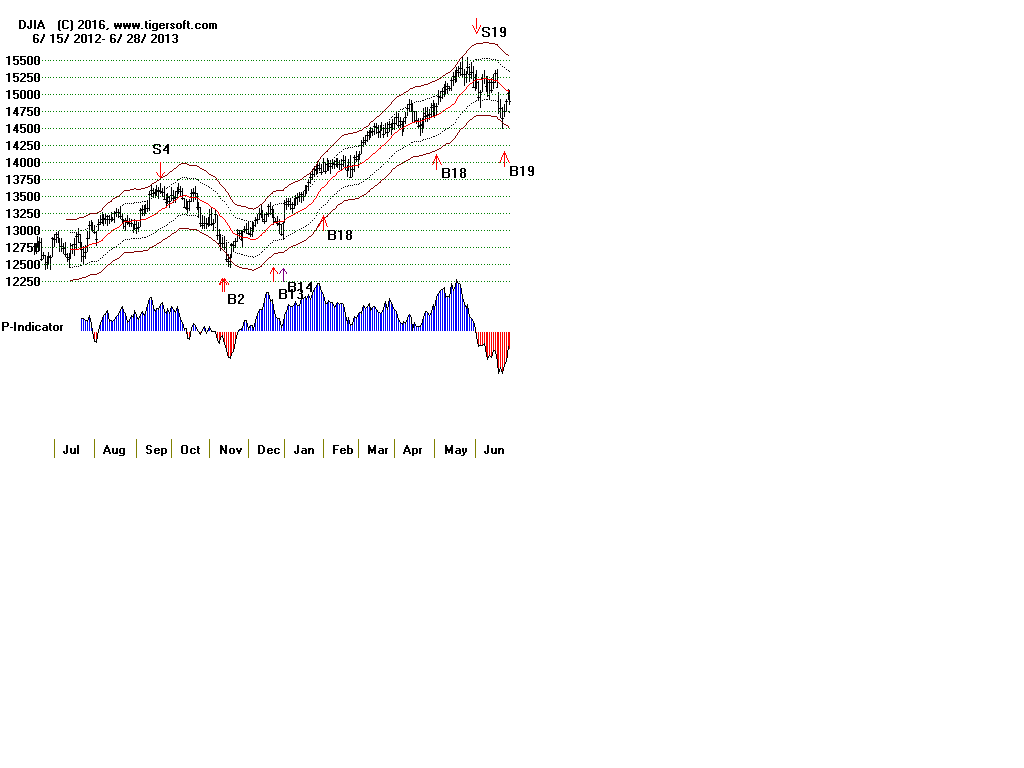
20130122 B10 13712.21 .107
20130201 B18 14009.79 .083
20130502 B18 14831.58 .023
20130604 S19 15177.54 .027
20130625 B19 14760.31 .048
20130712 S8 15464.3 .037
20130715 S5 15484.26 .038
20130821 B2 14897.55 .02
20130822 B19 14963.74 .015
20130829 B2 14640.95 .038
20130910 S12 15191.06 .017
20131007 B9 14936.24 .111
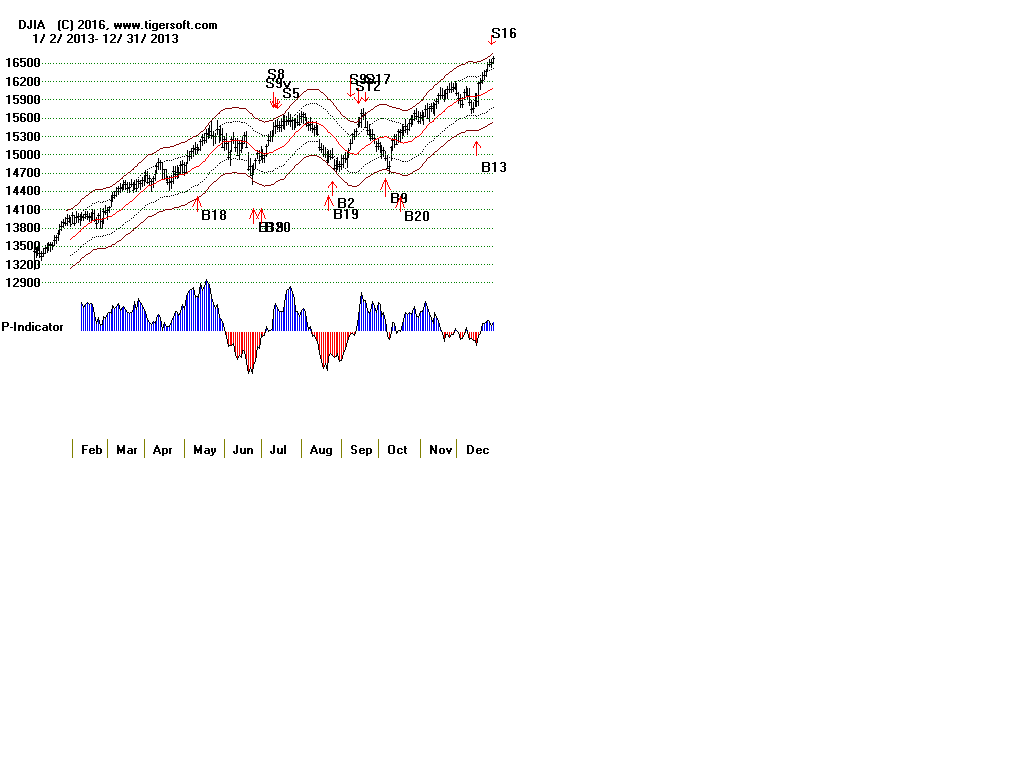
20131113 B10 15821.63 .049
20131217 B13 15875.26 .045
20131230 S16 16594.29 .064
20140204 B9 15445.24 .100
20140423 B18 16501.65 .029
20140513 B10 16715.44 .016
20140728 S19 16982.59 .008
20140818 B20 16838.74 .026
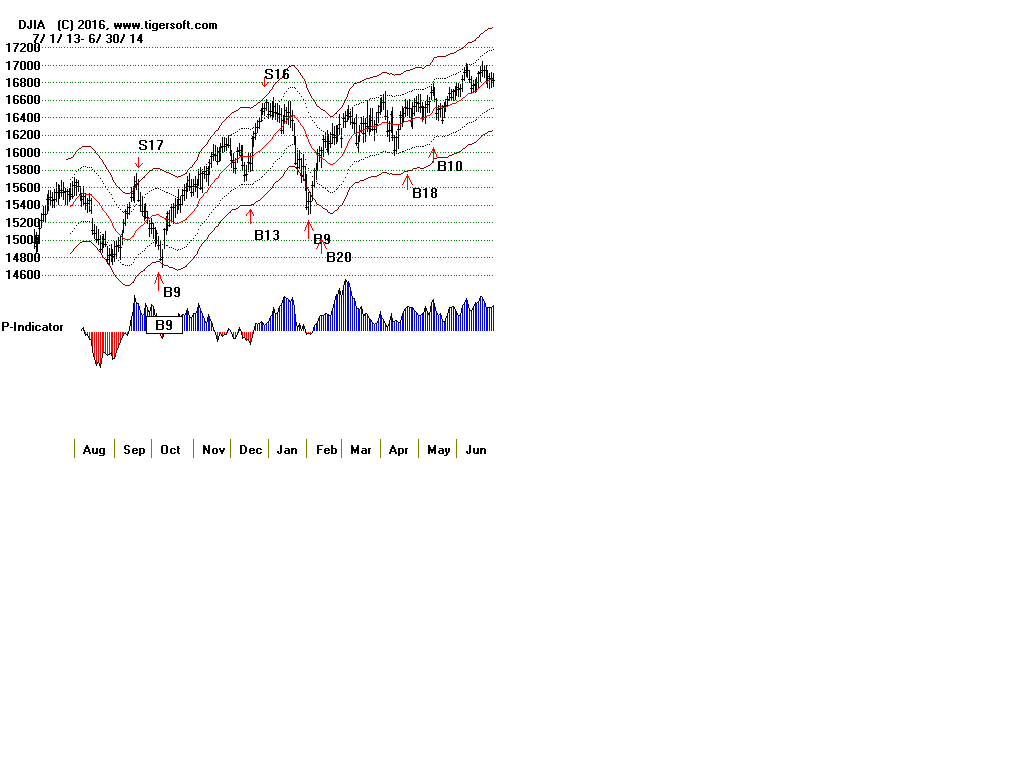
20140919 S17 17279.74 .066
20141010 S10 16544.10 .024
20141015 B1 16141.74 pct gains needed here.
20141111 B21 17614.90
20141212 B2 17280.83
20141215 B6 17180.84
20141216 B6 17068.87
20141217 B13 17356.87
20150115 B9 17320.71
20150302 B10 18288.63
20150310 B17 17662.94
20150519 S12 18312.39
20150716 S12 18120.25
20150824 S13 15871.35
20150825 B16 15666.44
20150827 B17 16654.77
20150827 B14 16654.77
20150828 S14 16643.01
20150930 B3 16234.7
20151026 B21 17223.05
20151211 B2 17265.21
20151215 B3 17524.91
20151217 B13 17495.84
20151223 B20 17602.61
20151228 S16 17602.61
20160121 B17 16093.51
20160125 S6 15885.22
20160216 B19 16196.41
20160420 S2 18096.27
20160520 B11 17500.94
20160624 S10 17400.75
20160627 B3 17140.24
20160628 B19 17409.72
20160629 B20 17694.68
20160708 B14 18146.74
20160711 B10 18226.93


