 |
Daily Blog - Tiger Software
William Schmidt,
- Tiger Software's Creator
(C) 2007 William Schmidt, Ph. D. - All Rights Reserved.
No reproductions of this blog or quoting from it
without explicit written consent by its author is permitted.
Send any comments or questions
to william_schmidt@hotmail.com
People have asked me to
write a Daily Blog. They seem to want
me to give them a thought or two each day. About what?
Well,
we'll just have to wait and see. As, I see it, a blog is a
personal
statement. I will try to make it entertaining and relate it
mostly to the
stock market.
I do promise not to belabor the obvious. So, I hope these thoughts,
reflections and finds are worth your time. I will give you my best.
As it fills up, it will be organized by month and
topic
Look for something new most every day. If you find
it helpful, buy something from us. You'll be glad you did.
Tiger could easily be one the best investments you ever made.
_______________________________________________________________________________________________________
Back to Home Page -
www.tigersoft.com
|
Daily Blog - Tiger Software
7/1/2007
Subjects:
>
San Diego: Tiger Software's Home. How To Start Looking for a Job Here? (June 30, 2007)
> New Mexico: Some Pictures and A Story: (June 29, 2007)
> Housing
Correction Continues. No Bottom In Sight, Yet (June 28, 2007)
>
Who's Guarding The Investors' Hen House?. SEC Chairman Cox?
(June
28, 2007)
Alphabetically:
1929 Top: Could it Happen Again? Yes - Absolutely.
(June 24, 2007)
Bush and the Languishing Biotechs : Stem Cell Research Veto (June
20, 2007)
China and Global Bull Market: (June 17, 2007 and June 18,2007)
Coming of Summer: Seasonality and The Markets (June 22, 2007
End to War in Iraq will be bullish: (June 14, 2007)
Housing Correction Continues. No Bottom In Sight, Yet (June 28, 2007)
Music, Musical Stocks and Music of the Stock Market (June 25, 2007).
New Mexico: Some Pictures and A Story: (June 29, 2007)
San Diego: Tiger Software's Home. How To Start Looking for a Job Here. (June 30, 2007)
Silver Is Starting To Tarnish (June 26, 2007)
Stock Market in Years That End in "7": (June 19,
2007)
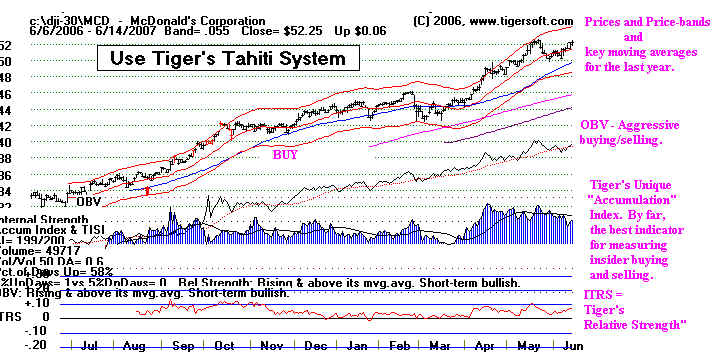
Tiger's Blue-Chip Tahiti System Keeps Making More than 20%/year (June 15, 2007)
Two-Year Notes Call The Tune for Housing and Finance Stocks. (June 27, 2007)
Who's Guarding The Investors' Hen House?. (June 27, 2007)
_______________________________________________________________________________________________________
Saturday - June
30, 2007 San Diego: Tiger
Software's Home.
Want To Start Looking for a Job Here? Here's How.
San Diego is a beautiful place to
live. I came here in 1980 as a result of first
being sent here in the Winter of 1978-9 for a federal conference of state
researchers. I was working in wet and gray (31 flavors) Olympia, Washington.
It was a reward for saving the state a lot of money by using a sampling
methodology rather than requiring yet another form for busy case workers.
I saw lots of pretty girls, palm trees and sunny beaches. Three years
later I moved here. I don't dive anymore, but I swim three or four times
a week at La Jolla cove (shown above) for much of the year. Here are
some places to view San Diego on the net.
Getting A Job in San Diego
Getting a good job here is not very easy, unless you do some advance
planning, engage in some research (which Tiger Software can help you
in) and have some professional help, namely signing up with a good staffing
or recruiting company. You can easily Google
"San Diego" and your field
followed by "jobs" or "career" and, say, "engineering"
or "website
development" or "molecular biology".
One of the things that may
help is for you to directly contact San Diego
companies that are doing hiring in your field. An easy and direct way to
prioritize who to call on is to use Tiger Software and rank the stocks of
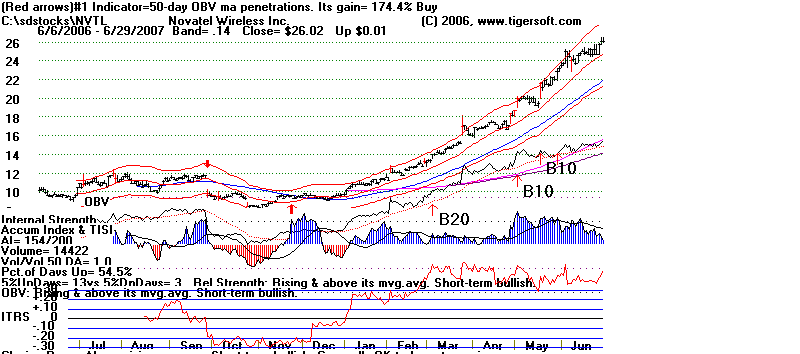
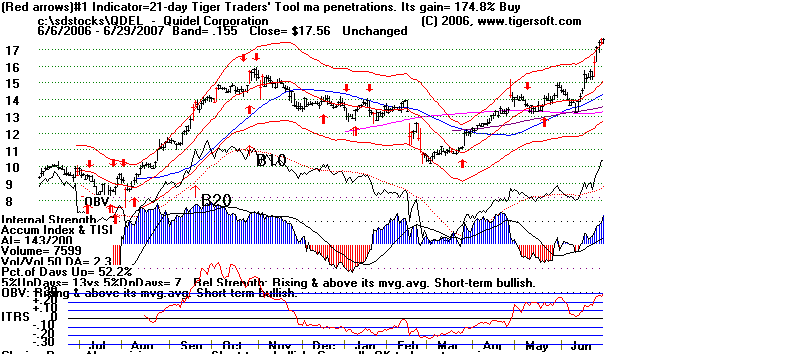
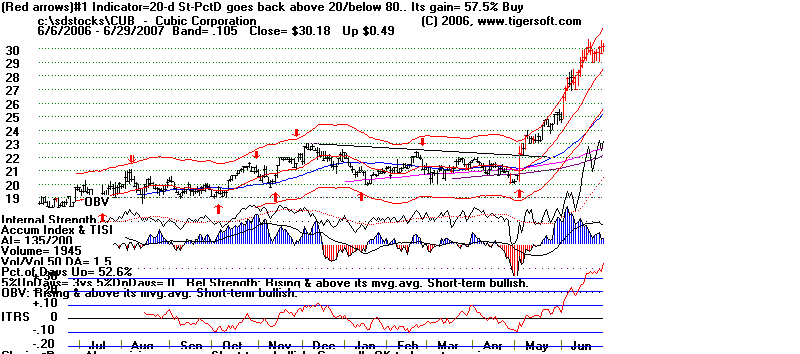
local San Diego companies. I have done this for you by way of illustration.
You will want to check out the following companies. These San Diego stocks
were up more than 30% in the 2nd quarter of 2007 and show the type of high
accumulation that usually promises still higher prices. Since the stock market
is a discounting mechanism where rising stock prices usually predict higher
sales and profits, these companies may well be expanding their work force and
will be a good prospect, though of course, your skills and the companies needs
must still match.
Check out these companies:
NVTL Novatel
Wireless 26.02 +.01
QDEL Quidel
Corp. 17.56
CUB Cubic
Corp
30.18 +.49
See study of San Diego Stocks in 2nd
Quarter of 2007.
======================================================================================
.
Friday - June 29, 2007 New Mexico: Some Pictures and A Story:
It's easy to forget how beautiful the Earth
is. A visit to New Mexico
will remind you. Here are some pictures of this
enchanted land.

Here is a story I like. It is called the
American Tourist and The Mexican Fisherman
A story similar in spirit to the philosophy of Chuang Tzu
A boat docked in a tiny Mexican village. An American tourist complimented the
Mexican fisherman on the quality of his fish and asked how long it took him to catch them.
"Not very long," answered the Mexican..
"But
then, why didn't you stay out longer and catch more?" asked the American.
The Mexican
explained that his small catch was sufficient to meet his needs and those of his family.
The
American asked, "But what do you do with the rest of your time?"
"I sleep late, fish a little, play with my children, and take a siesta with my wife.
In
the evenings, I go into the village to see my friends, have a few drinks, play the guitar,
and
sing
a few songs...I have a full life."
The American interrupted, "I have an MBA from Harvard and I can help you!
"You should start by fishing longer every day. You can then sell the extra
fish you catch.
With
the extra revenue, you can buy a bigger boat. With the extra money the larger boat
will
bring, you can buy a second one and a third one and so on until you have an entire fleet
of
trawlers.
"Instead of selling your fish to a middleman, you can negotiate directly with the
processing
plants and maybe even open your own plant. You can then leave this little village and move
to Mexico City, Los Angeles, or even New York City! From there you can direct your huge
enterprise."
"How long would that take?" asked the Mexican..
"Twenty, perhaps twenty-five years," replied the American
"And after that?"
"Afterwards? That's when it gets really interesting," answered the American,
laughing.
"When your business gets really big, you can start selling stocks and make
millions!"
"Millions? Really? And after that?"
"After that you'll be able to retire, live in a tiny village near the coast,
sleep late,
play with your children, catch a few fish, take a siesta, and spend your evenings drinking
and enjoying your friends!"
Source: http://www.noogenesis.com/pineapple/fisherman.html
======================================================================================
.
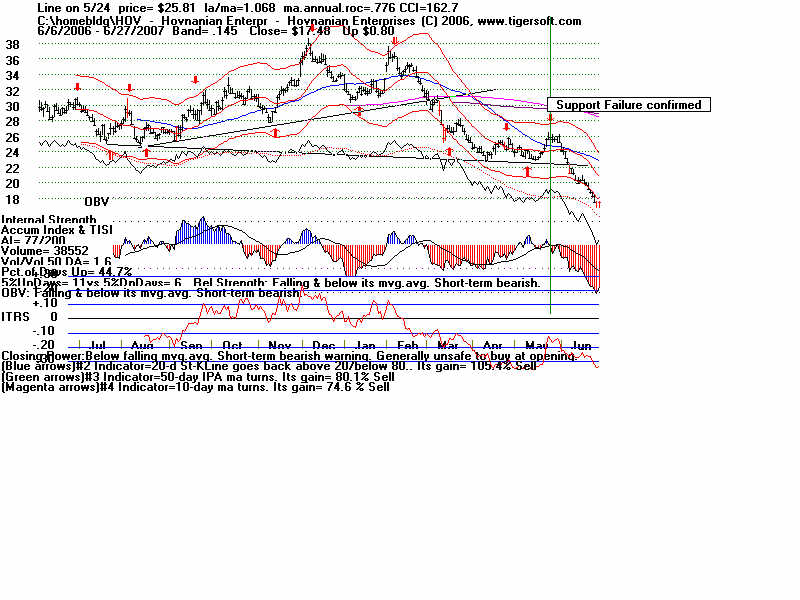
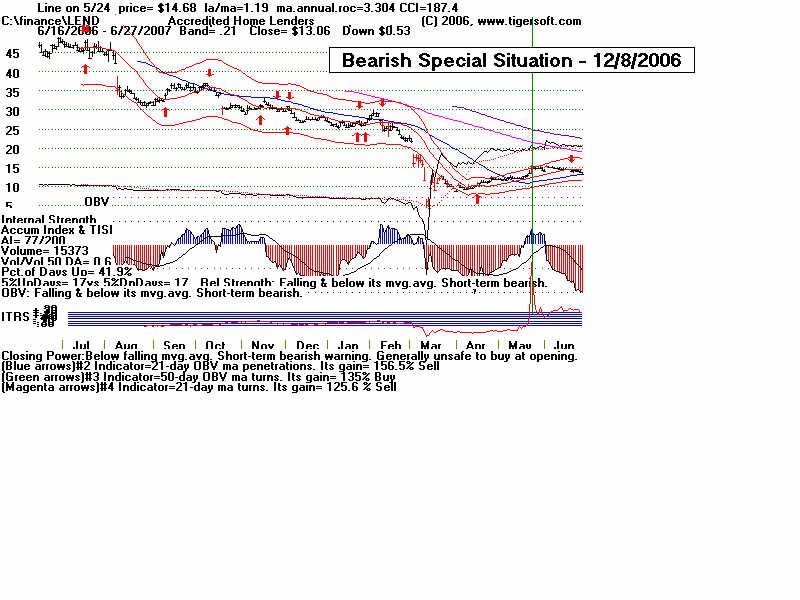
Thursday - June 28, 2007
What Will Housing Stocks Do in A Weak Market?
They Are Collapsing in A Bull Market.
- Housing Correction Continues. No Bottom In
SIght, Yet.
  Here is chart of Tiger Index of 31
Home-Builders Here is chart of Tiger Index of 31
Home-Builders
We picked this are for short selling, because of the heavy "Insider- Informed
Selling"
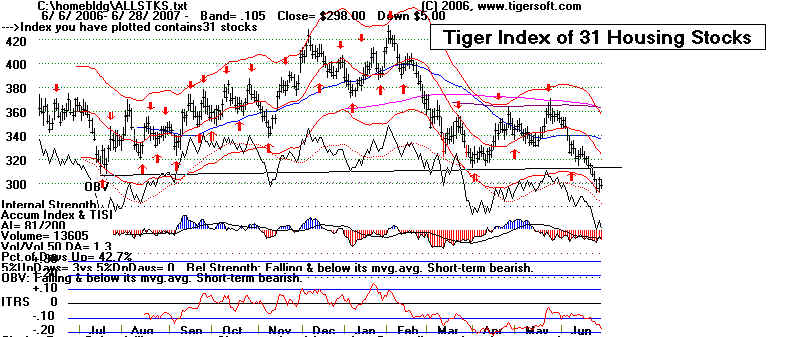
Once you have identified a group to buy or sell, use Tiger's Power-Ranker to pick the
stock.
HOV was our pick as a short sale several weeks ago.
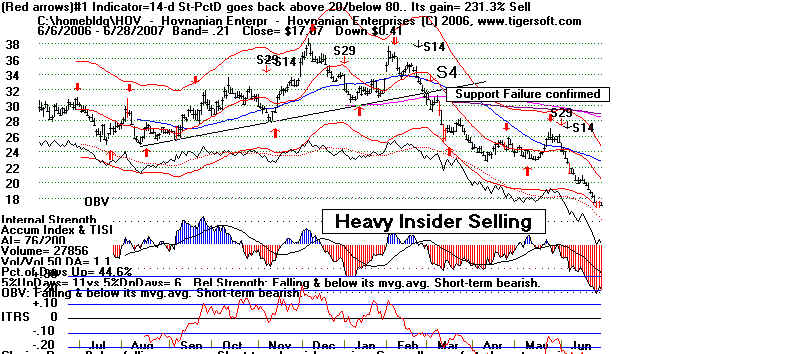
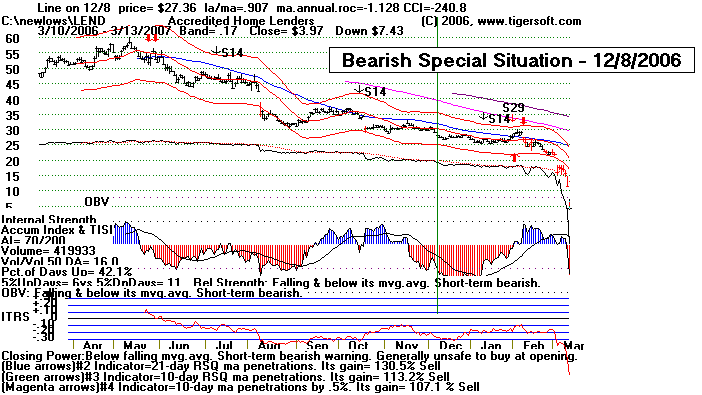
What is scary is how much advantage insiders have over stock holders
when bad news is going to come out. See how badly secondary mortgage
lending stocks fell recently. Insiders always know. Look at the case of LEND.
Odds favor an equally sharp decline for home-building stocks.
If they can't go up in a bull market, what will they do in a weak stock
market environment?
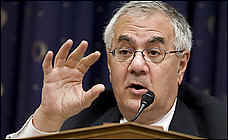
 Bernanke
trips as Congress bashes Fed over lending
Bernanke
trips as Congress bashes Fed over lending
Dems have threatened to strip some of the Fed’s power to write
consumer-protection rules—meaning the Fed chair could lose support
needed to achieve other goals ...
By Craig Torres, Alison Vekshin and Scott Lanman, Bloomberg News
"Democrats led by House Financial Services Committee Chairman Barney Frank blame
a lack of oversight by the central bank for allowing abuses in the subprime-mortgage
market.
See also http://www.realestatedecline.com/
======================================================================================
.
Thursday
- June 28, 2007 - Who's Guarding The Investors' Hen House?
New SEC Chairman Cox and Investor Protection
The issue of a toothless, for show only, Securities and Exchange
Commission will
not go away. On the one hand, Wall Street's crooks
are always busy finding new ways
to rig stocks and fleece investors. On the other hand, the
SEC is charged with protecting
investors and keeping the playing field fair. But it's an
uneven battle. Those on the inside have all
the advantages, especially if the SEC is understaffed and lacks
the will and muscle to
protect investors. I have focused www.tigersoftware.com on this imbalance. I always
come back to the notion that investors have to look affter their
own interests. And one of
the very best is to use Tiger Software's Accumulation Index and also Joe Granville's OBV
Line. Let the market tell its own story. We can
usually spot insider selling, long before it is reported.
I read with
interest how the new SEC Chairman's style and priorities are becoming
clear after being appointed a year ago. When his
appointment was announced, the LA Times
ran an article by Michael Hiltzik on June 9, 2005 with the
headline
Cox's Past Ties to Con Man Raise Questions
"In
the halls of Congress, Rep. Christopher Cox (R-Newport Beach), who has just been
nominated to be the nation's top securities
regulator, stands out for his intelligence.
"When
it comes to the work he performed as a lawyer for one of the state's most notorious
con men, however, he pleads ignorance. Apparently he
was unaware that William E. Cooper
was a crook or that his company, First Pension Corp., was a
fraud. In 1985, when Cox assured
state securities regulators that a new Cooper investment
scheme would be "low risk" and an absolute
boon to small investors trying to save for retirement, he
was apparently unaware that the scheme
was really designed to hide the losses already incurred by
Cooper's investors and to keep the scam
alive. In 1991, when Cooper hosted a fundraiser for Cox at his
Villa Park home, Cox thought of him
as merely "an upstanding member of the community.
"A few years after
that, the fraud finally exposed, Cooper and two partners went to jail. And now,
Cox has been nominated by President Bush as chairman of the
Securities and Exchange Commission."
Back in 1995, as a
Congressman, Christopher Cox had authored a bill which became the
Private Securities Litigation Reform Act of 1995. This changed the
long-standing Securities Exchange Act
of 1934. It required a plaintiff to identify in his
complaint each Insider statement which is alleged to have
been misleading. Seems reasonable.
Most important, Cox's legislation required the shareholder-plaintiff to prove that the
Insider knew
the challenged statement was false at the time. This
is important because shareholders often do not
have access to proof of what the state of mind was of the
Insider. Again quoting from wikopedia.com,
"This requirement allows defendants to obtain dismissal of
cases where the plaintiff merely points to a
false statement and declares that the defendant "must have
known" that the statement was false,
based upon his position within the company. This requirement has frequently proven difficult for
plaintiffs
to overcome because, without the benefit of discovery, plaintiffs
often do not have access to witnesses or
documents that might prove the defendant's state of mind in
making the false statement." Critics called
this piece of legislation, the "Ken Lay Protection
Act".
Background: The 1934
Securities legislation:
(quoting now from wikepdia.com) "gives shareholders the right to bring a private
action in
federal court to recover damages the shareholder sustained as a result of securities
fraud.
To make a such case against an insider, the Supreme Court as ruled that the:
1. The defendant made a "material misrepresentation or omission";
2. The defendant intended to make the material misrepresentation/omission,
or acted with recklessness in making the misrepresentation/omission);
3. The material misrepresentation/omission was made "in connection with
the purchase or
sale of a security";
4. The plaintiff who was allegedly victimized by the fraud relied upon the
material
misrepresentation/omission.
5. The plaintiff suffered an economic loss as a result of the alleged fraud; and
6. The plaintiff can allege and prove "loss causation," which means that
the allegedly
fraudulent misrepresentation or omission caused the plaintiff's economic loss.
See Dura Pharmaceuticals, Inc. v.
Broudo, 544 U.S. 336 (2005).
Yesterday, CNN reported that the new SEC Chairman had appeared before the House of
Representative's Financial Services
Committee, chaired by Massachusetts Barney Frank
 To the surprise of his critics, the
hearing was not heated To the surprise of his critics, the
hearing was not heated
or contentious. But what did emerge
was that the SEC had voted to support investors in a
Supreme Court case that could determine
liability for Enron's "secondary actors," but after
talking to President Bush, Cox
discouraged the SEC and the Solicitor General from acting
as a "friend of the court"
(amicus curiae) and siding with the investors. President Bush stated
it would be better for business and the
economy if the SEC regulated insiders, rather than
letting independent lawyers do it through
investors' law suits.
(http://www.cfo.com/article.cfm/9333431?f=related&x=1 )
The SEC has sued " secondary actors for helping Enron to misrepresent its
financial health
before its collapse in 2001.
As of February, 2007, the SEC has collected $440 million from
settlements and enforcement actions
against individuals and business partners (including some
banks) that it accused of
participating in Enron's fraudulent activities. The SEC
has not yet
announced a distribution plan for the
funds!. (Sarah Johnson, www.cfo.com - June 13,
2007).
See http://www.washingtonpost.com/wp-dyn/content/article/2007/06/13/AR2007061302124.html
======================================================================================
.
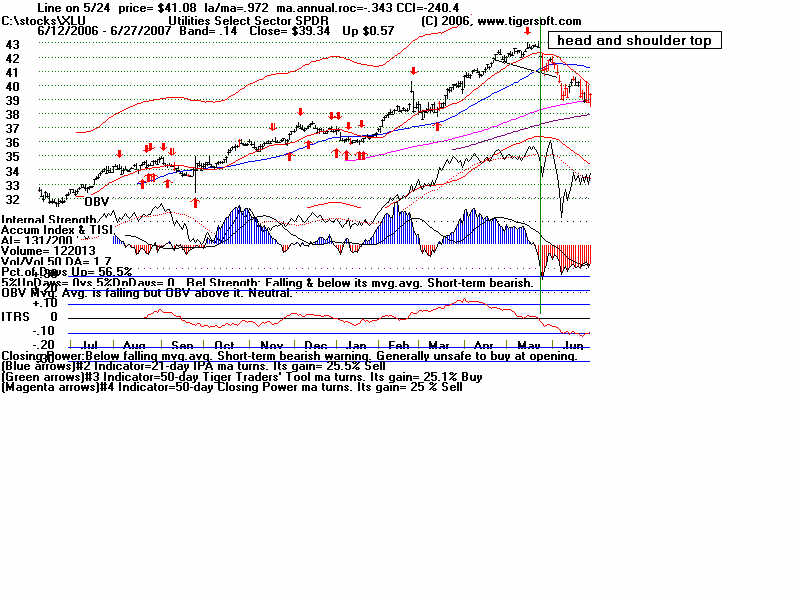
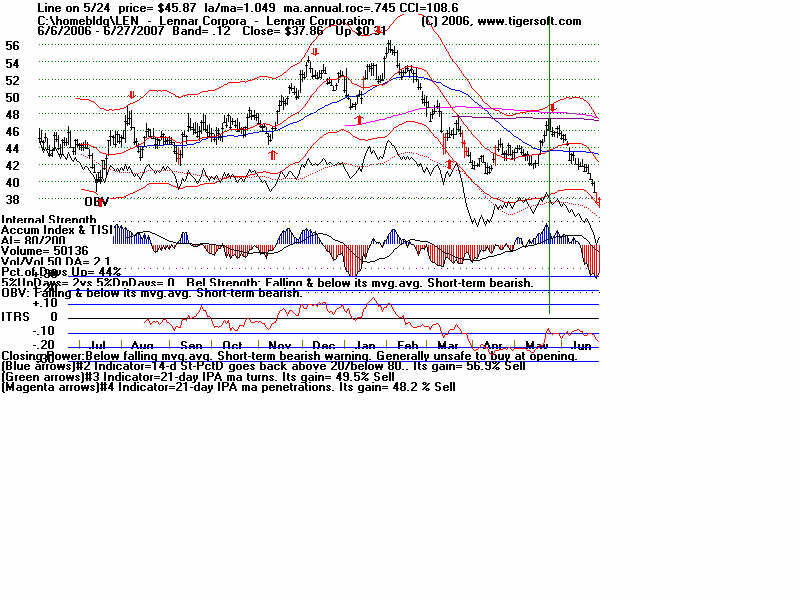
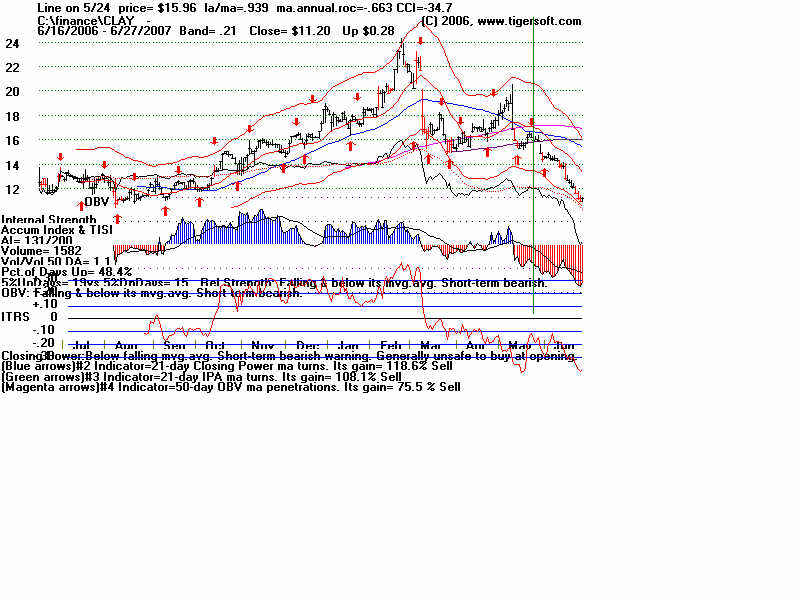
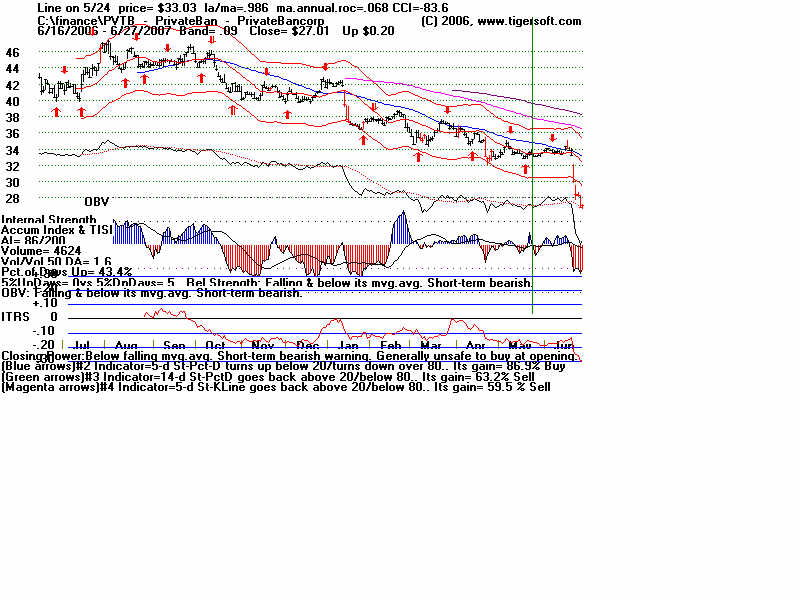
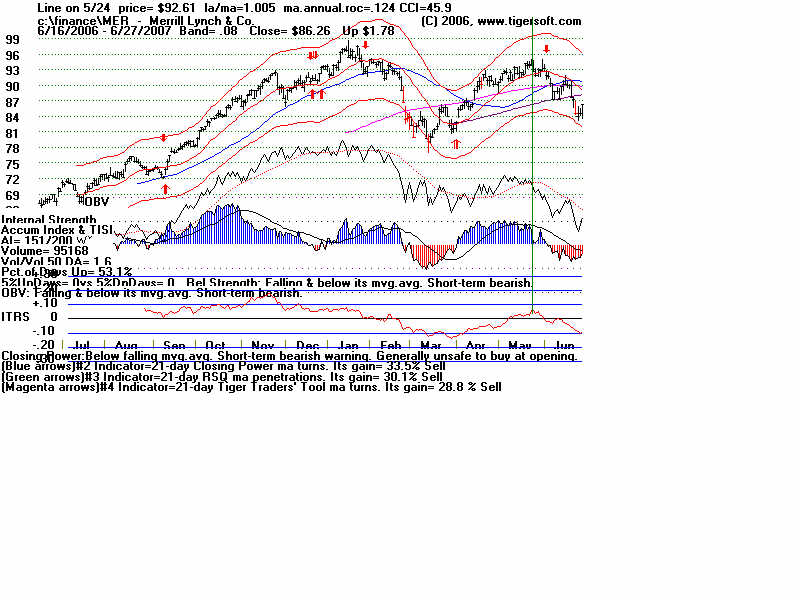
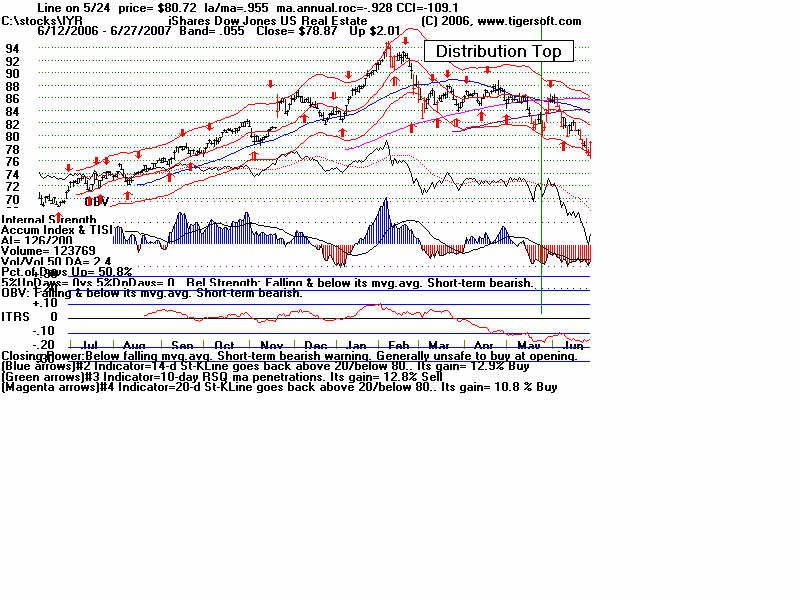
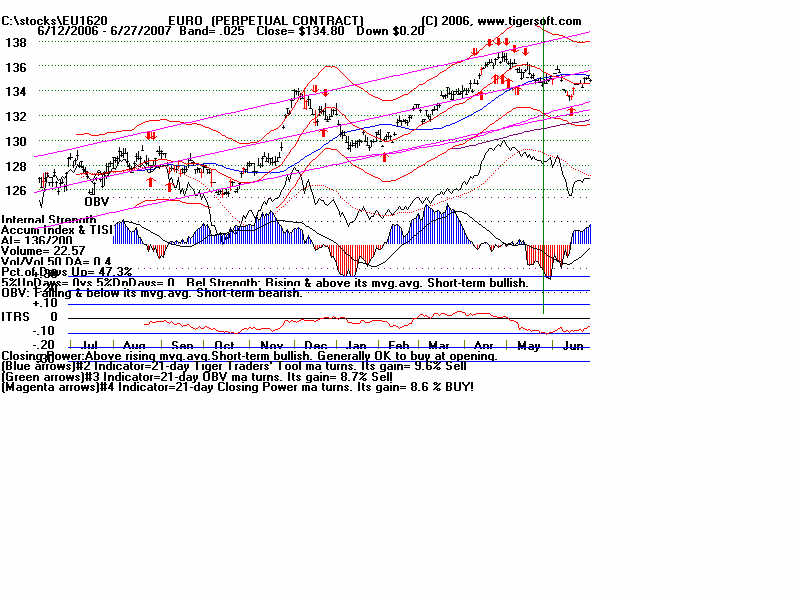
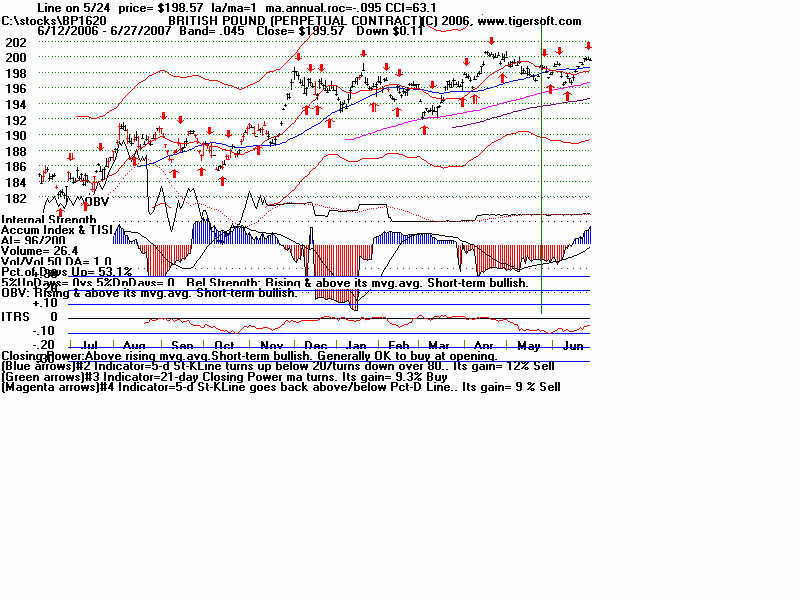
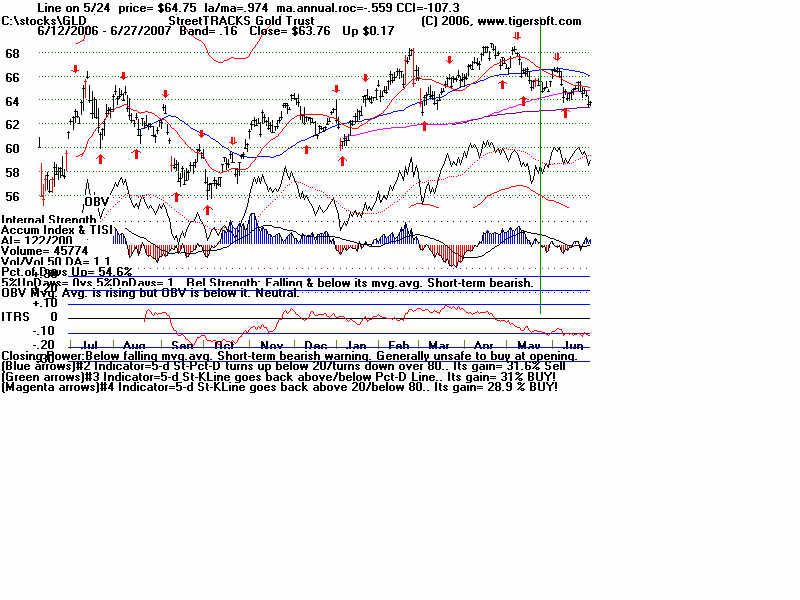
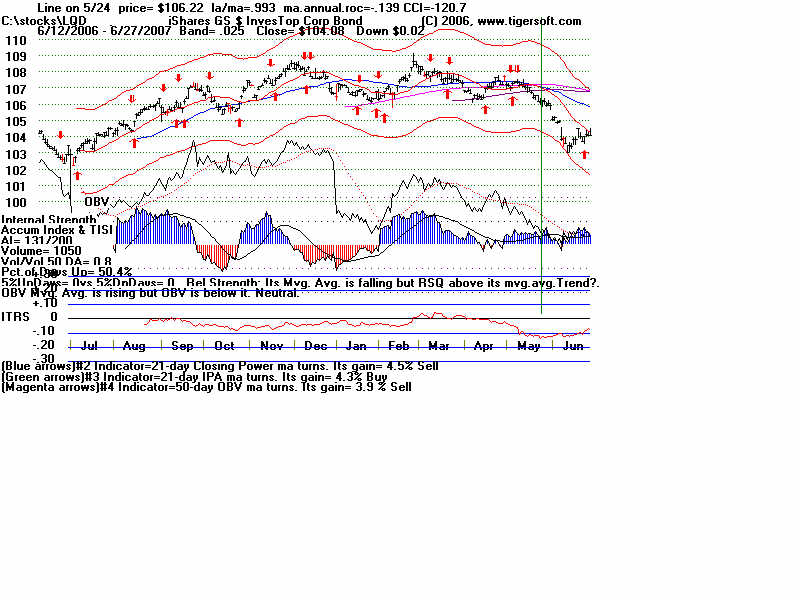
Wednesday - June 27, 2007
Watch the 2-year
Treasury Notes (TU1620):
Two-Year Notes Call The Tune for Housing and Finance Stocks.
Traders should watch the 2-year Treasury notes. Many stock groups rise
and fall in synch with short-term interest rates rates.
I present data here to show
how substantial the declines in just a month are for
home-building and finance
stocks when the Treasury Notes turn significantly weak
Below is the chart for the
year note's perpetual contract for 2-year Treasury
Notes, as created by Dial Data.
Keep in mind that as the
2-Year Treasury Notes rise in price interest rates
are falling. In the chart below, you can see that
there had been a rising channel
of prices until mid-May, That is when the chart broke
out of the bullish uptrend.
And that is when Utility Stocks, Housing Stocks, Finance
Stocks, Real Estate
Investment Trusts, The Dollar, Gold and Bond Funds
have started to weaken.
As they weakened, the US markets turned soft. And the
NYSE Advance-Decline
Line turned down and the number of new lows start to rise
sharply.
Tiger Software users can
watch this chart and allied charts closely. The dip
of the Tiger Accumulation index in on April 10th to a
new 12 month low was an
early warning that this instrument, and all the investment
vehicles tethered to it, would
weaken. Note the
trend-break of this vehicle's uptrend was on 5/24.
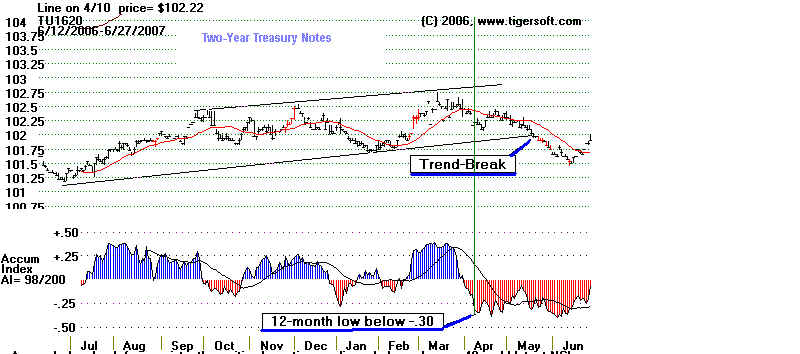
Here are the charts of some
of the investment vehicles ompacted by the change
in trend of short-term interest rates. Recall
from above that the trend-break of the
Two-Year Notes was on 5/24. Housing stocks are, by far, the quickest to
react.
Utility Stocks: XLU (Utilities' ETF) fell from 41.08 to low
of 39. Now 39.34
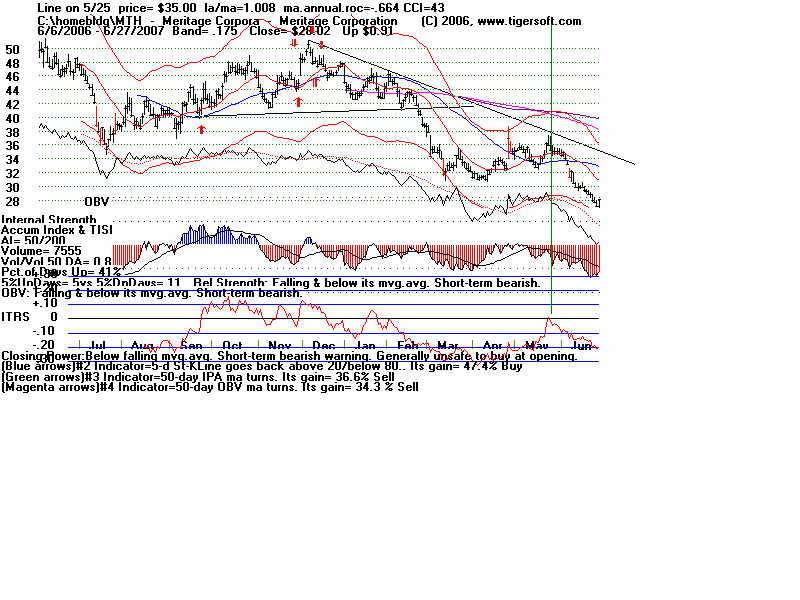
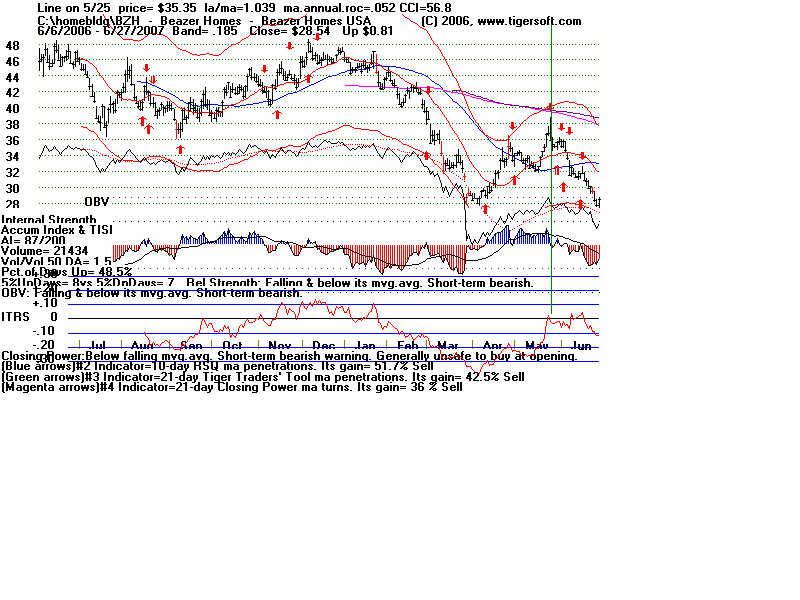
Housing Stocks Tiger Index of 31 Housing Stocks fell from 355 to 302 with
today's close
5/24 6/26
HOV 25.81
17.48 32.3% decline
MTH
35.00 28.02 19.9% decline
BZH
35.35 28.54 19.3% decline
LEN
45.87 37.86 17.5% decline
Finance Stocks
5/24 6/26
CLAY 15.96 11.20
29.8% decline
PVTB 33.03
27.01 18.2% decline
MTG 65.20
57.90 11.2% decline
LEND 14.68 13.06
11.0% decline
MER 92.61
86.26 6.5% decline
Real Estate IYR (Real Estate ETF) fell
from 80.72 to a low of 76.5 and
rallied to 78.87 today.
Real Estate Investment Trusts VNQ (REIT ETF) had already formed bearish head and
shoulders pattern. It fell from 74.12 on 5/24 to 70 before reversing today.
5/24 6/26
Euro
134.60
134.80 This topped out on 5/1 at its upper Tiger Regression
channel.
Br. Pound
198.57 199.57 (It will take more than talk by Fed of raising
interest rates to
strengthen the dollar versus the British Pound.
Gold
64.75 63.76
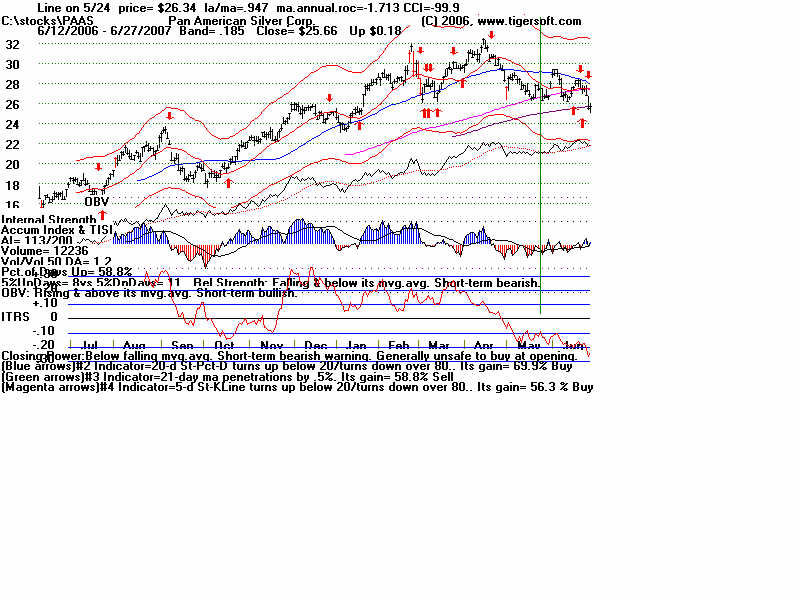
Silver Stocks
PAAS 26.34
25.66
SSRI 36.10 34.11
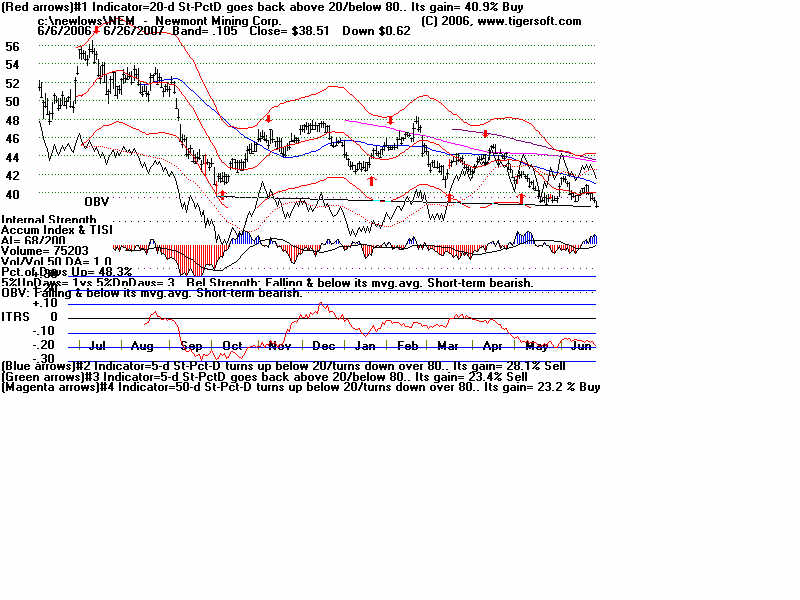
NEM
39.45 38.71
Bond Funds.
LQD 106.22
104.08 Shares GS $ InvesTop Bond Fund
- Biggest Bond Fund. -
Our Nightly Hotline ($295/year) examines these charts and points out the inter-market
relations. HOV, show below, was picked as a short sale on our Hotline.
TigerSoft makes
the business of profitable trading very easy.
======================================================================================
.
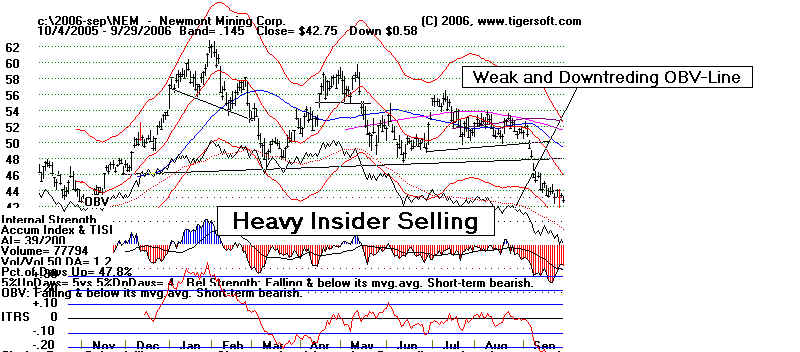
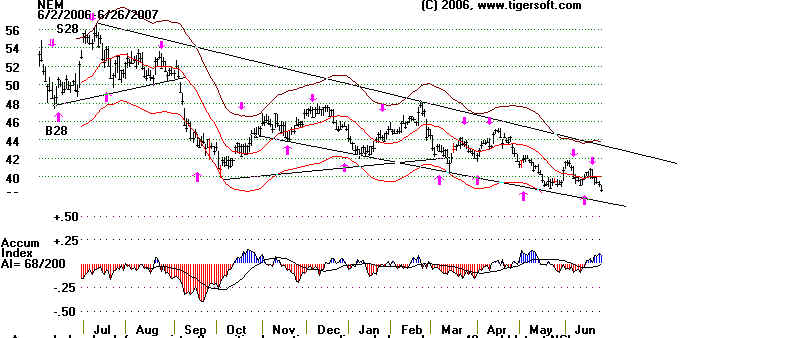
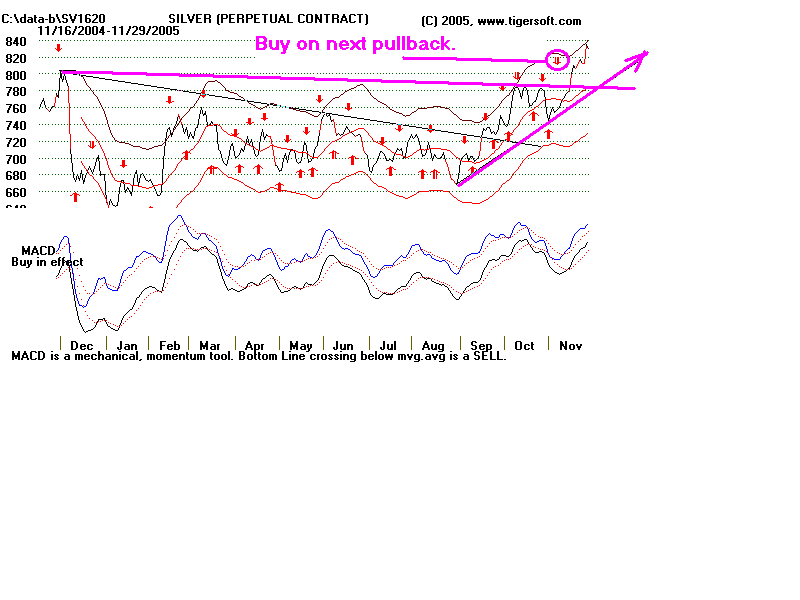
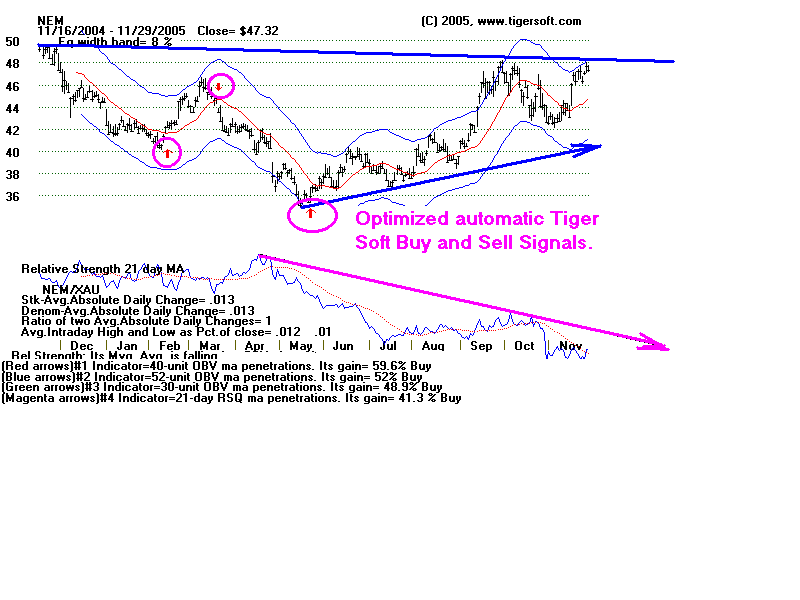
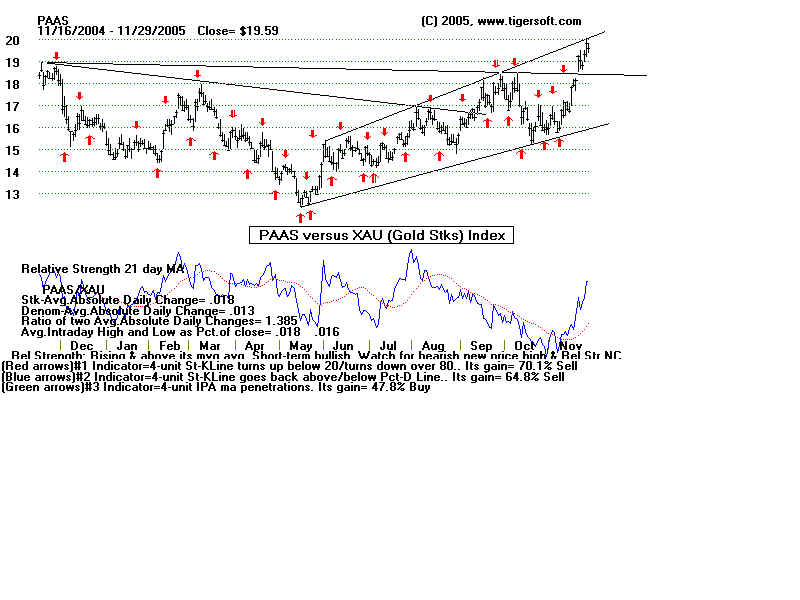
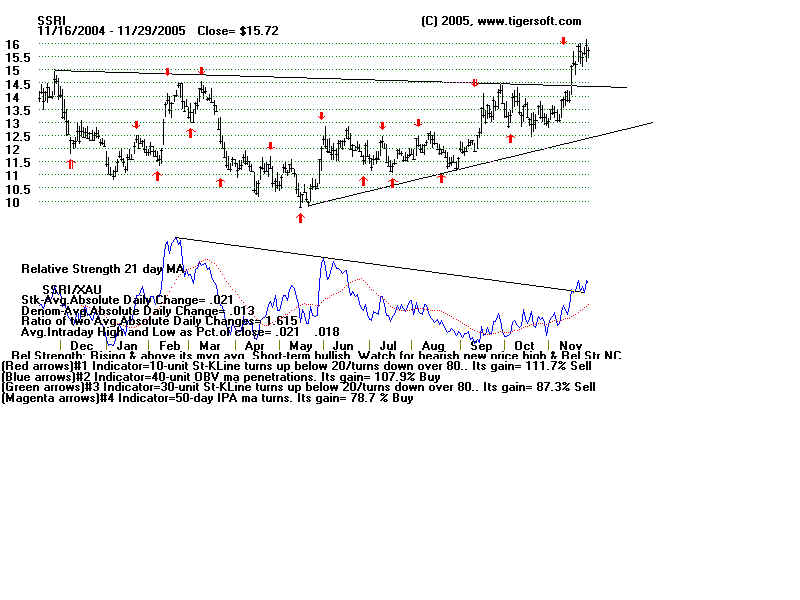
Tuesday - June 26, 2007
Silver Is
Starting To Tarnish.

On
11/29.2005, I wrote for subscribers that "Gold has just broken $500 an ounce....
Silver had just surpassed $8.00 for the first
time in 20 years". I noted the bullish breakouts
of NEM, PAAS and SSRI.
But nearly all good things and certainly all bull markets come to
an end eventually. NEM showed heavy insider trading when it was above 50 and we
recommended it as a short sale. We now know that insiders were dumping the stock
because they knew that their Central Asian properties were being nationalized and
their
earnings outlook was poor. They waited until the stock was down 10 points to tell
their
shareholders. It is now 38 and threatening to make new lows for the last
year.
Newmont - 2005-2006
Newmont 2006-2007
SSRI has risen 150% since TigerSoft
recommended it here in November 2005. It
keeps
finding more silver in South America. But even it, the strongest of the gold and
silver stocks, has turned bearish, having shown heavy distribution from the Tiger
Accumulation
Index and completed a bearish price-pattern.
As traders, we should also recognize the
possibility that SSRI will hold above 32
and then come charging back above 36. (False moves to the down-side are part of this
stock's 'MO'.) A move quickly back above 36 would be
bullish and get us to buy it again. The
current decline owes, I think, to the Fed not wishing to let the
dollar weaken any further. As the
British Pound reached $2 and the EURO made 5 year highs a month
ago, they have tried to drive
up the dollar by threatening to raise interest rates. In
the long run, the dollar looks very weak
and silver and gold are natural hedges. But for now, SSRI has broken key support and I would
advise staying clear of it.
Silver Standards - 2006-2007
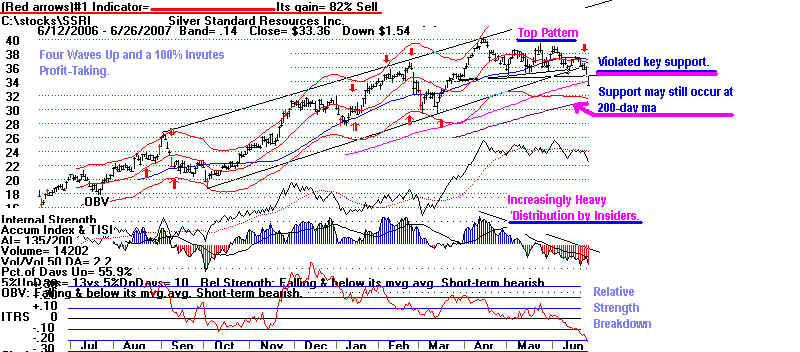
Silver 2006-2007
Silver (SL1620 Perpetual Commodities' Contract using Dial
Data)
shows distribution from our Accumulation Index and
very aggressive selling from
the downtrending OBV
Line. The price pattern is a bearish head and shoulders
pattern, whose neckline
has already been violated..
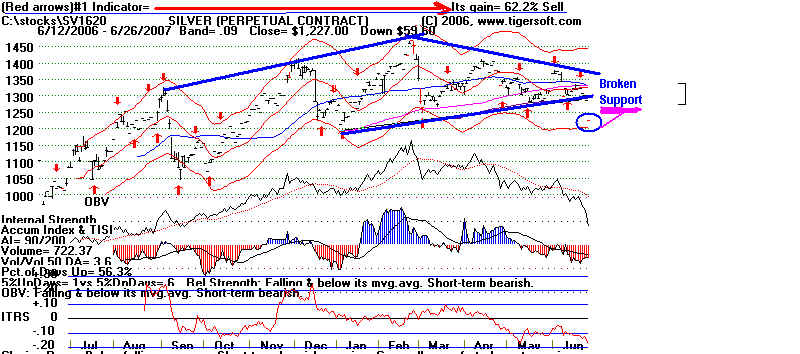
 So, what's going on
here with Gold and Silver?
The Federal Deficits So, what's going on
here with Gold and Silver?
The Federal Deficits
are as massive
and scary as ever. I think it's that interest rates are going to be
raised by the Fed
in the next few months or even much sooner even, as they defend
the dollar.
More about this linkage tomorrow.
======================================================================================
.
Monday - June 25, 2007
Music, Musical Stocks and Music of the Stock Market.
Music endures and is a universal language. I am happy to share
my musical tastes here.
I grew up listening to Hank WIlliams.
It's his songs I sing in Karaoke here in San Diego.
Some have called him the Shakespeare of the Hills. I also especially like Johnny
Cash, Marty Robbins, Tom Jones and Slim
Whitman. There are lots of excellent
Karaoke singers here in San Diego. Many have and do sing professionally.
(In fact, once, just once, someone asked me if I was a professional singer, after I
did
my own version of "Don't Worry", a Marty Robbins song I do a la
Slim Whitman.
I won't soon forget that moment in the sun.) You are welcome to visit My Music Page.
Apple (AAPL) and Steinway (LVB) come to
mind as stocks you will want to consider
purchasing if you are looking to buy a musical stock. APPL trades very well
being bought
and sold using a simple cross-overs of 5-day moving average. Our software
shows that
someone using this simple system of buying and selling would have gained 94.4% for
the last year. The biggest intra-day loss would only have been 5.1%. There
were
17 trades. The nine winning trades averaged gains of 9.6% each. The
losing trades lost
only an average of 1.7% apiece. Monday's are the best day of the week for the
stock,
being up 62.5% of the time. Friday's are the weakest being up only 37.0% of
the time.
The stock opens much more regularly higher (63% of the time for the last year than
it
closes above the opening (48% of the time. AAPL has nearly doubled from a year ago.
And it is up 54% of the time, day-to-day. All these things Tiger Software
reveals about
any stock.
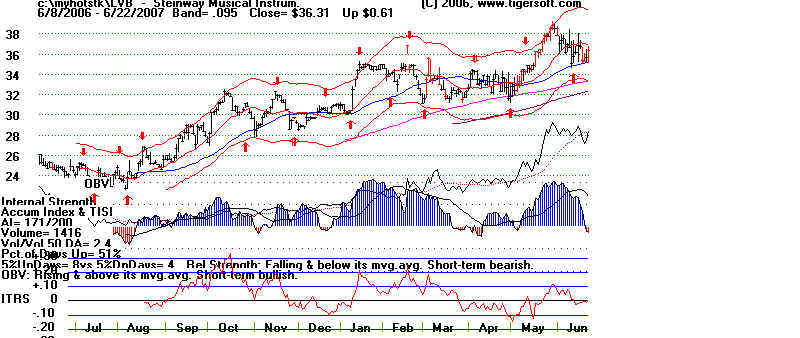
Steinway LVB) shows a lot of blue Tiger Accumulation,
which makes it attractive.
Its aggression buying line (OBV) is, at least, as strong as the price
movement. This
is bullish. And using Tiger's automatic buys and sells at the next
days' openings,
without any short sales, would have gained a trader 67.4%. $10,000
invested this way
a year ago would have become $16,740, allowing $40 per trade for commissions.
public loves APPL and buys it at the opening. All nine trades would
have been profitable.
The biggest paper loss would have been 10.6%.
, As you can see, the Tiger programs would have helped you make a lot of
money here quite
easily. These tools are available with any stock or index. Get them
today. Why wait? We have
thousands of happy customers.
Now something off the beat, as it were. Here is a site that
creates music from the stock market' s own
fluctuations. They use the movements of prices to provide a melody.
collision detection: Music based on stock-market activity
Where is the Music Industry headed? Music: The New Stock
Market . . .
A stock market for music. McBride's model says that
"even a band selling 100000 units a year becomes profitable."
Is this what the future looks like? .
http://www.cultureby.com/trilogy/2007/01/a_stock_market_.html
And where do we go to sing. Check out: www.wookaraoke.com
Saturday evening - Sheraton's Shooters Lounge - La
Jolla.
and Patrick Hiill's Show on
Wednesday evening at Ramada Inn in Kearney Mesa.
======================================================================================
.
Sunday - June 24, 2007
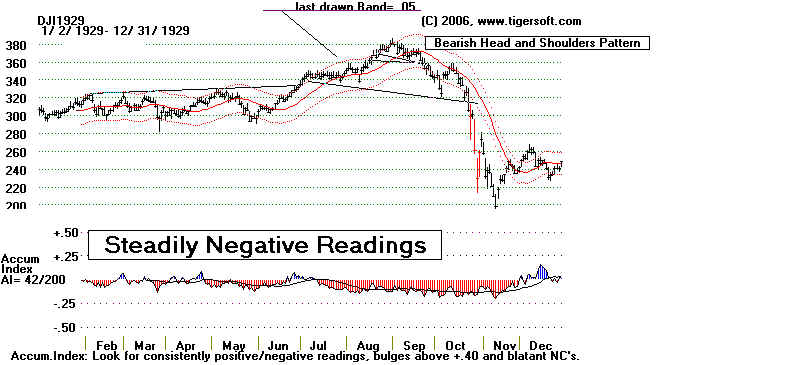
The 1929 Crash: Could It Happen Again? Yes-
Absolutely.
Looking
back, we can see that the Tiger programs would have easily
spotted the top as it was being made in the Summer of 1929. The Tiger
"Accumulation Index" had been mostly very negative for months. Big
Money
was getting out of the market. They were "distributing" their
shares to
the naive and uninitiated. The
amount of distribution is often a very good sign
of how deep the resulting decline will be. In 1929 it was massive.
"Big Money"
did not have to start dumping their shares until the neckline of the classically
bearish
head and shoulders pattern was violated early in the October 1929 Crash.
If you are lucky, you will
never see a chart of a major index showing such heavy
and steady "distribution" as in 1928-1929, over such a long a
period. But the charts
of 1969, 1972-1974, 1987 and 1999-2000 do show that when tops take a long time to
take shape, the resulting declines are deeper and last longer, too. All
the red
distribution in the Tiger chart proved quite prescient, as the DJI declined until
1933
and lost 80% of its value.
The Tiger Accumulation
Index was invented by me (William Schmidt, Ph.D.)
in 1972. Until 2007, I had not looked at the
1929 data. So, this chart is one
more important validation of the importance of the Tiger "Accumulation
Index".
While in graduate school at Columbia University, I had
worked for Smith Barney (then
Harris, Upham) in their headquarters in NYC and had seen the way institutions
"distribute" big blocks of shares during the day and at the close. I did
the first calculations
with this tool on a Bowmar calculator late in 1972. At first, I thought I had
made an
error in the formula, because all the charts showed very heavy distribution
(negative
Accumulation readings). But I had not. The 1973-1974 bear market
was about to
unfold.
 Here
is a song from February 9, 1930 by George Olsen,
Here
is a song from February 9, 1930 by George Olsen,
called "I'm In The Market For You"
Play It.
(Source: http://www.btinternet.com/~dreklind/thecrash.htm)
I'll have to see my broker
Find out what he can do.
'Cause I'm in the market for you.
There won't be any joker,
With margin I'm all through.
'Cause I want you outright it's true.
You're going up, up ,up in my estimation.
I want a thousand shares of your caresses too.
We'll count the hugs and kisses,
When dividends are due,
'Cause I'm in the market for you.
Could A Crash and A Depression like 1929-1933
Happen Again in the US? Yes!
Absolutely. Though you won't
see this said very often by orthodox economists or
politicians. Keep in mind that the US is now much deeper in debt and
has a far worse
balance of payments problem than it did in 1929. True, margin
requirements are 50%,
not 10%. But a severe world-wide equities' decline from a wildly
over-bought condition
would savage the buying power of many, many businesses and consumers around
the globe.
The US Federal Reserve Board has, except for brief periods, always been much
more
interested in finding ways to finance the US federal deficit than guarantee
reasonable
levels of employment. So, I would expect them to raise, not
lower, interest rates sharply
when there is a run on the dollar or a severe oil shortage. That will
make matters much worse
on Wall Street and for many, many businesses and consumers. And when Congress
tries finally to
protect American jobs with tariffs, we will be going back to the economic
nationalism of
the Smoot-Hawley Tariff of 1930. Moreover, note how the Democrats have
now abandoned
Keynesian fiscal policies as they promise to balance the federal budget
in order to besmirch
Republicans for the massive budget deficits of the Bush years. Many
unorthodox economists
correctly have pointed out that each US recession since 1948 has been deeper
and required
larger and larger deficit governmental spending to end the recession.
Moreover, I doubt
if there is another deep turn-downwards in the US economy, that we can
we really expect the
Japanese and Chinese, who have already financed so much of the US debt, to
allow
the US to deliberately further unbalance the budget to the extent necessary
to jump-start
a US economic recovery? Lastly, civil unrest would be highly likely, as
the difference between the
haves and the have nots in the US is now back to levels not seen since
the 1920s.
======================================================================================
.
Friday - June 22, 2007 Seasonality and The
Market
Spring Fever Joke
Four high school boys afflicted with spring fever skipped
morning classes.
After lunch they reported to the teacher that they had a flat tire.
Much to their relief she smiled and said, "Well, you missed a test today so
take seats apart from one another and take out a piece of paper."
Still smiling, she waited for them to sit down. Then she said:
"First Question: Which tire was flat?"
......................................................................................................................
Summer Solstice
In the northern hemisphere, the longest day of the year (near June 22)
when the Sun is farthest
north. Shakespeare's Midsummer Night
occurred on this day. The Druids believed midsummer was the
"Apex of Light," when the Oak King gave way to the gloomier
Holly King who reigned until the Winter Solstice.
Astrology, Seasonality and the Stock Market
"All signs are pointing to a downturn in the stock market, and there
are multiple scandals going on in our government..."
Lynn Hayes - astrodynamics.blogspot.com/2006/06/summer-solstice-and-nodal-shift.html
Summer Rally? How does the market behave
behave from June 22nd
for the next two months when it has already had a big gain in the first
part of the year, as in 2007? The new book I am writing gives us the
answer for the DJI-30.
There were 25 cases when the DJI-30 rose steadily in the first 5 months
of the year and was up more than 12%. In 7 (28%) cases, the DJI rose steadily
for the rest of the year. In the other 72% of cases, tops that brought declines of more
than 10% followed before the end of the year. Consider how often these tops
took place in the subsequent months from June through December. From this
we may conclude that there is a 68% probability of at least a 10% correction
by the end of October this year.
June 1950, 1954
July 1919, 1933, 1943, 1975, 1986, 1997, 1998
August 1987, 1999
September 1955, 1967, 1976
October 1922, 1927, 1989
November 1925, 1935
December
A top in July is the most likely scenario for 2007, but
there is a 28% chance,
based on these case, that there will be no significant top. Using Peerless
will give us the best read on the market as time goes by this summer. Nearly
all the significant tops were called by Peerless as they were occurring or
soon before or afterwards..
1915 - Ascending triangle breakout at 72.5 and rallied
strongly to 100 by end of year.
1919 - 10% correction starting on 7/14 and lasting until 8/20. Peerless will show
you how
this top would have been spotted.
1922 - Flat topped breakout and DJI peaked on 10/16
1925 - Flat topped breakout and DJI did not peak until 11/6.
1927 - Early July breakout and steep advance until 10/3. Peerless
will show
you
how this top would have been spotted.
1933 - DJI-30 peaked on 7/19 and fell 17% in 4 trading days. Peerless
will
show
you how this top would have been spotted.
1935 - June breakout led to a strong advance until 11/20.
1943 - DJI peaked on 7/16 and fell 11% over next five months.
Peerless will
show
you how this reversal would have been spotted.
1950 - DJI peaked on 6/12 and then fell 15%. Peerless will show
you how
this reversal would have been spotted.
1954 - Breakout in DJI-30 in late June. The DJI rallied
for the rest of the year,
1955 - DJI rallied until 9/23 and then fell 10%. Peerless will show you
how
this reversal would have been spotted.
1967 - DJI rallied until 9/25 and then fell 10%. Peerless will show you
how
this reversal would have been spotted.
1975 - DJI rallied until 7/15 and then fell 10%. Peerless will
show you how
this reversal would have been spotted.
1976 - DJI rallied until 9/22 and then fell 10%. Peerless will
show you how
this reversal would have been spotted
1983 - DJI rallied until January of the
next year.
1986 - DJI rallied until 7/2 and then fell 10%. Peerless will
show you how
this top would have been spotted.
1987 - DJI rallied until 8/26 and then fell 36%. Peerless will
show you how
this top would have been spotted.
1989 - DJI rallied until 10/9 and then fell 10%. Peerless will
show you how
this top would have been spotted
1991 - DJI moved sidewise and up all year.
1993 - DJI moved sidewise and up all year.
1995 - DJI moved sidewise and up all year.
1997 - DJI rallied until 7/31 and then fell 15%. Peerless
will show you how
this top would have been spotted.
1998 - DJI rallied until 7/20 and then fell 20%. Peerless
will show you how
this top would have been spotted.
1999 - DJI rallied until 8/24 and then fell 20%. Peerless
will show you how
this top would have been spotted.
2003 - Flat topped breakout in August and DJI-30 moved up for rest of year.
Seasonality has its fans among stock market investors.
Tiger believes in its value. For example, the TigerSoft programs
tell us that after June 21sth since 1965 the DJI has been
weak for two weeks and then gets stronger.
Holding Period Avg, Pct
Change Pct. of Years
in DJI-30
that DJI-30 was up.
---------------
----------------- --------------------
1 trading day
0.1%
62.5%
2 trading days
0.0%
50.0%
3 trading days
-0.2%
52.5%
5 trading days
-0.3%
37.5% 1 week
10 trading days -0.5%
40.0% 2 weeks
21 trading days -0.4%
50.0% 1 month
42 trading days 0.2%
60.0% 2 months
Wednesday - June 20, 2007 Bush Vetoes Stem
Cell Research.
His approval rating is reportedly now below 25%.
Bush's arrogance and anti-science
irrationalism is hurting American biotechs.
He's wasted a trillion tax dollars in his "Iraq-Nam". Meanwhile, worthy
bioscience
is neglected and harmed.
Look at two stocks. They are typical of the malignant
neglect Bush has shown biotechs.
STEM .....
StemCells Inc
ASTM ..... Aastrom
Biosciences Inc.
BBH .... Biotech
Index
Tiger
Charts of these - 6/19/2007
Both show steady out-flowing of investment capital.
======================================================================================
Tuesday - June 19, 2007
Big Declines in Year ending in "7"
Coincidence or
Something Significant?. I have my views.
But did you
know that years ending in "7" have since 1887 always had a
significant pullback
or bear market? My new book Peerless
Stock Market Timing: 1915-2007 will
help clarify and explain the phenomenon. The average DJI-30 Decline at some point in a
year year ending in "7" is 23%! With the DJI up a record 51 months without
a 10% correction, now would be a good time to start using Peerless Stock Market Timing.
Table FALLS IN
YEARS ENDING IN "7"
1837 Panic
......
1887 September 19
(-2.24%) & October 12 (-2.29%)
1897 September 21
(-3.95%) & October 12 (-3.90%)
1907 Declined whole year from 90 to 55 in
November
37% decline.
Major banking panic October 22.
---------------------- My study starts in 1915
-----------------------------------
1917 Early June peak at 99.... Bottom in December at 66 ... 33% decline.
...........................................................................................................................................
1927 Peak on 10/4 at 200... Fell to 181 on 10/24... 9.5%
decline
.....................................................................................................................................................
1937 Peak was at 190 on
8/16 ... Fell to 113.6 on 11/24 October
18 ...40% decline
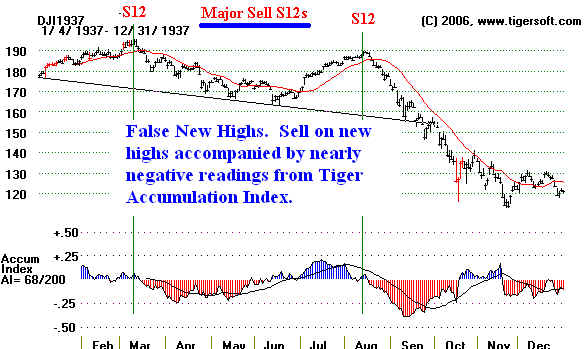
.....................................................................................................................................................
1947 Peak was at 184 on
2/11... Fell to 163.60 on May 20.
...10.9% decline
On
going- bear market which was started with major "Sell S12" on October 14, 1946
......................................................................................................................................................
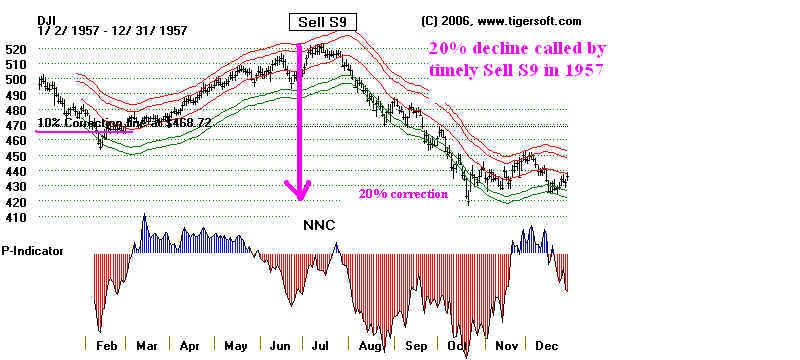
1957 Peak was at 521 on
7/12... Fell to 419.80 on October
22. ...19.4% decline
Classic "Sell S9" at upper 3.0% band.
"Sell 12": Tip off was Accum.Index was <+.05 at upper 3% band.
Credit crunch. Sputnik
.....................................................................................................................................................
1967 Peak
was at 943 on 9/25... Fell to 826 on March 22. ...12.4% decline
Timely Major Sell
.....................................................................................................................................................
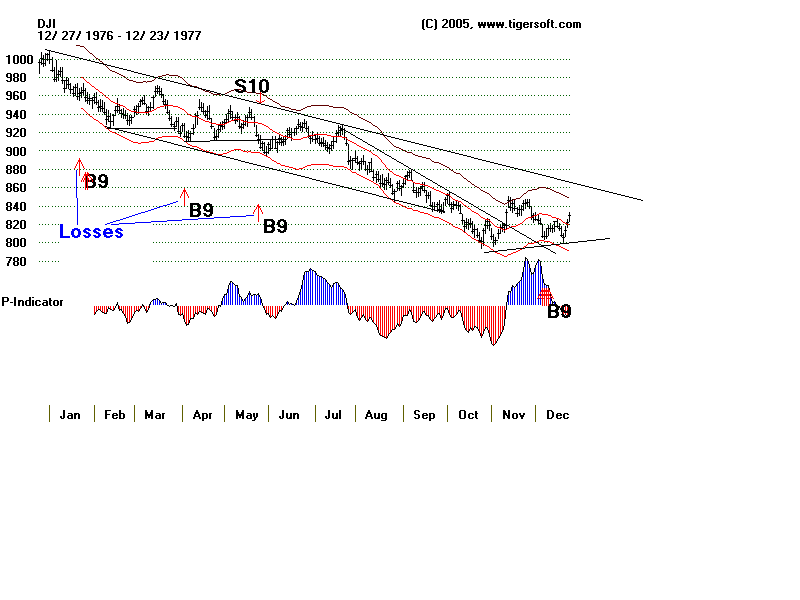
1977
On-going bear market which did not bottom until March 1978...
...19.0% decline
......................................................................................................................................................
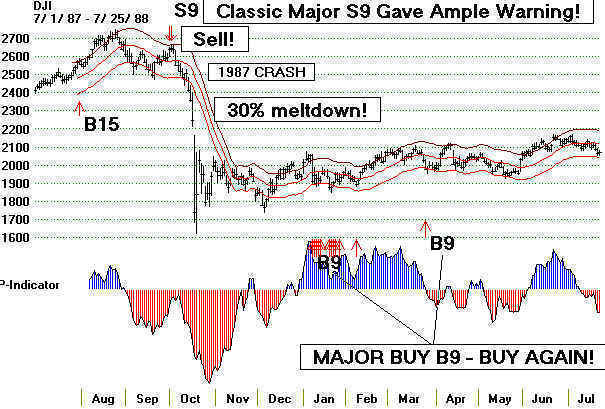
1987 Peak was at
2702 on 8/26... Fell to 1739 on October 19. ...35.6% decline
10/1 at 2639 "Sell 12":
10/2 at 2640 Classic "Sell S9" 34.1%
decline
......................................................................................................................................................
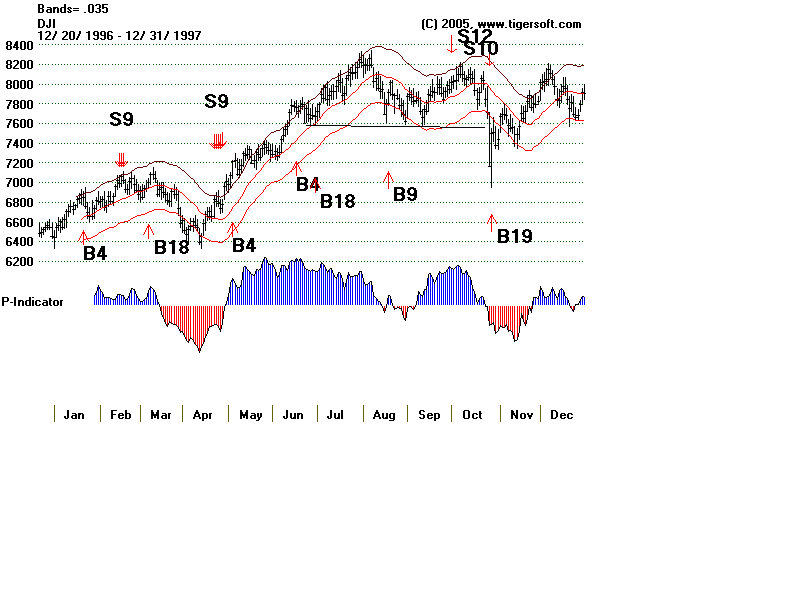
1997
Peak was at 8015.5 on 10/1... Fell to7498 on 10/28 6.5%
decline
"Sell 12":
......................................................................................................................................................
2007 ????
DJI
======================================================================================
Monday - June 18, 2007
I seriously doubt if more than 10% of Americans realize how
rapidly many overseas
stock markets are rising. There is a lot of talk, though, about a
Chinese "bubble".
But it is really a Brazilian, Chilean, Indonesian, Indian, Sri Lanan, Turkean...etc
and a Chinese "bubble". Admittedly, the Chinese Shanghai Composite is up
particularly
steeply in the last 2 years, from 1000 in mid 2005 to 4000 now, or +300%...
"The USA
is being left behind", some would say, "because the war in Iraq, which started
in 2003, is
putting the USA further and further behind in the quest for international capital."
Personally,
I am delighted that millions and millions of people worldwide are probably living much
better lives. As investors, we have to take advantage of these trends. We cannot
control them.
. See the Multi-Year Charts. of these countries' stock
markets,
Early 2003 Now
Gain
Mexico IPC
6000 30000
+ 400%
Indonesia Jakarta Composite 400
2000
+400%
Brazil Bovespa
10000 50000
... +400%
Turkey ISE National 100 10000
47500
... +375%
India BSE30
3000 14000
+ 367%
Chile IPSA Index
800 3200
.. +300%
Sri Lanka All Share
700 2600
... + 264%
Sweden Stockholm
30 450
1250
... +175%
Chinese Shanghai Composite 1500
4000
+167%
DJI-30
7500 13500
+80%
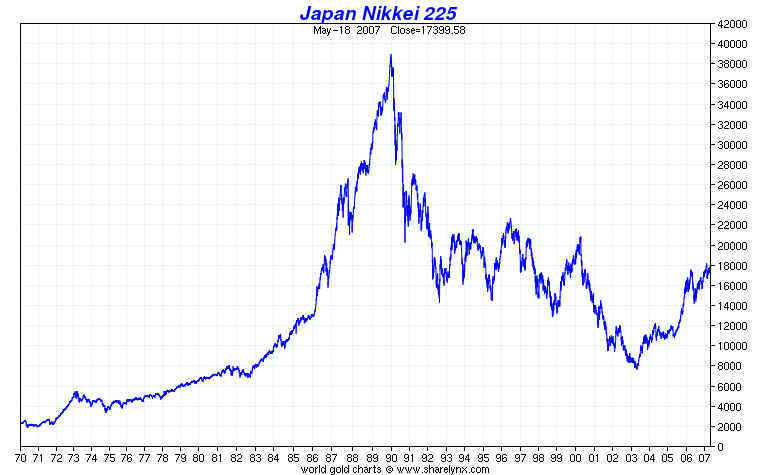
Of course, we will have to be watchful for a top. If the
Japanese "bubble" of the
1980's that ended in early 1990 is a proper example, we will see major Peerless
Sell S9 signals, just as we did in 1989 and 1990 at the top. From October 1989
to July 1990, Peerless gave three separate sets of major Sell S9 signals.
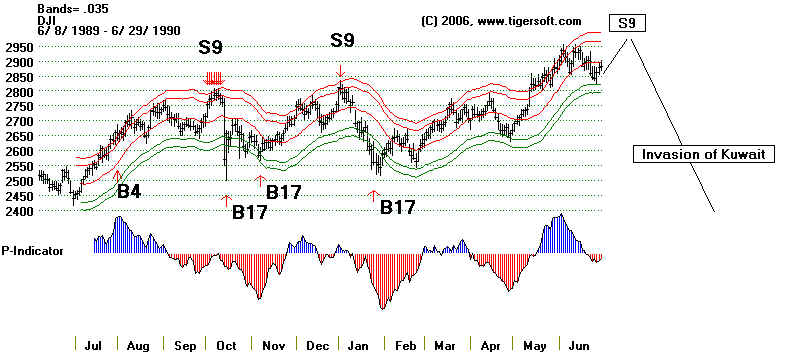
Japanese Bubble peaked in early 1990 - Raised interest rates and corruption
are given the blame.
But Peerless called it. Three major Sells in a 9 month period followed by a breaking
of support is
bearish.
======================================================================================
.
Sunday - June 17, 2007
The Chinese market is roaring again to new highs. Here is
the
chart of the China Fund.
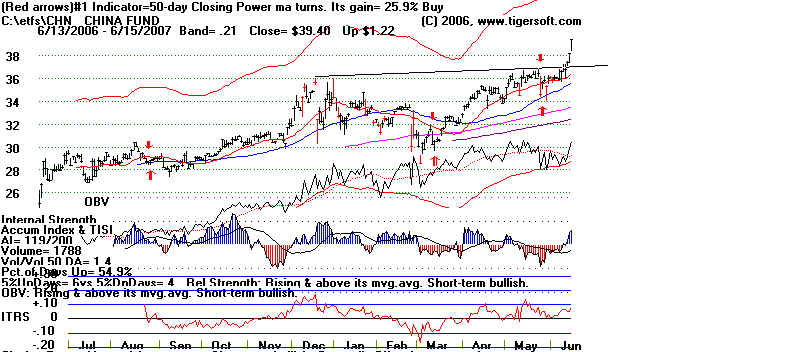
We have known for some time that the Chinese markets was where big
smart
professional money was going. Look at the chart of the closed end fund - PGJ.
Tiger users know that the single most important indicator to use is the Tiger
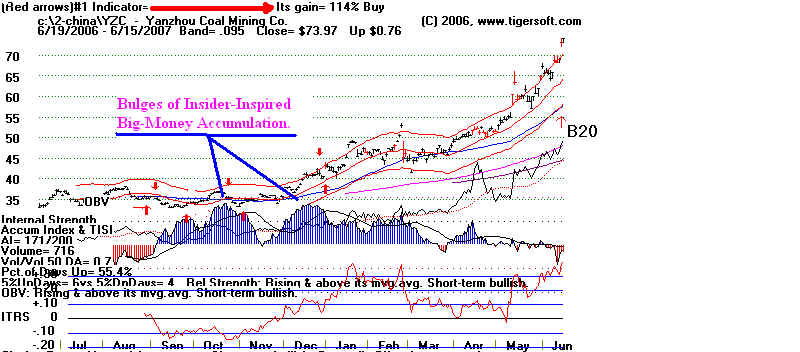
"Accumulation Index". The bulges of big-money buying were extraordinarily
bullish. This is exactly what we want to see. This pattern predicts the biggest
gains
year after year!
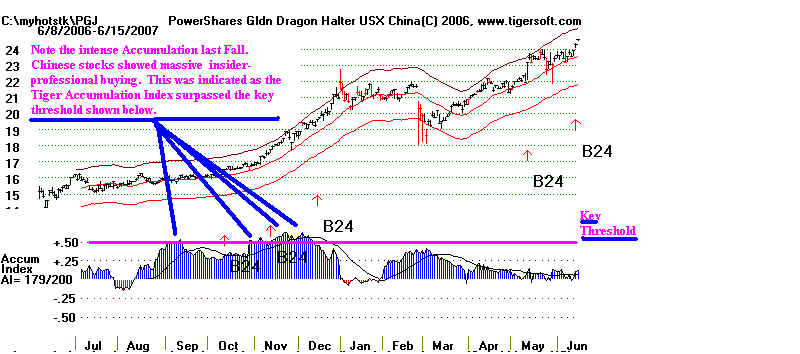
Tiger users have had an easy time spotting some of the best of the
Chinese stocks
by looking for tell-tale bulges of Accumulation form our favorite Tiger indicator.
There
are many other recent cases of these bulges in Chinese stocks. All were signs to
buy.
Sometimes it is best to buy these stocks on a retreat to the blue
rising 50-day ma.
as occurred in February. The Peerless major Buy in March 3rd also said that it was
time to buy.

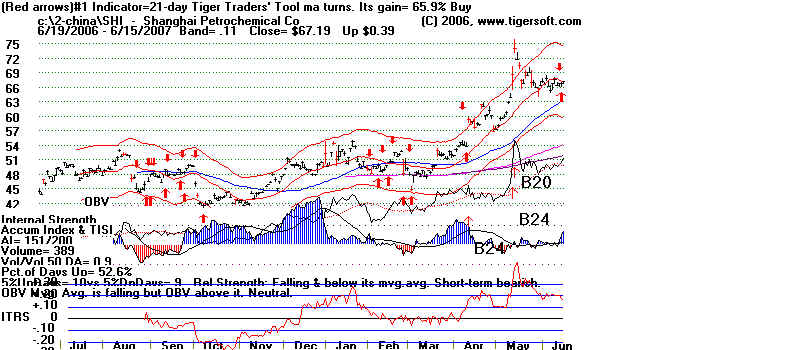
SHI - The optimized red arrows are less important that the fact that there was
massive insider
buying in December. That surge of Accumulation was unmistakably bullish, especially
when
oil prices turned up again.
YZC
 |
