(C) 2010 William Schmidt, Ph.D.
www.tigersoft.com
  January saw 15 significant pivots downward by the DJI of more
     than 8% in the period 1915-2010, that is about once every 6.5 years.
     Peerless Major Sells occurred in all the cases since 1929,
     where the data is available for a major Sell. 5 occurred during
     a Presidential Election Year.  6 took place in the year after
     the Pres. Election. Only twice was there a pivot down two years
     after the Election. There was also only 2 cases three years after
     the Election. Pivots up in January were just as common in the
     second and third year after the Election.
Year Yrs Peak Signs of Reversal 6 mo Decline
after PE
==== ======== ======== ===================== ===============
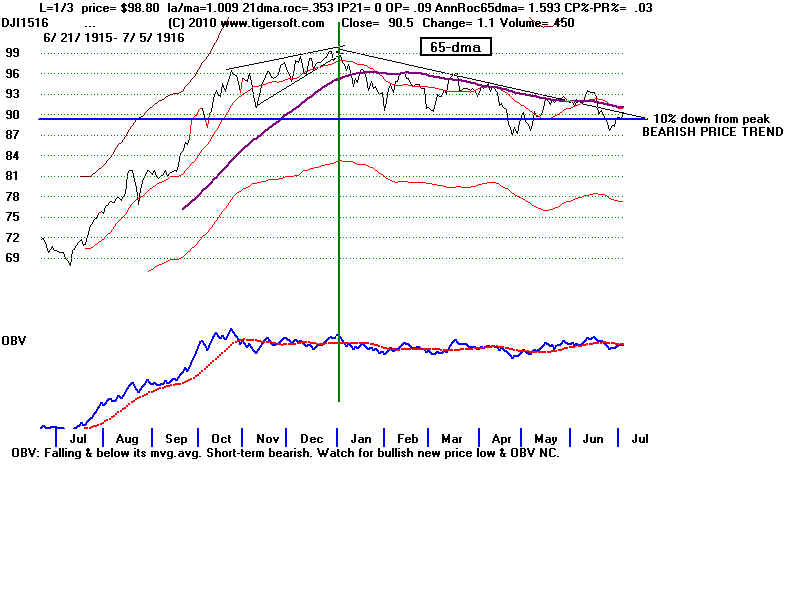
1916 0 1/3/1916 OBV NC, Rising Wedge
1935 3 1/7/1935 Sell S12, UB, resistance 3-mo 8%
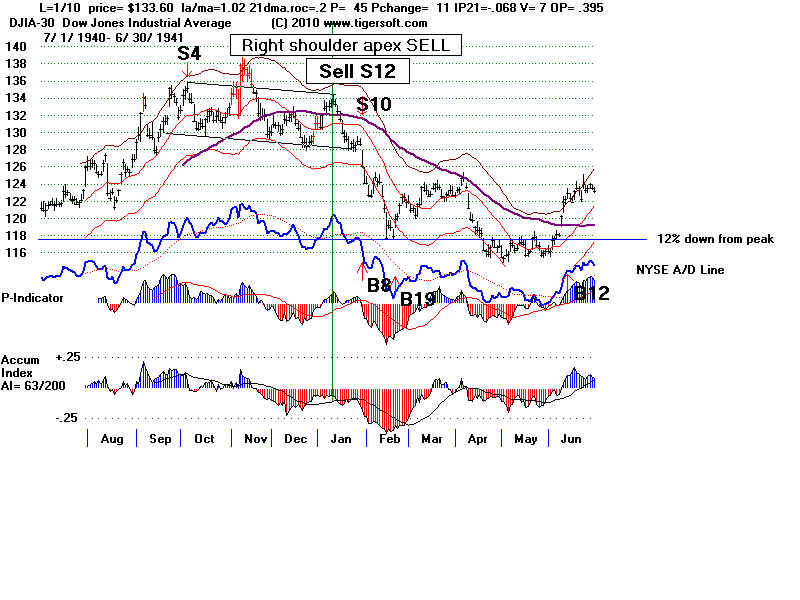
1941 1 1/10/1941 apex of HS right shoulder 4-mo 14%
red distribution - S12
la/ma=1.02 P=45 IP21= -.068 V=7 OPct= .472
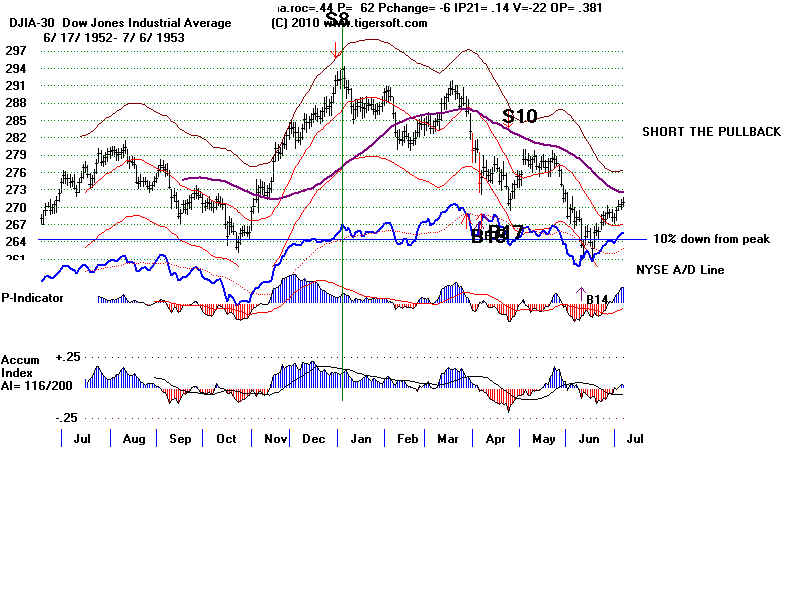
1953 1 1/6/1953 S8 5.5mo 11%
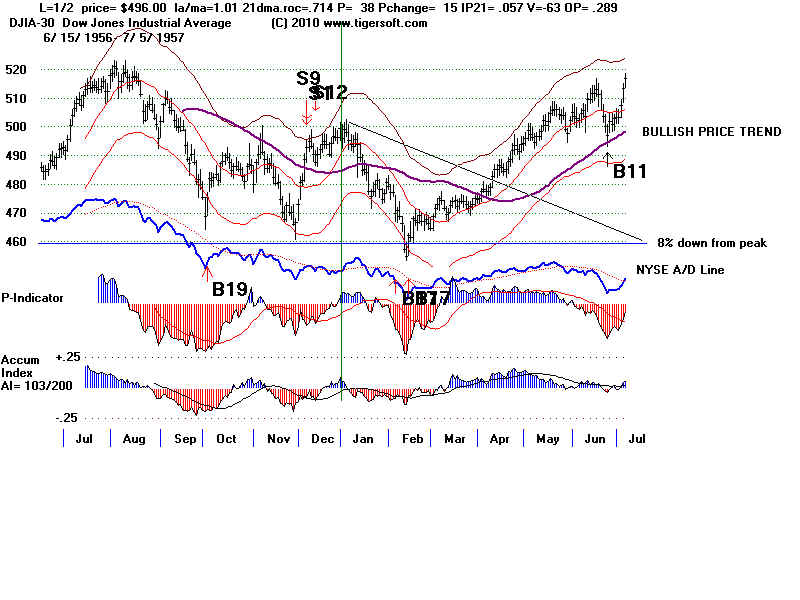
1957 1 1/2/1957 earlier S9/S12 1.5mo 9%
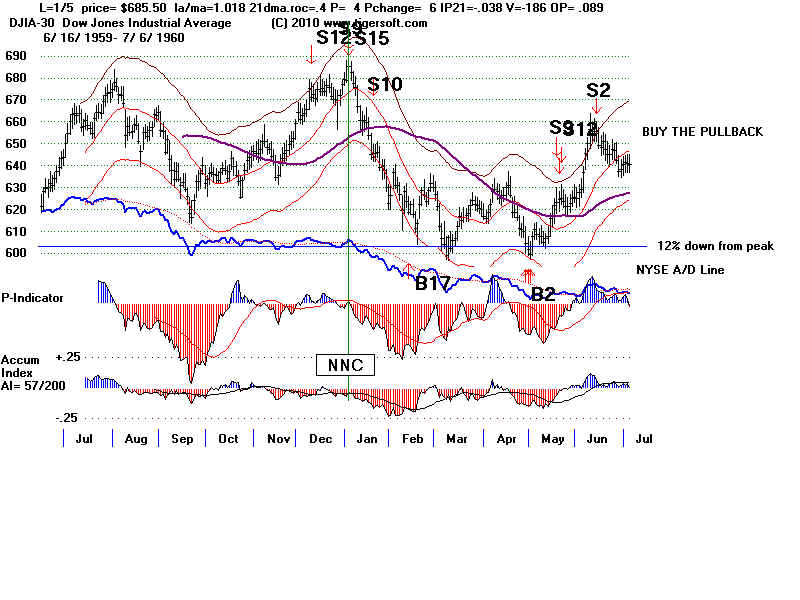
1960 0 1/5/1960 S12, S9, S15 2 mo 13%
1966 2 1/17/1966 S4, S12 bear market starts.
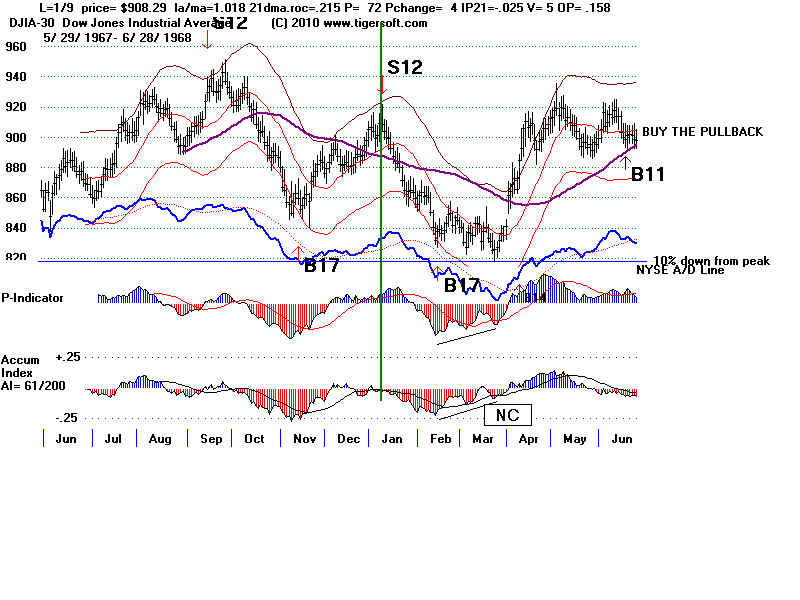
1968 0 1/9/1976 S12 2.5 mo 9%
(1968 0 12/2/1968 S1 bear market)
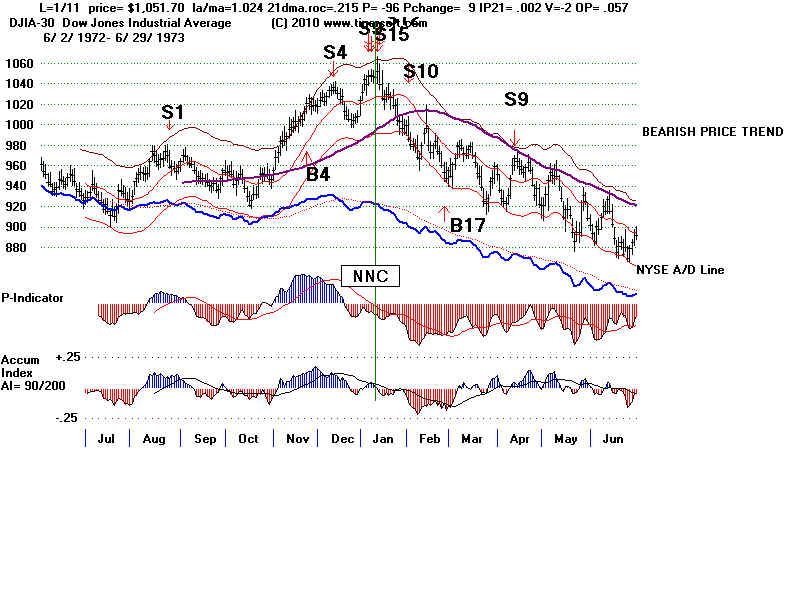
1973 1 1/11/1973 S9,S12 bear market
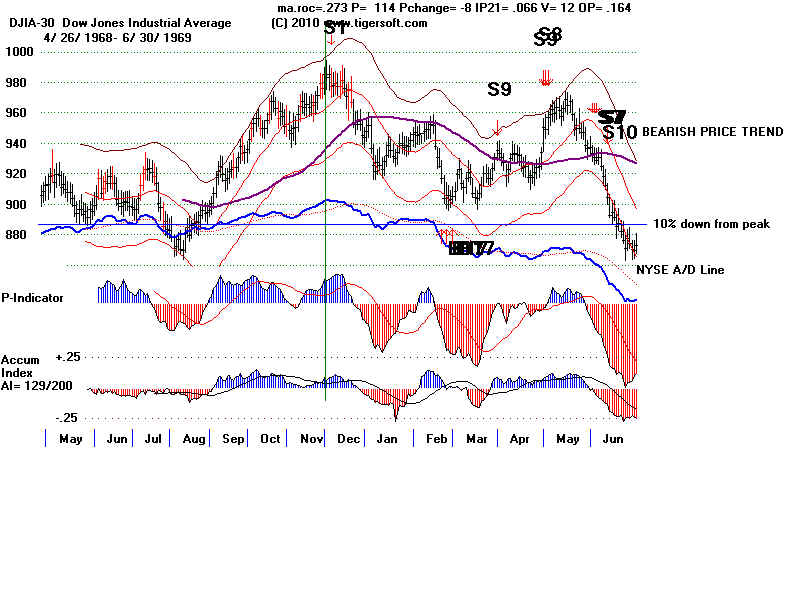
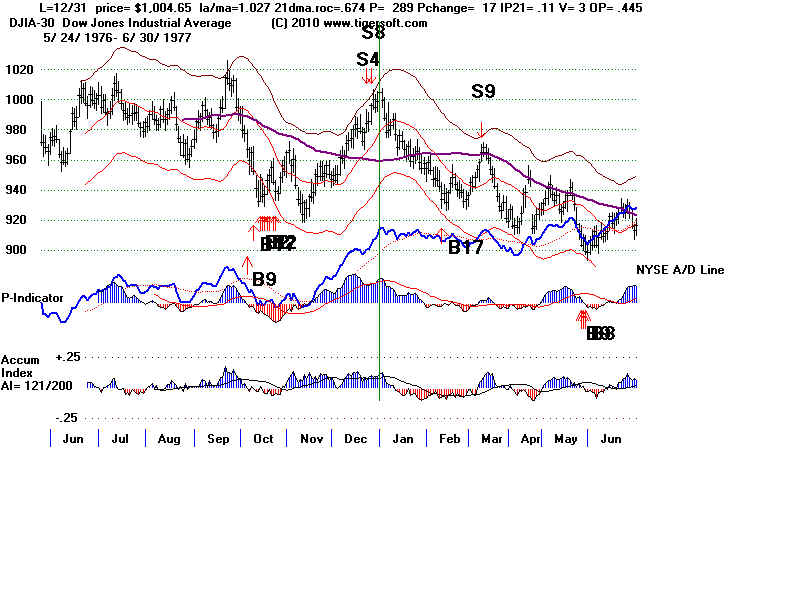
1977 1 1/3/1977 S4,S8 bear market
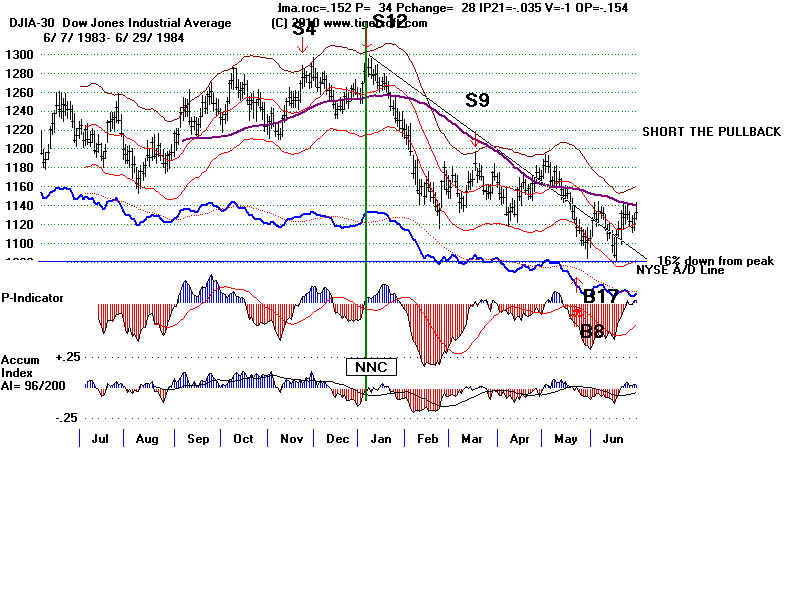
1984 0 1/6/1984 S12, rising wedge 4,5 mo decline - 16%
la/ma=1.022 P=34 IP21= -.035 V=-1 OPct= -.085
1990 2 1/3/1990 S4, S15 3 weeks - 10%
la/ma=1.027 P=36 IP21= .08
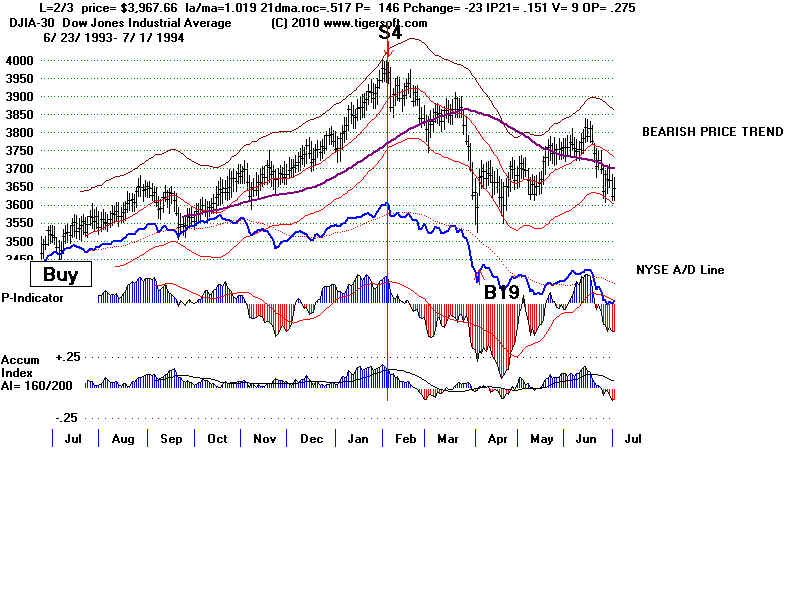
1994 2 2/3/1994 S4 10 weeks - 10%
2000 0 1/14/2000 S9, S4, S15 2 months - 17%
2003 3 1/15/2003 S12 2 months - 15%
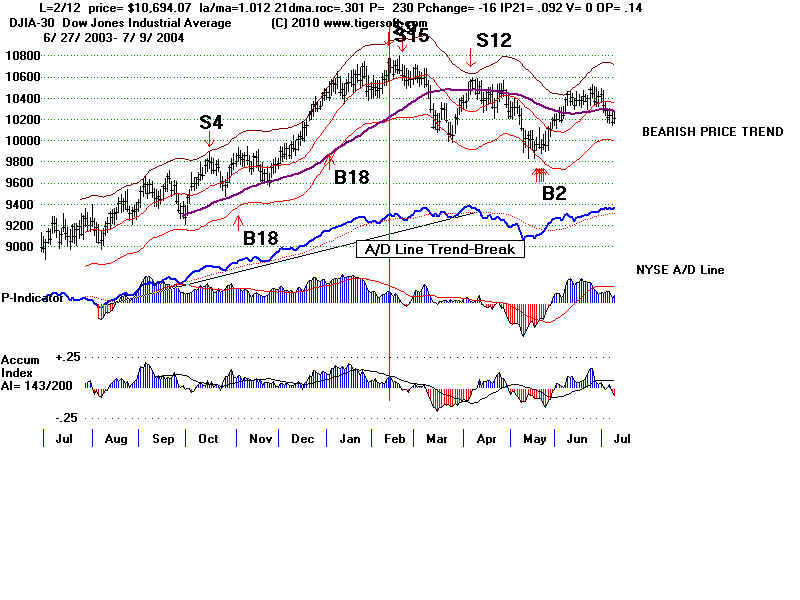
2004 0 2/12/2004 S9V, S15, S12 3 months - 8%
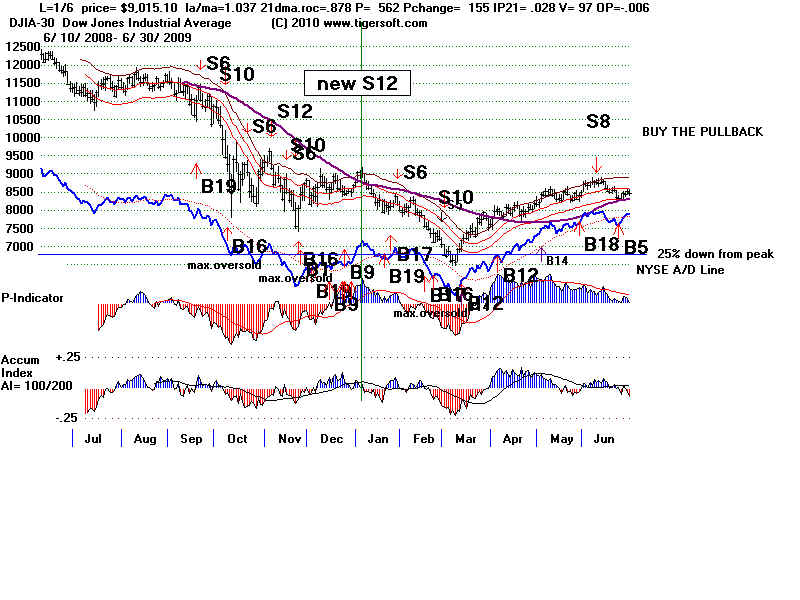
2009 1 1/6/2009 new S12 10 week - 27%
la/ma=1.037 P=562 IP21= .028 OPct- -.006
PIVOTS UP
12/19/1918 2 yrs after Pres. Election
12/9/1975  2 yrs after Pres. Election
12/8/1976  Pres. Election
12/31/1987 3 yrs after Pres. Election
1/12/1998  2 yrs after Pres. Election