|
Peerless/Tiger Users' Questions |
 |
Here are two
questions and answers, the first about Peerless and
the second about Tiger.
from SW: Regarding past Peerless Signals
> Perhaps the following "missing trades" have been addressed somewhere on
> your website but I cannot seem to locate. In reviewing the listing of
> all Major Peerless Signal Trades 1965-2007 I noticed a few
> discrepencies. Perhaps at the time there were not enough days in the
> data file to generate the signal. If so, a notation to that effect
> might help future users. Tiger: Be sure you are using the Tiger version dated
7/27/2006. And when you want to see the signals for the beginning
of the year. For example, use DATA8788 to see the signals for January
to April 1998. The charting program needs more than 100 days of data
to produce the signals.
Tiger: A manual is needed I know, And I'm working on it.
Thanks for the detailed questions. I will post this later on the Tiger
Page's Q&A page. A book is needed, but I want to show the
earlier time period, 1915-1966, so it is a struggle to find the time and
do it right.
>
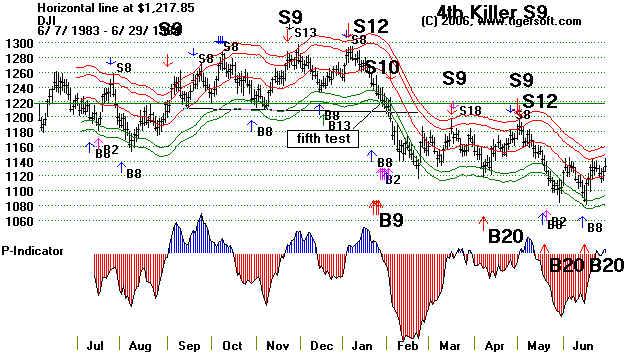
> 1. What about the B9 on 1/24/84 @1242.88 that shows on the chart for
> that period and the Trading Results but not on the list of all trades?
> The subsequent S10 on 2/3/84 @1197.03 also shows on the chart but not on
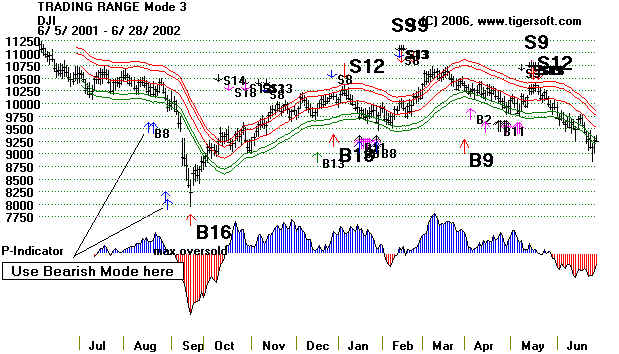
> all trade list. TIGER: 1) By early 1984, there had been 3 S9/S12s, so,
if one were using the bearish mode, there would have been no B9.
Was that the appropriate mode? At the time, I thought so. But it will be
discussed in the next manual.
>
> 2. The S12 trade listed on 6/1/84-shouldn't that be 5/1/84 as Trading
> Results lists? TIGER: 2) Right. The S12 was on 5/84. The date
should be corrected on the full list of signals on the Internet.
See above chart.
>
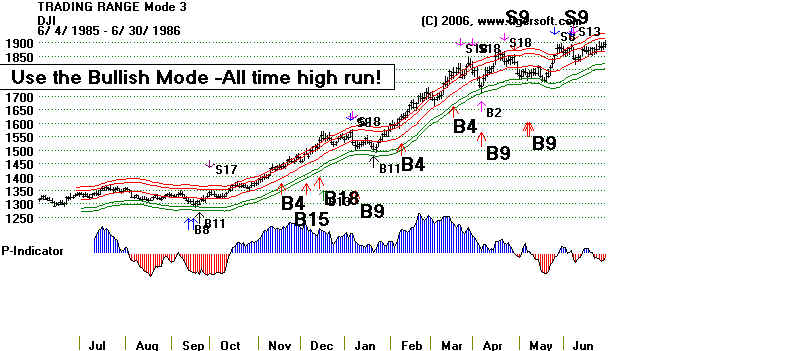
> 3. Also not showing on list of all trades but showing on chart and
> Trading Results are an S9 on 2/5/86 @1593.12 and a subsequent B4 on
> 2/10/86 @1626.38. S12 was on 5/84 TIGER: 3) No. If you use
DATA8586, I see no way there can be an S9 in February 1986.
Look how positive the P-Indicator was at that time. Also, use the
Bullish mode here. But even using a trading range mode does not give
a major Sell in February 1986.
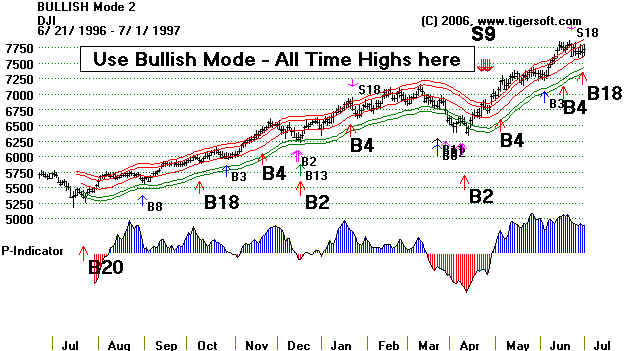
> 4. Same goes for an S9 on 1/29/96 @5304.98 followed by a B18 on 2/1/96
> @5405.06. TIGER: 4) Yes, there is an S9 in 1996, but it is easily
avoided. It is from the P-Indicator turning negative after about 90 straight
days of it being positive. We want to use that rule only when it turns negative
after more than 100 straight days being negative. (I cannot easily make
the change in the program, as the code for this version has to be re-constructed.
That is reason there is no update correcting this.)
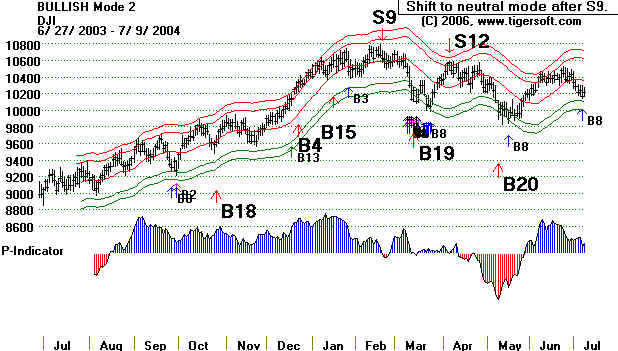
5. 5. Same for S9 on 1/10/97 @6703.79 followed by B4 on 1/22/97 @6850.03
> followed by S9 on 2/14/97 @6988.96. TIGER: 5) Using Data9697, I do
not get a January 1987 S9 in either bullish or trading range mode.. There is the
B4 you mention. It pays to use the bullish mode with the DJI moving so near
all-time highs.
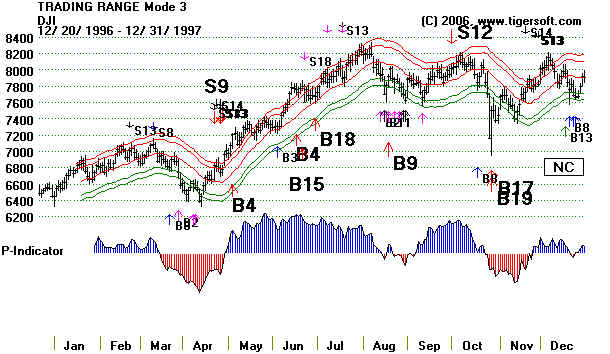
6.. The listing of all trades shows trade #103, a B19 on 10/28/97 that
> neither shows on the chart not the Trading Results list. I do however
> see a B4 on 2/10/98 @8295.61 followed by an S9 on 4/16/98 @9076.57-the
> B4 does not show on the list of all trades. TIGER: 6 When I use DATA9697,
I see a B17/B19. Don't you? In the chart below, I show the trading range
mode to demonstrate the B17/B19 at the bottom. You would not be using that
mode until the S12 in the Summer of 1997.
> 7. Trade #114, an S9 listed as 7/12/00 @10783.76 and the subsequent S9s
> on 7/13, 7/14 and 7/17 do not appear on the chart dates listed. TIGER: 7.
You're right, there is no July 2000 S9. That was corrected, I thought on the
Internet. Try doing a refresh.. I thought I corrected it. The Saved Signals were
corrected.
>
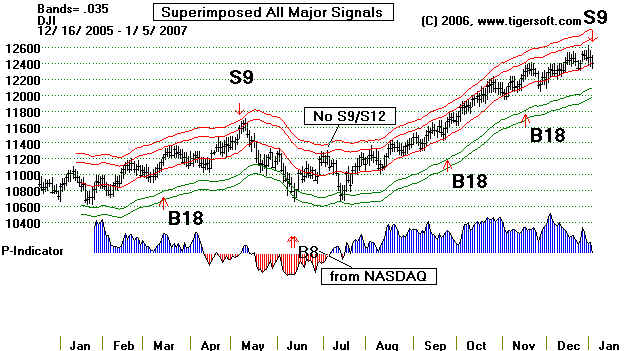
> 8.Trade #118 shows an S12 on 1/702 @10197.04 that does not appear on the
> chart. There is however, an S9 that shows 2/14/02 @10001.99. TIGER:
8. When I chart DATA0102 and use neutral mode I did get the S12 in early
January 2002. (Note that the chart below is in neutral, trading range mode
to show you what the correct signals would have been in early 2002 as market
rebounded. Using the bearish mode August and September would have prevented
any Buy signals until the B16. )
> 9. On 2/20/04 you indicate an S9 @10619.04 that does show on the Trading
> Results but not on the chart. TIGER: 9 When I chart DATA0304 I do get an S9 and
shows on the screen when I list the signals.
>
> 10. The B19/B8 that shows 05/06 on the chart does not show on the
> Trading Results for that period. Yet when run DATA06 Trading Results
> shows a B!9 on 9/26/06 @11669.39. TIGER: 10. When I chart DATA06,
there is no B8 or B19, but you should take the NASDAQ B8 and treat it as
a major Buy signal. That should suppress the S9/S12 in June. The B8 tests
very well. And you can superimpose all major signals and get this signal on
the DJI chart.
> Thank you again and a good job on developing a great program!! SW
7/18/2007 TIGERSOFT Q&A
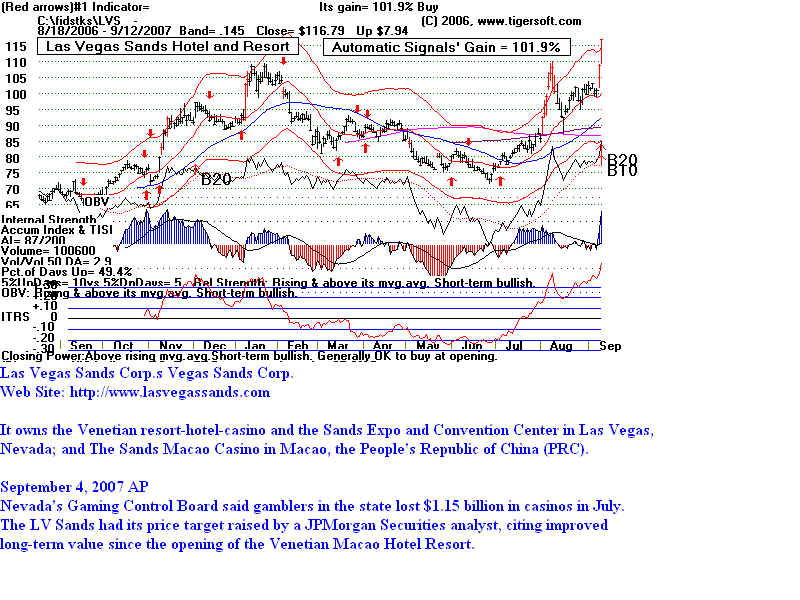
On 9/12/2007 I picked this as the best stock at this moment. It was LVS at 116.79.
Note the new high. How the ITRS made a new high, too. OBV confirmed and IP21
was over .25 and rising steeeply plus there was high (red) volume. This was a stock from
the list of stocks Fidelity had big positions in. They usually add to the positions of their
winning stocks. At this moment on 7/18, the stock stands at 129.53. Another point:
the stock was int he chart below just making an all-time high breakout.
From TP: Tiger: Answers
In selecting stocks to purchase, I understand that candidates
that have these parameters are likely the best:
- OBV%-PR% > 0 Tiger: =>0 (0 or above 0)
- IPA%-PR% > 0 (or .40 % ?) Tiger: =>0 (0 or above 0)
- IP21/200 > 147 Tiger: =>138, but better 150-200.
- IP21 > .23 Tiger: =>.23, but much better >=.50
- ITRS > 0 Tiger: ITRS>.05
- 50ma-PR% > 1.0
Plus, chart analysis of Support & Resistance and Trendlines. Check rising OBV & prices; trend should be mildly or significantly Up; showing Accumulation.
1) I'm assuming that recent Major Buy signals (B4, B8, B10, B12,
B20 & B24) are extra positive, and best to ID early stock moves, but not "required". Is that correct ?
Tiger: No, We want to see recent major Buys.
I guess I'm trying to figure out how important the "Major Buys" are. Maybe I'm second guessing my understanding since I'm new at this and, right now, there are a number of good stocks, but few have recent Buy signals to confirm purchase. Maybe a weak market. :)
Tiger: This means the market is over-extended.
2) For the first shot at screening buy candidates, should I just use Tiger Power Rankings or would it be better and more selective to use the "Bullish" group to find the strongest ones ?
Tiger: Besides the highlighted criteria above, I like to see
a rise that is polite, few or mo big dips. And "flat tops"
that have been broken above.
3) On p. 18 of "Explosive Super Stocks", you talk briefly about earnings. How important is this information is selecting buy
candidates ?
Tiger: If I could get O'Neill's Long-Term Values again, or
some other simple service like it, I would use it. I like to
see the news on Google and Yahoo. See who owns it. See what area
stockt is in. See where old all-time high resistance may be. See
if stock is in an area that might be exciting and warrent higher PE
when more investors find out about it. Technicals do dominate my
thinking. "Someone always knows."
4) I'm assuming that the IP21 indicators primary value is as a
shorter term indicator of a stock that has current accumulation.
Is that correct? Tiger: IP21 = current value of the Accumulation
Index. It is important to see very high levels, >.50, when
looking for significant insider buying. I seldom buy a stock
whose IP21 is less than +.23. Also, Bulges of Accumulation, over
+.50, often mean a buy suyer who knows something bullish about
the company that will take a year to unfold. So, don;t be in too
much hurry to take profits with these stocks, though turnings-
downward by the 50-day ma mean it is time to take profits, usually
on the next rally to that moving avg. Don't wait for such a rally
if the stock's news is very bad, unexpected (gap of high volume
down) and if Peerless gives a major Sell.
5) In the Peerless Market Timing module, what is the difference between "Superimpose NASDQ Saved Signals" and Tiger: IP21 = current value of the Accumulation
Index. It is important to see very high levels, >.50, when
lookin for significant insider buying. I seldom buy a stock
whose IP21 is less than +.23. ?
I'm thinking that the "Saved Signals" one are more of the major type, where "NASDQ Signals" are major & minor signals. Tiger: It takes about 100 days of data before the signas appear using "NASDAQ signals",
so superimposing helps on the NASDAQ charts. Also you can superimpose
these signals on other charts.
Note in the chart below the very high IP21. That is very important. But it is not usually seen
with high capitalization stocks, unless they have already been bid up for some time. When you look
at the charts of the best performing stocks, see how often there are bulges of IP21 (Accumulation)
above .50. In the stock below, you can see that the best time to buy it was when the IP21 was above
+.50. When it was below +.23, it was not so safe or profitable.
