When looking at B12 signals, I know you look for new highs, as well, what other factors are you typically
considering when deciding which of the B12 stocks to possibly purchase.
Answers that come to mind:
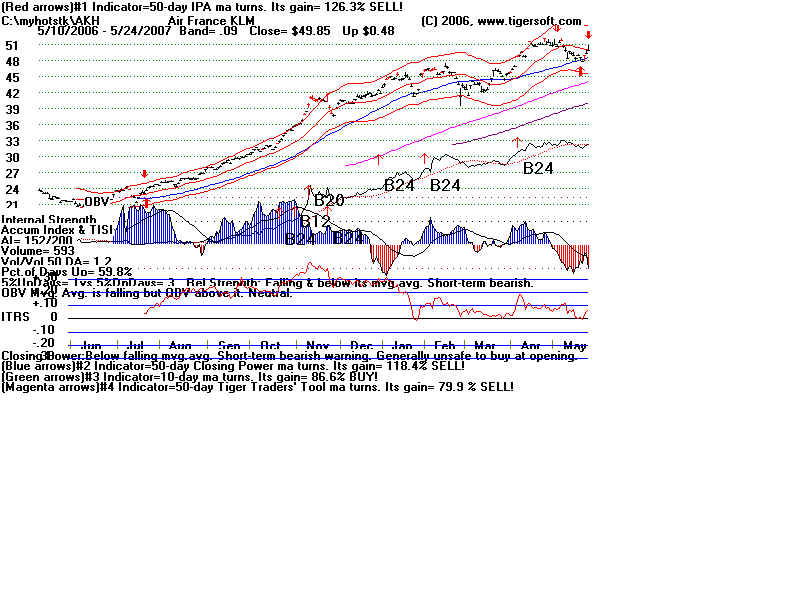
I now prefer B24s that meet the augmented conditions on www.tigsoft.com
Sticking to B12s:
Is this early in a bull market advance?
If so, chasing is more allowable.
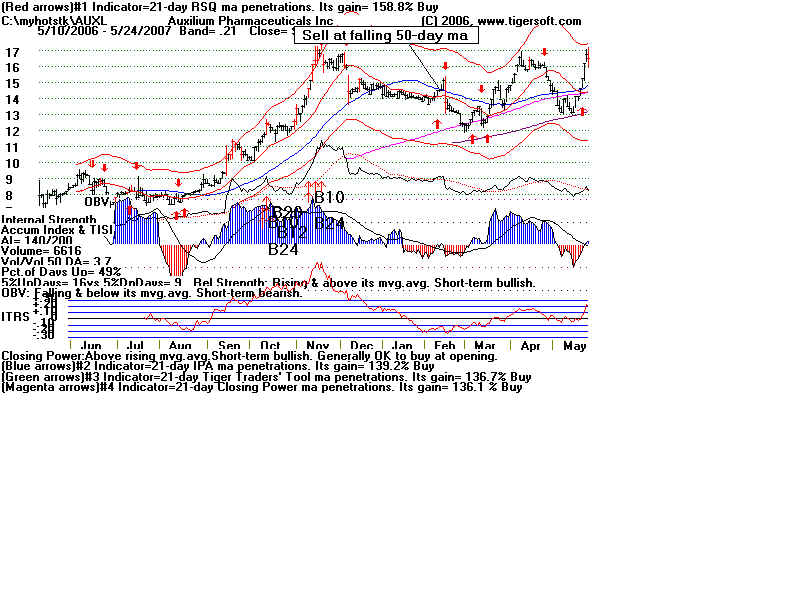
Is it an all-time high.
Then the path of least resistance is up.
Where is the overhead resistance from the past?
Stocks will usually fall back the first time they reach
a past point of resistance, like an old high or point of breakdown.
Is the current Accum. Index >.25 now? Essential.
Better if it is much higher. Up to a max of ,75
Is the OBV confirming and making a 12 mo high? Essential
How much accumulation did the stock previosuly show?
The higher the better. AI/200 >150 is desirable, but not essential.
Your results dimminish as you find less pervious horizontal accumulation.
If the AI/200 is less than 100, the stock can still do well, because
insiders may be jumping aboard as stock rises. Look for
other signs here: Especially Gaps & Very High Volume.
How much did volume rise on the breakout?
Best would be a 12 month high in volume.
A spike of more than volume than total volume for last 2 months is desirable.
Is there a price gap to show upwards momentum on the breakout?
Desirable.
Look to see if the good news appears to be exhausted.
If so, don't buy.
Is this a stock that can capture the imagination of investors?
Desirable.
How far up is the stock above the point of breakout?
Don't chase except in dfirst 2 months after market turns up.
More than 20% is risky.
ITRS has to be above .30 for a B12.
If ITRS is >.60, it becomes riskier in a late-bloomer.
Buy B12's once their pullbacks to their rising 50-day ma appear successful
B12's that occurr simultaneously with other major Buys are much more reliable.
Flat topped breakouts above weel-tested resistnace often lead to quick jumps in prices.
B5s find these stocks. These patterns are very good for optionable
stocks that have less trhan 2 weeks until expiration and that are
just out of the money when there is a breakout.
B12s late in a market advance, like now, are much more likely to not work out.
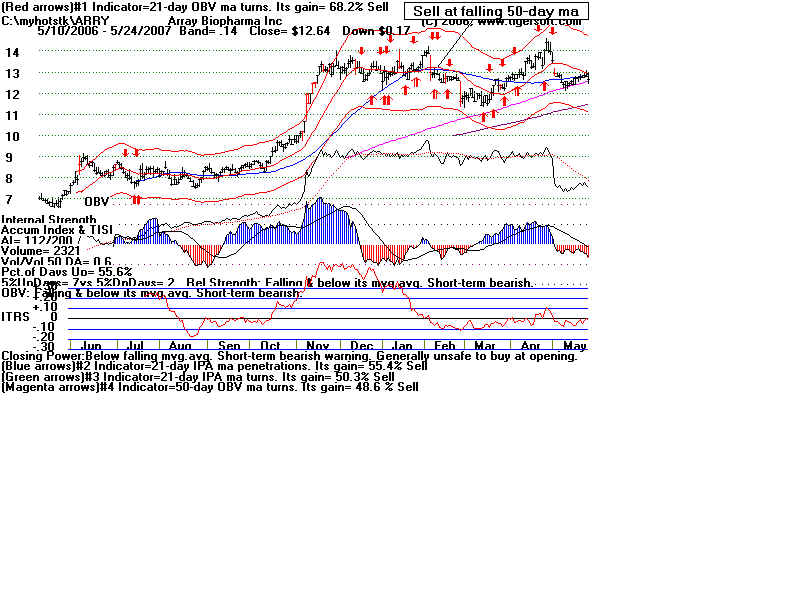
When should you sell these B12 stocks?
See last chapter of Explosive Super Stocks.
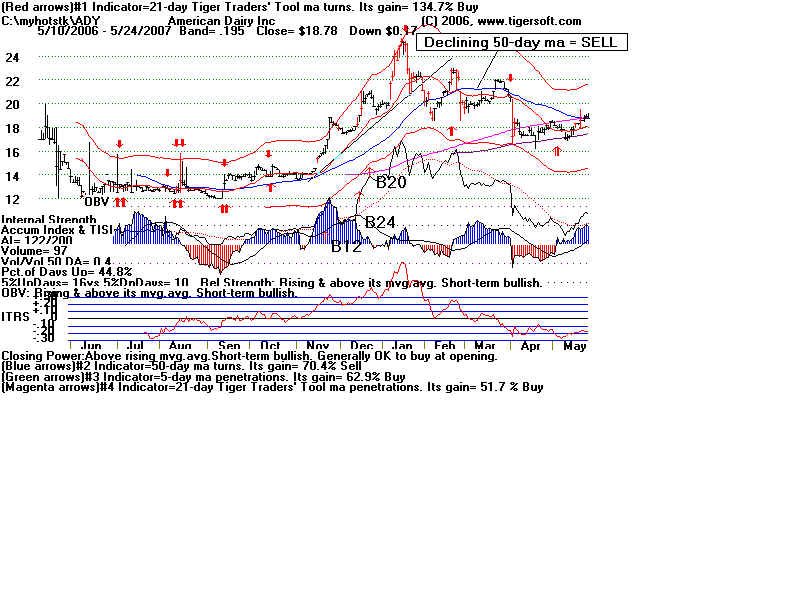
Rallies back to falling 50-day ma.
Head and shoulders Patterns's breakdowns.
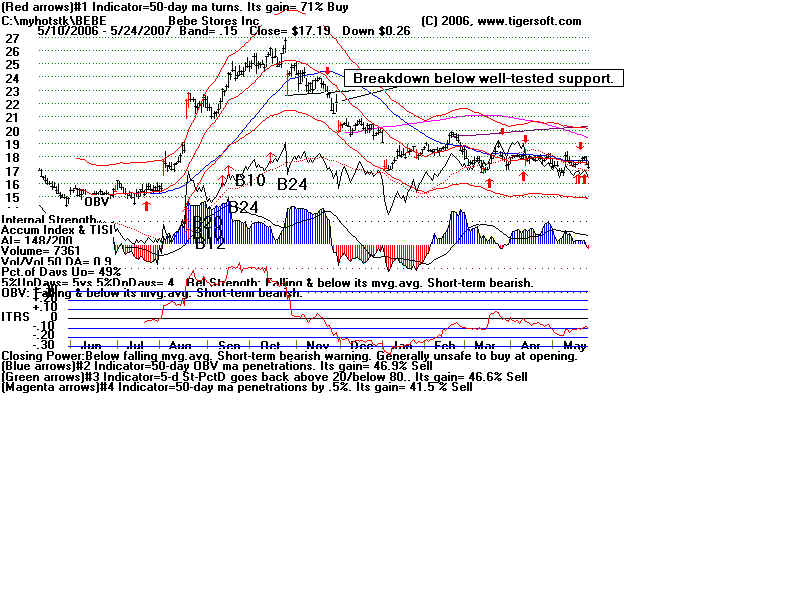
Well-tested Support Breakdown.
been warning signs that they would turn down.
 |
 |
 |
 |