AUTOMATIC TRADING USING BEST TIGERSOFT
OPTIMIZED SYSTEM FOR YOUR STOCK.
Many short-term and swing traders use Stochastics
for buys and sells. You will see below that our automatic
signals distinguish 5 different types or rules for each
length Stochastic. And we emphasize 5-, 14- and 20-day
stochastics. Users can employ any length stochastic
they want.
TigerSoft's optimized system is powerful, but
I would also factor in:
1) new Peerless Buys and Sells,
2) the trend of Closing Power,
3) the levels of Accumulation and Relative Strength trends.
4) Price patterns and trends.
Breakouts above well-tested resistance,
Breakdowns below well-tested support,
Head/Shoulder Patterns
Rising 65-dma is usually very good place to buy after bulge of Intense Accumulation.
Falling 65-dma is usually very good place to short when Red Distribution is heavy.
5) How well a particular indicator works with a stock over a
long time is important. ADBE trades well most of the time
with Stochastic indicators.
When a frequency distribution is done of the various best automatic systems, we consistently
find that 5-day Stochastics occur 2 to 4 times as chance would allow depending on the
general market conditions. And within this group, two systems occur more than twice
as often as any other 5-day Stochastic system. The most commonly occurring best
systems are:
1) the 5-day K-Line crossing the 5-day Pct-D and
2) the 5-day K-Line turning up from below 20 or turning down from above 80.
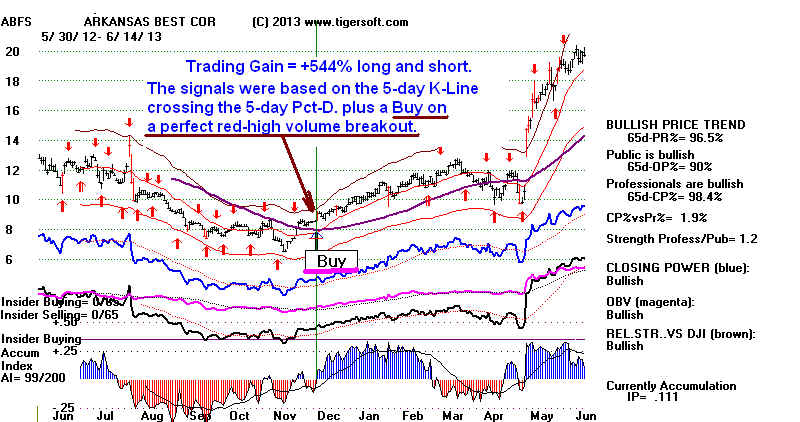
A very good trading approach is to find a stock that trades well with one of these
two systems and add to it some additional trading rules, such as "Buy on a breakout
when prices close above a well-tested flat resistance and show red high volume
to confirm the breakout. Following such a modified system would have gained
a whopping +544% from 6/19/2012 to 6/14/2013. See its chart below.
Above all, understand that Stochastic Systems are great when a stock stays within
a broad trading range. When they breakout, trade that trend. When a 5-day Stochastic
system is the best system, it can be extremely lucrative. We provide a Special Data
Download named STOCH5 to allow you to quickly find the stocks that are trading
best with 5-day Stochastic systems.
See below ADBE's best trading system for each year:
Blue indicates 14 and 20-day Stochastics worked best for the year.
This was true in 8-9 years. Trading range markets are most auspicuous for this Stochastic.
1990, 1994, 2000, 2005, 2006, 2007, 2011 and 2012. Also 2003.
Trending markets do not favor trading long and short with 5-20 say stochastics.
1993, 1995, 1996, 1997, 1998, 1999, 2004, 2008, 2009
It is suggested that traders trade with the price and Closing Power trends as
much as possible. When trend is up, Buy on shorter term Stochastic Buys.
When trend is down, Short on shorter term Stochastic Sells.
Signals for these can be placed on Tiger charts using Ind-2.
Taking profits after a long advance with longer-term systems' Sells is
a good idea, but I would favor requiring trend-breaks of Closing Power, too.
5-day Stochastics work best in nervous, volatile markets.
1992, 2000, 2002 and 2010. Here active traders often make the most money.
ADBE favors 14-20 day swing traders much more often.
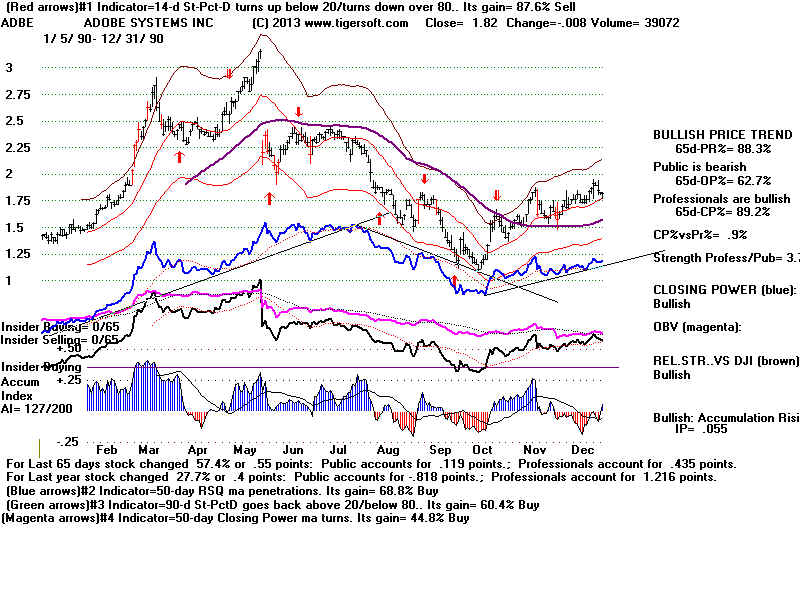
1990 14-d Stochastic-Pct-D turns up below 20/turns down over 80 +87.6%
1991 5-d ma penetrations +107.4%
20-d Stoch Pct-D crosses back above 20 for Buys and falls below 80 for Sells +44.8%
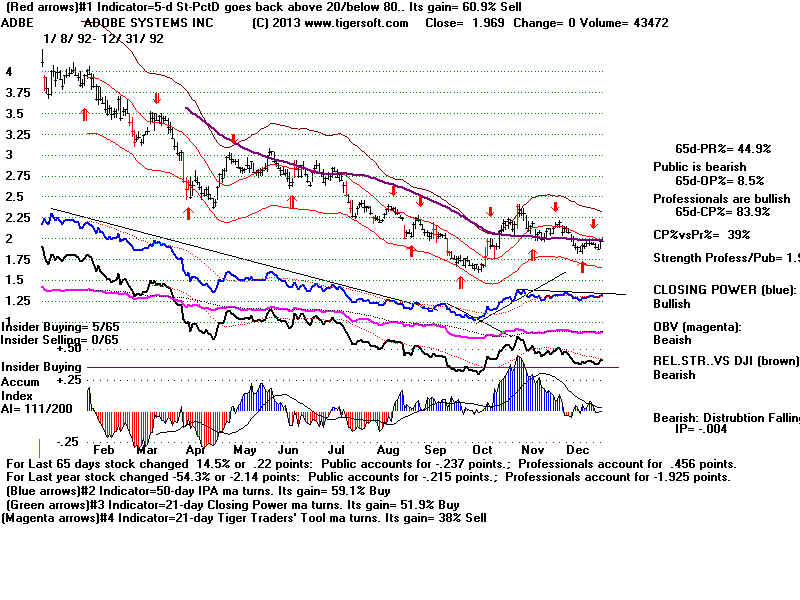
1992 5-d Stochastic Pct-D does back above 20/below 80. +60.9%
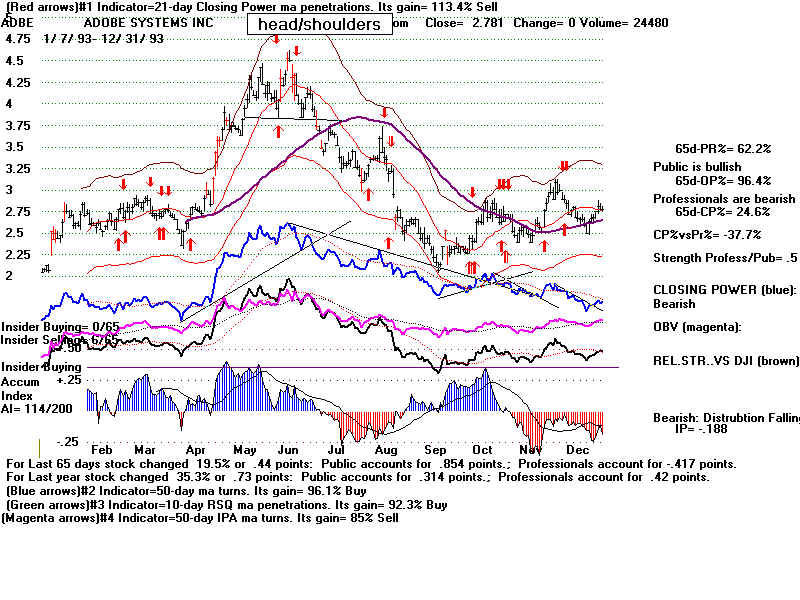
1993 21-d Closing Power ma penetrations. +113.4%
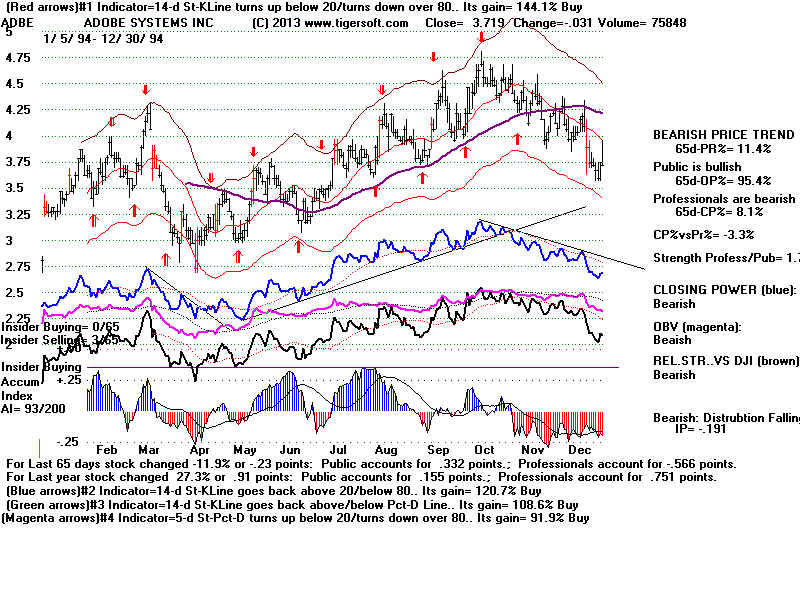
1994 14-d Stochastic-Pct-D turns up below 20/turns down over 80 +144.1%
14-d Stochastic-Pct-D crosses back above 20 for Buys and falls below 80 for Sells +120.71%
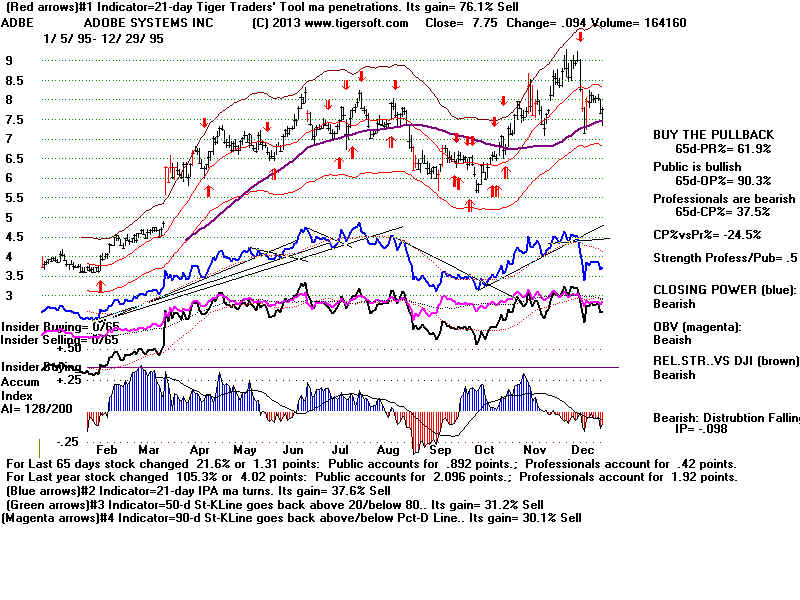
1995 21-day Tiger (Day)Traders' Took ma penetrations +76.1%
All Stochastic systems under 20 lost monet for year,
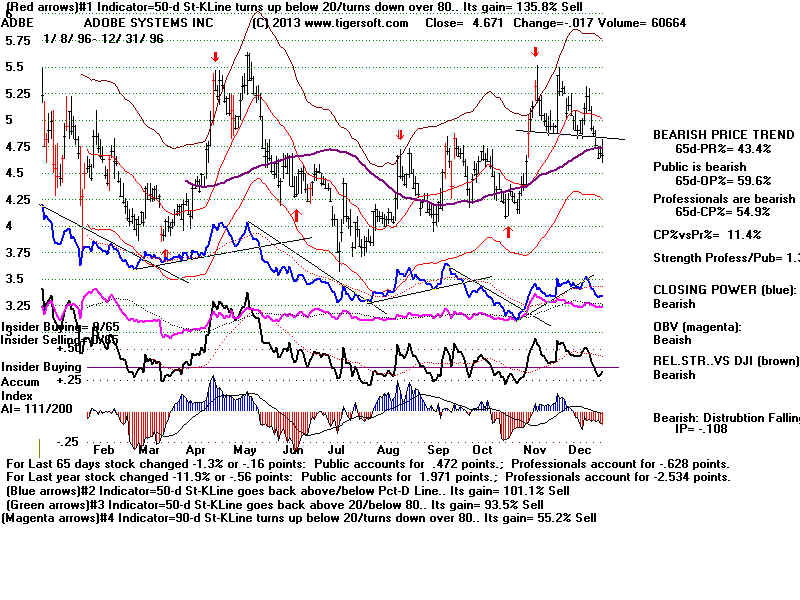
1996 50-d Stochastic K-Line turns up below 20/turns down over 80. +135.8%
5-d Stochastic Pct-D crosses back above 20/below 80. +53.0%
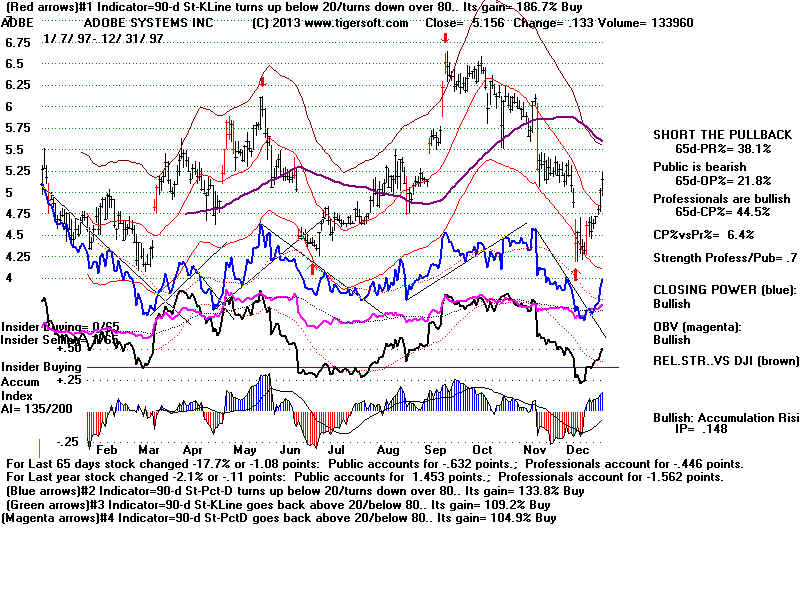
1997 90-d Stochastic K-Line turns up below 20/turns down for Buyss/ turns down over 80 for Sells +186.7%
20-d Stochastic K-Line crosses back above 20/crosses back below 80 for Sells +37.8%
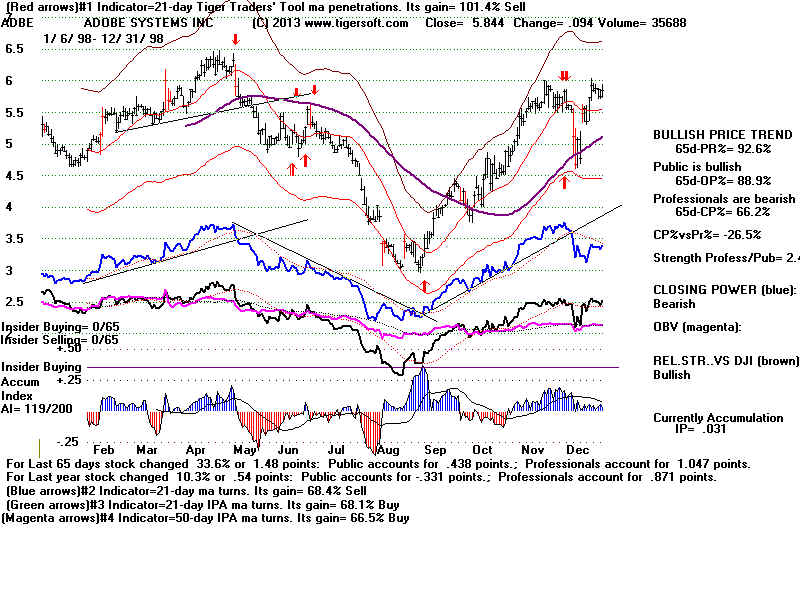
1998 21-day Tiger (Day)Traders' Took ma penetrations +101.4%
All Stochastic systems under 20 lost money for year,
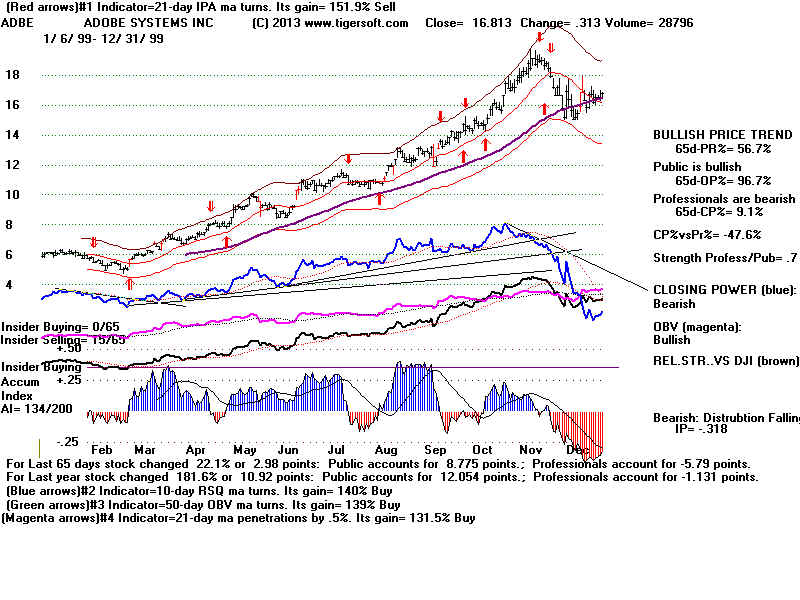
1999 21-day IPA ma turns. +151.9%
All Stochastic systems under 20 lost money for year,
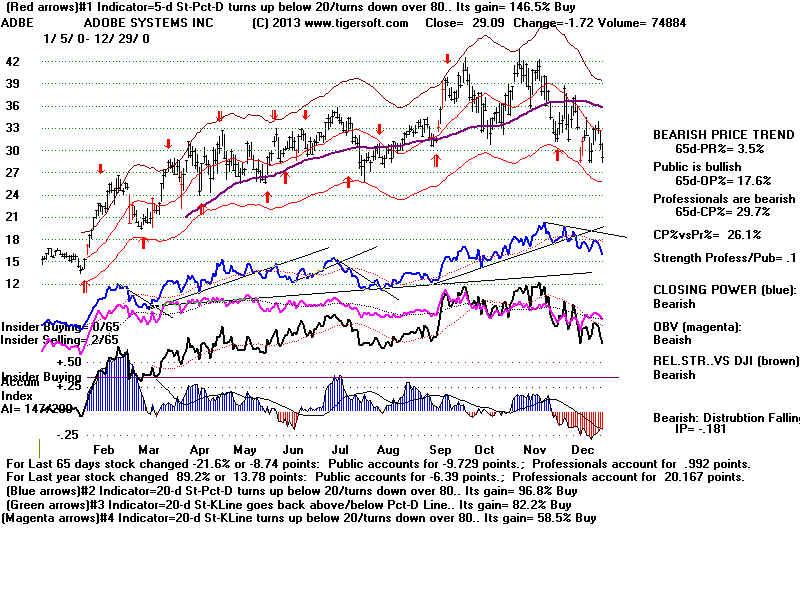
2000 5-d Stochastic-Pct-D turns up below 20/turns down over 80 +146.5%
20-d Stochastic-Pct-D turns up below 20/turns down over 80 +96.8%
14-d Stochastic K-Line crosses back above 20 for buys, falls back below 80 for Sells +40-.5%
2001 5-d ma penetrations +108.0%
5-d Stochastic Pct-D crosses back above 20/below 80. +65.9%
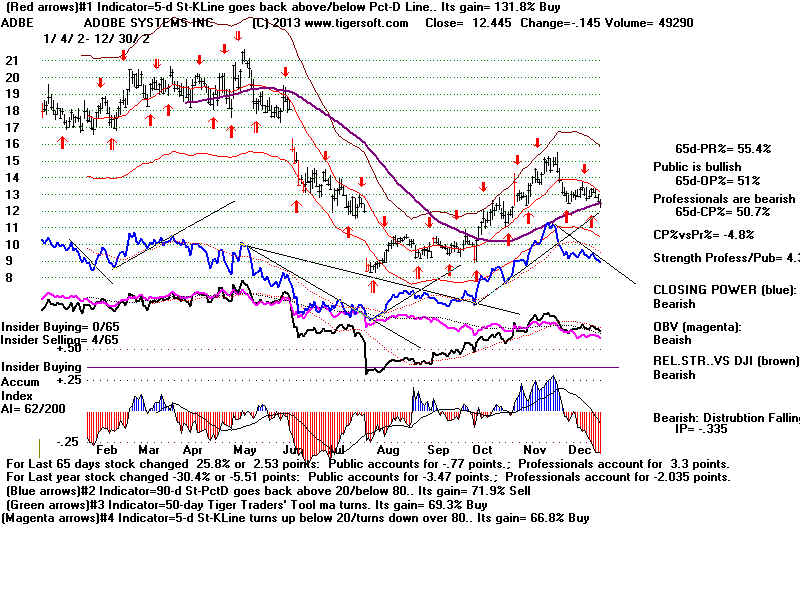
2002 5-d Stochastic K-Line goes back above/below Pct-D Line. +131.8%
5-d Stochastic-Pct-D turns up below 20/turns down over 80 +66.8%
14-d and 20-d Stochastic systems under 20 lost money.
2003 20-d Stochastic-K turns up below 20/turns down over 80 +82.0%
14-d Stochastic-Pct-D turns up below 20/turns down over 80 +57.0%
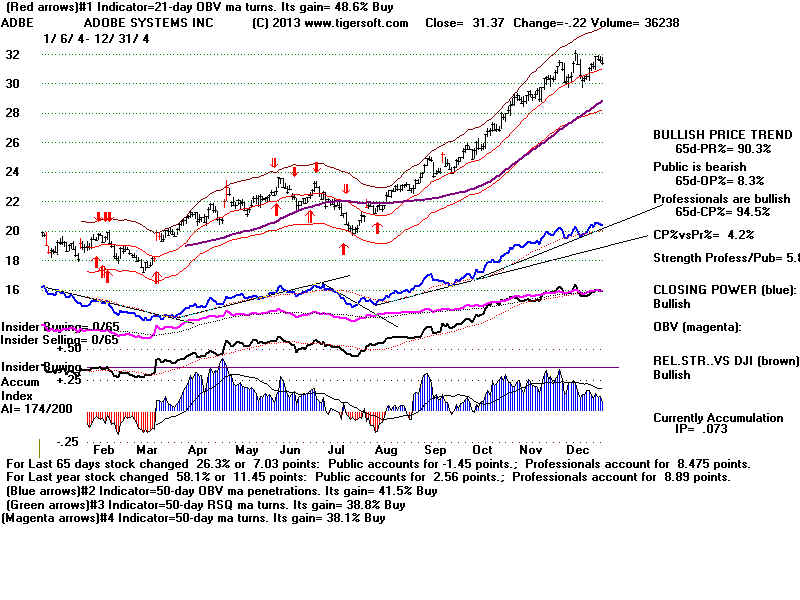
2004 21-d OBV ma turns +48.8%
All Stochastic systems under 20 lost money for year,
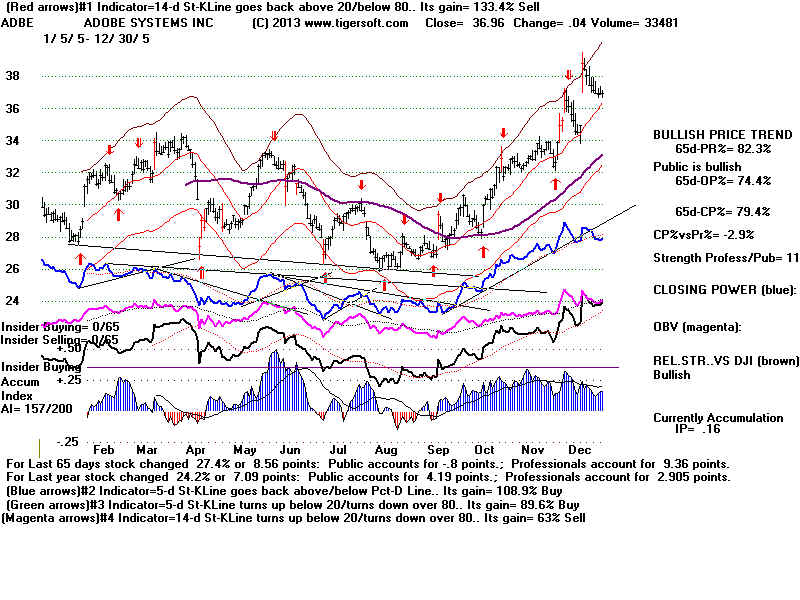
2005 14-d Stochastic K-Line crosses back above 20 for buys, falls back below 80 for Sells +133.4%
5-d Stochastic-K-Line crosses back above Pct-D and below Pct-D +108.9%
2006 14-d Stochastic K-Line crosses back above 20 for buys, falls back below 80 for Sells +94-.5%
14-d Pct-D crosses back above 20 for buys, falls back below 80 for Sells +72.2%
2007 14-d Pct-D crosses back above 20 for buys, falls back below 80 for Sells +64.1%
20-d Stochastic K-Line crosses Pct-D for buys and Sells +63.3%
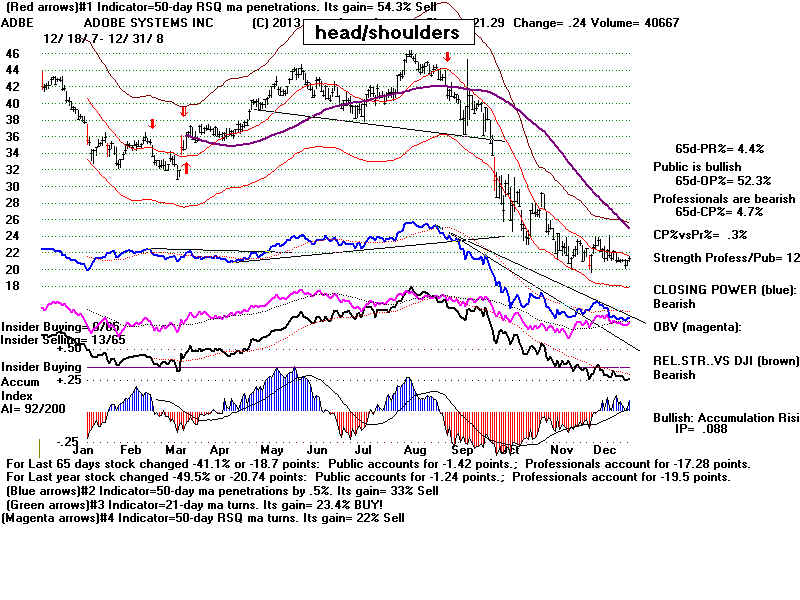
2008 50-d RSQ MA penetrations. +54.3%
All Stochastic systems under 20 lost money for year,
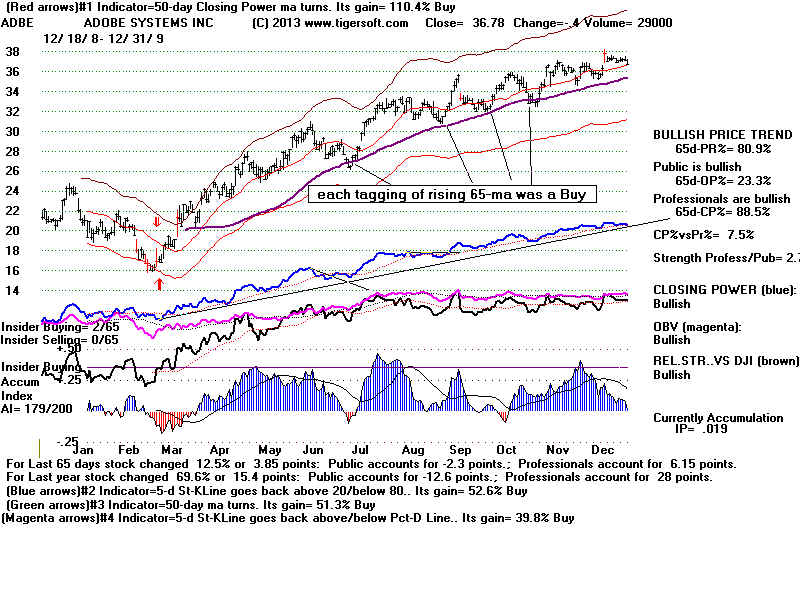
2009 50-d Closing Power MA turns. +110.4%
5-d Stochastic-Pct-D turns up below 20/turns down over 80 +52.6%
(Each tagging of rising 65-dma was a good Buy. This was not true in 1995 or 2003.
The difference was in 2009, there was very high Accumulation.)
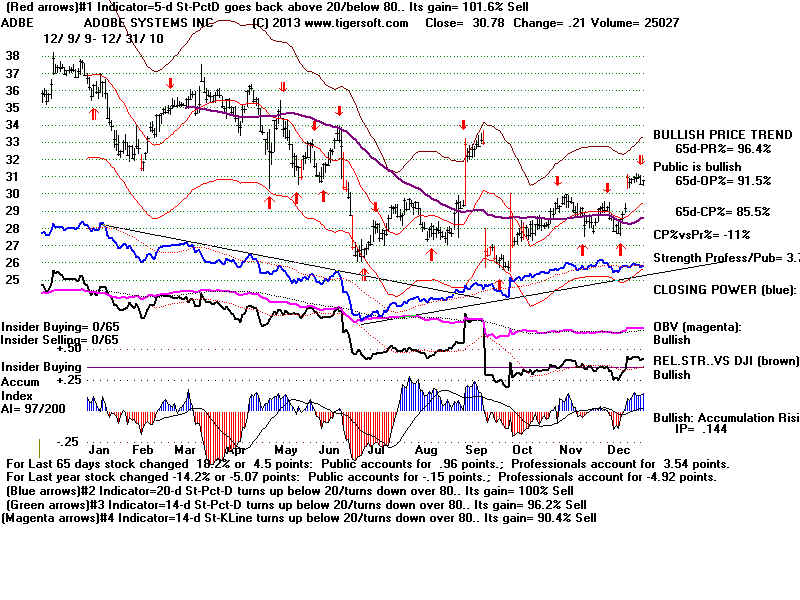
2010 5-d Stochastic Pct-D crosses back above 20/below 80. +101.6% (Compare with 2001).
14-d Stochastic-Pct-D turns up below 20/turns down over 80 +96.2%
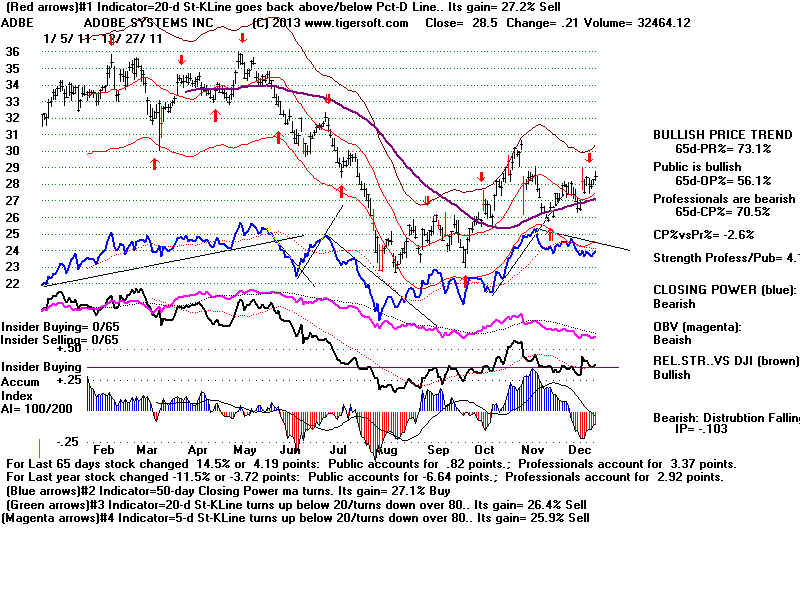
2011 20-d Stochastic K-Line crosses Pct-D for buys and Sells +27.2% (too low)
14-d Stochastic K-Line crosses Pct-D for buys and Sells +25.3% (too low)
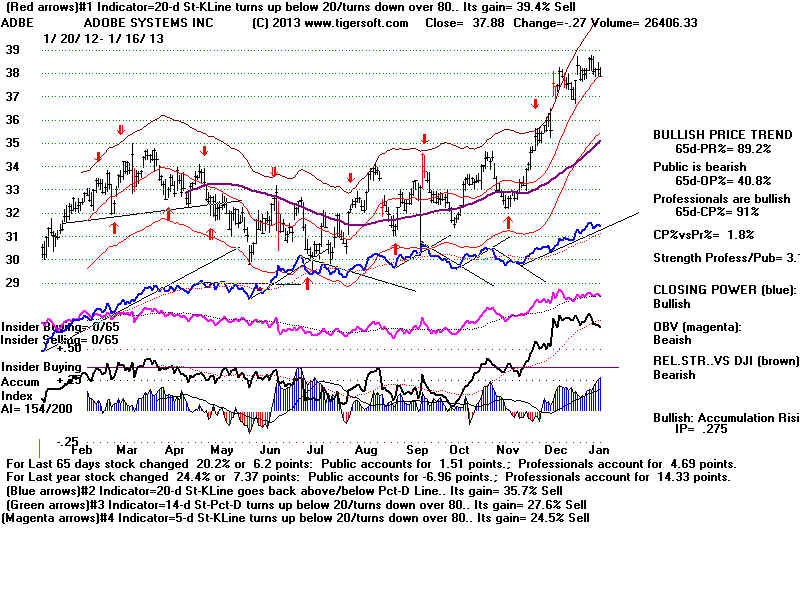
2012 20-d Stochastic-Pct-D turns up below 20/turns down over 80 +39.4% (too low)
14-d Stochastic-Pct-D turns up below 20/turns down over 80 +27.6%
2013 21-d price ma turns +34.5%
Very Important
I must repeat that it is vital to know when to stop
using optimized Stochastic Buys and Sells. We would
not use a Stochastic Buy if well tested price support fails.
Likewise, we would not use a Stochastic Sell when
well-tested resistance fails. Stochastics work best
when the stock is trading back and forth, not running
strongly up of down.
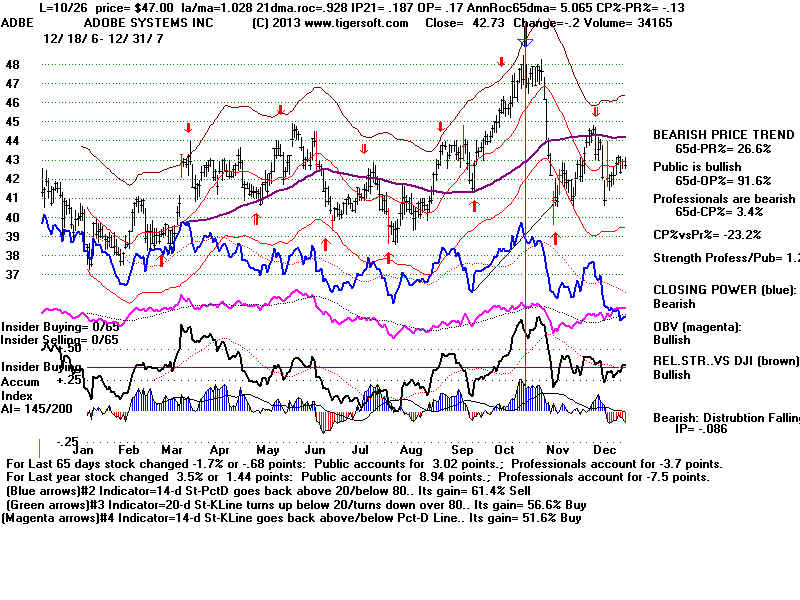
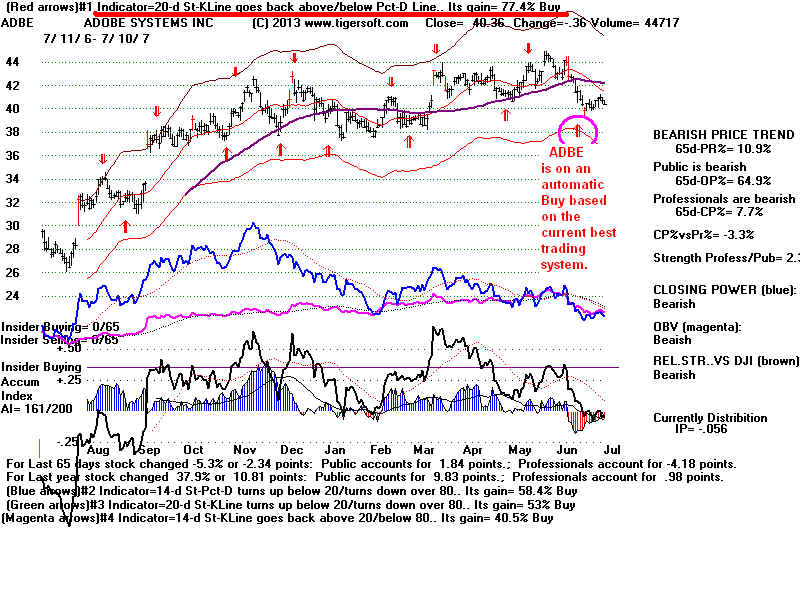
ADBE CASE STUDY: 2007
Buy at 40.36 because best automatic trading system is on a Buy. Chart#1
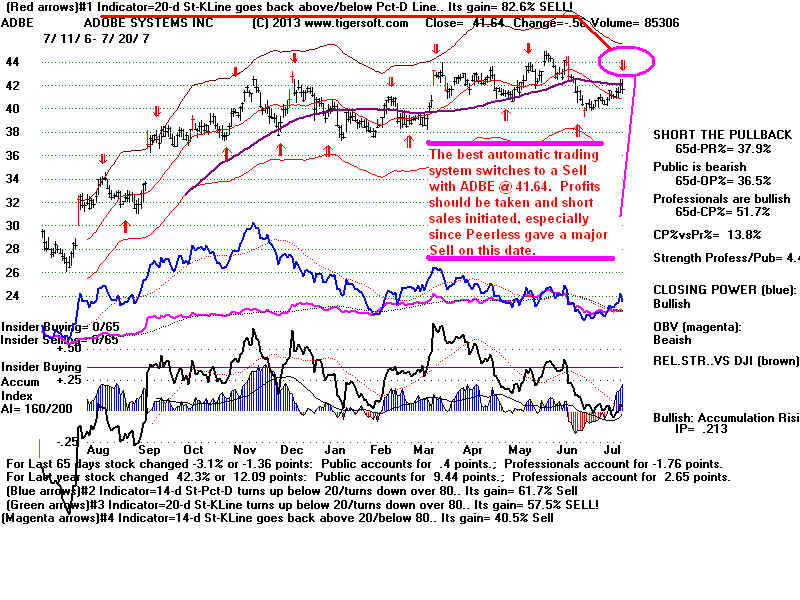
Sell at 41.64 because best trafing system has switched to a Sell. Chart#2
Sell short at 41.64 because of optimized Sell and Peerless major Sell.
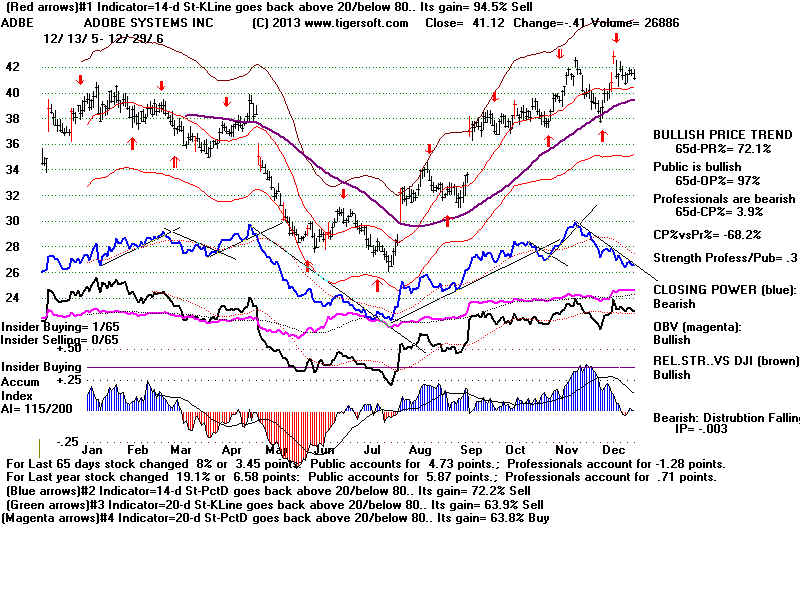
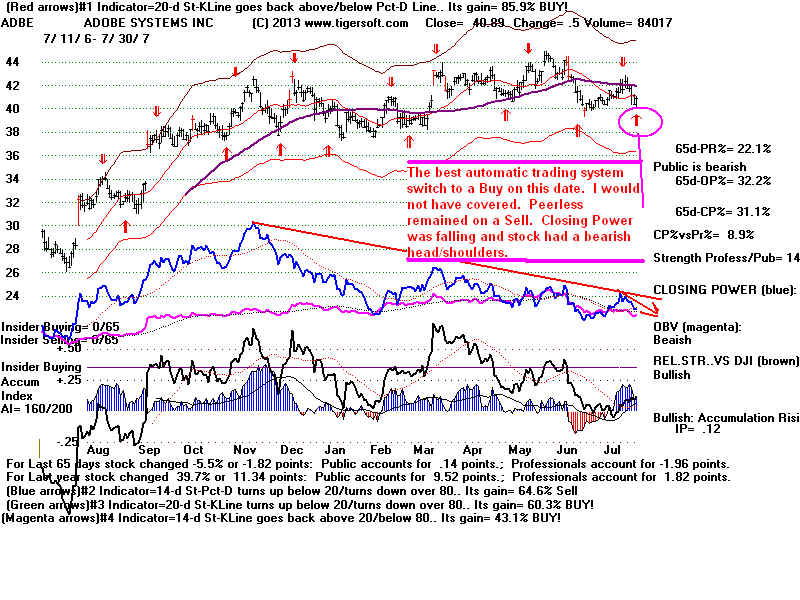
I would not cover on next automatic Buy on 7/10/2007 because of Peerless Sell,
falling Closing Power and head/shoulders pattern that was developing. Chart#3
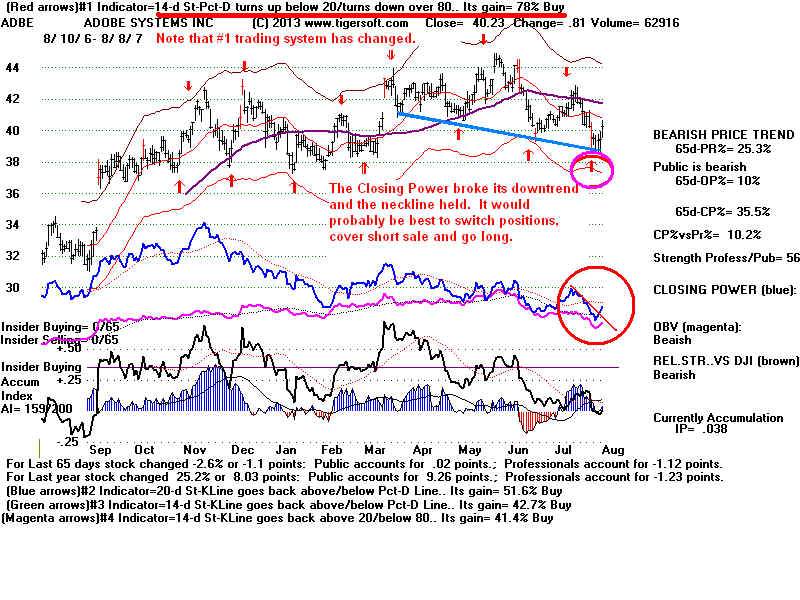
Cover short and go long at 40.23 on 8/8/2007 because Closing Power has
broken its downtrend and neckline in head/shoulders held up as support. Chart#4
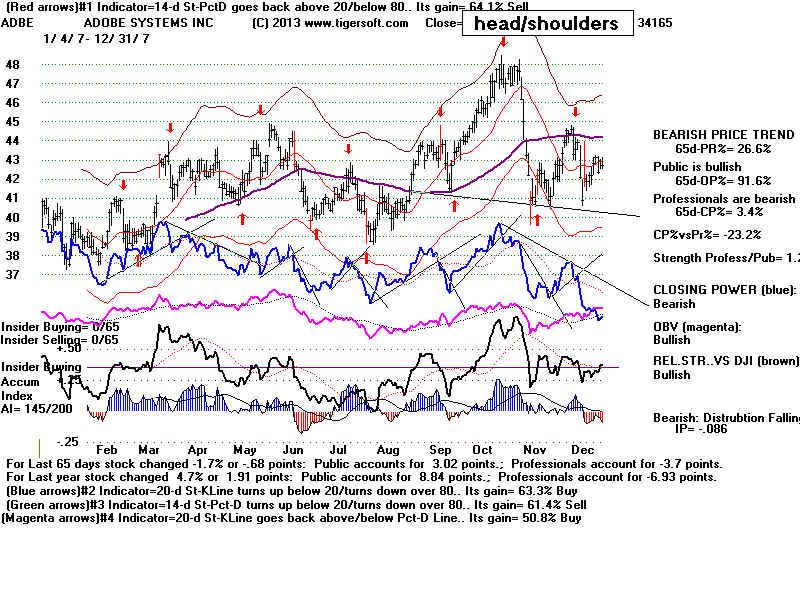
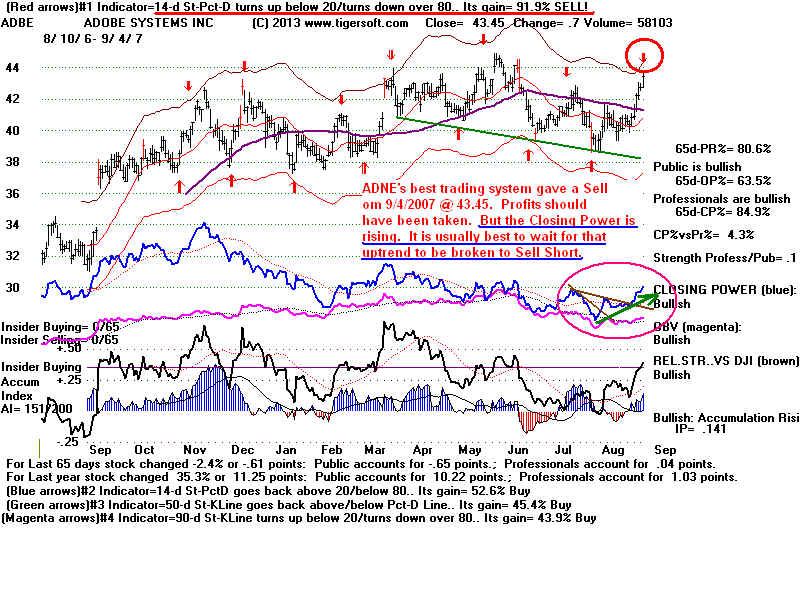
One could take profits on 9/4/2007 with ADBE at 43.45 because
of new optimized Sell. I would prefer to have held because Closing
Power was rising still as was Relative Strength Line, too. Chart#5
That turned out to be a good decision. ADBE's Closing Power finally broke its
uptrend on 10/26/2007 with stock at 47.00. It fell substantially. Chart#6
Sell at 41.64 because best trafing system has switched to a Sell.
Sell short at 41.64 because of optimized Sell and Peerless major Sell.
I would not cover on next automatic Buy on 7/10/2007 because of Peerless Sell,
falling Closing Power and head/shoulders pattern that was developing.
Cover short and go long at 40.23 on 8/8/2007 because Closing Power
has broken its downtrend and neckline in head/shoulders held up as support.
of new optimized Sell. I would prefer to have held because Closing
Power was rising still as was Relative Strength Line, too.
finally broke its uptrend on 10/26/2007 with stock at 47.00.