 |
TigerSoft and Peerless Nightly Hotline (C) 2006 William Schmidt, Ph.D Book-Mark This Address 12/26/2006 .... I show some charts of leading High Accumulation individual stocks below to illustrate power of TigerSoft. HELP: Track Record of Major Peerless Signals |
"Be a
Tiger. Go for it!"
====================================================================================
12/26/2006
We still operate under major Buys from the Peerless and the
NASDAQ programs. And there is a new
Buy-B13, telling us to expect a Santa Claus rally.
The operative major
Peerless signal is a Buy B18. It proved to be profitable 86% of the time.
It occurred on 9/26/2006 with the
DJIA at 11669. It gains an average 8.2% on the
DJIA at the time of the next major
Sell. If it produces an average gain here, the DJIA will
reach 12650 at the time of the next
major Sell.
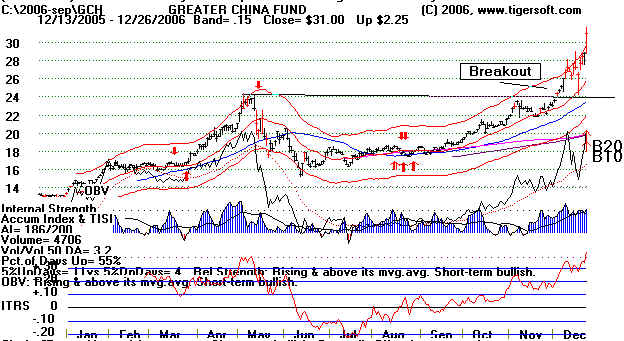
There is a global bull market going on led by China, SE Asia and
Europe. Bull markets like
this are hard to stop, but last May's S9
shows that a major top called by Peerless is strong
enough to stop even them in their tracks.
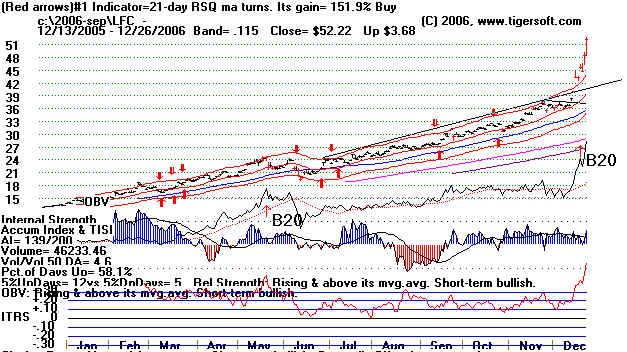
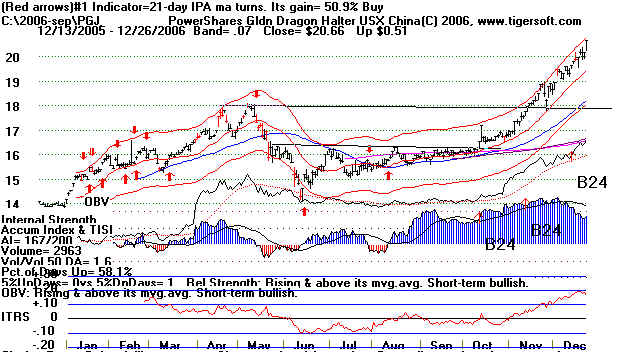
Look at the Chinese life insurance stock below, LFC.
It is up the most of all the bullish
special situations for the last year and is proof that we
should sell our big winners LAST.
It is up 36% in the last four trading days!
But
profit-taking now seems more than prudent if the QQQQ moves below 43.... The
QQQQ
has completed a bearish "hands above
the head" pattern and the DJIA has now gone a record 45
months without a 10% correction..
It is at support. Watch to see which way it moves. The
Red Sell Signal is part of an optimized
system that has gained 35% for the last year. It is oversold.
A great rally hs occurred from
August to the end of November. Now the market is clearly
getting winded. The fizzled
breakouts by the NASDAQ, QQQQ (Nasdaq-100) and
RUT (Russell-2000) are warnings. The
QQQQ (Nasdaq-100) has closed decisively below its
rising 50-day ma with its
Accuumulation Index negative. This is defitiely bearish for the
QQQQ. If it were a stock we
would have to say "Take profits." If it turns out to be leading
the NASDAQ as a whole with this
breakdown, then the NASDAQ will break below its 2400 support,
from its recent bottoms and its own
rising 50-day ma. The NASDAQ closed up 12.33 at
2413.51. Corrections usually
don't begin until January, but this year typical seasonality
repeatedly failed.
The DJI-30 pulled back to its rising
21-day ma and rose a little up from it today... The 21-day ma
has acted frequently as support since the
start of the rally since July. (The 21-day ma is the middle
red dotted line int he DJIA charts below.
) Violations of the 21-day ma are about 60% reliable at
this time of the year in telling you
direction of the next two-three weeks' trend. So weakness by the
DJI and a close below 12400 will have to
be construed as a warning of a rapid further pull-back,
probably to the lower band 2% beneath
current levels.
Also bearish are the 21-day percent
change results for the Fidelity Select Funds. These are
shown just below. As of tonight's
close, only 3 of the 44 Fidelity Select funds show more than
a 1% gain for the last 21 trading
days, But 19 of them are down more than 5%. Some of this
poor performance may owe to dividend
distributions, but there is no doubt that that these leading
funds are being pummeled with
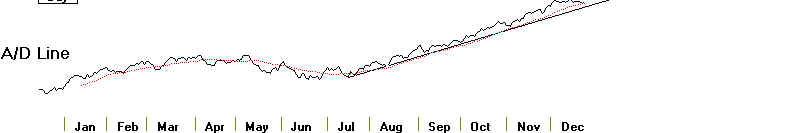
profit-taking. This contradicts the bullish message of the rising slope of
the NYSE A/D Line.
I am also concerned at the swift
deterioration in the Accumulation Index readings for the
QQQQ and SPY (SP-500). Big
money is selling with some urgency. What is it that they know
that is not yet in the public
spotlight? Higher interest rates? Increased US troops in Iraq?
A show-down with Iran over nuclear
weapons? If gold and oil are up tomorrow, we will know it's
a sure sign of renewed Middle
Eastern tensions.
A pattern of weakness after the
opening has started for the QQQQ. This must be watched.
Until the QQQQ gets back above its
21-day ma, I would expect it to continue. So, be careful
about buying tech stocks early in
the trading day.
Perhaps, the DJIA will rebound yet
again from its 21-day ma. But, given how far the markets have
rallied since July and given
that we have not seen a 10% correction in the DJIA in 45 months,
since March 2003, I think we
have to more than a little worried. Taking more profits
seems advisable if the DJIA
falls below 12400.
==========================================
FIDELITY SECTOR FUNDS' PERFORMANCE 12/26
Recent 1 Month Gain
FSTCX Telecommunications
+2%
FSPFX Paper-Forest
+1%
FSUTX Utilities
+1%
Weakest for last 30 days
FSRBX Banking
-12%
FSVLX Home Finance
-10%
FSCHX Chemicals
-10%
FDLSX Leisure
-10%
FSHOX
Construction
-8%
FSLBX
Brokerage
-8%
FSCBX Small Caps
-8%
FIDSX Financial
-8%
FSDPX Industrial Materials
-7%
FSCPX Fidelity Consumer
-7%
FCYIX Cyclical
-7%
FSRPX Retailing
-5%
FSRFX Transportation
-5%
FSNGX Natural Gas
-7%
FSMEX Medical
-5%
FSLEX Electronics
-5%
FBSOX Business
-5%
FSPCX Insurance
-5%
FSDAX Defense
-5%
============================= DJI-30
========================================
Notice the DJI's flat top. This is ordinarily a bullish sign. The DJIA is
still above its
red 32-day ma. That is usually support in an
advancing market.
Flat tops usually bring excellent breakout runs. The
reason is that such selling is too easy.
(More often, the way to make money in the market is to do
what is not so easy or comfortable.)
----------------- NASDAQ remains on a Buy and is at support
--------------------------
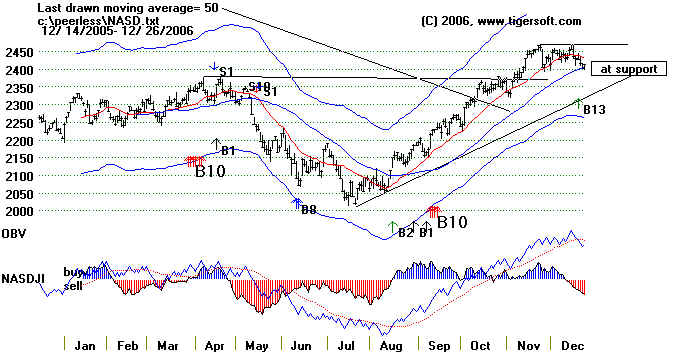 .
.
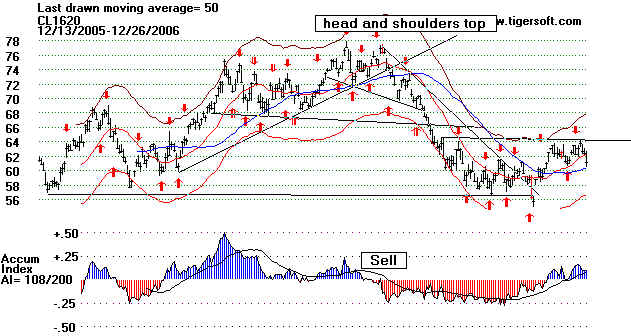
Oil fell sharply back to its rising 50-day ma. A recovery advance by
oil will hurt the
NASDAQ and the stock market generally. Watch
the oil ETF.
---------------------------------------- CRUDE OIL
--------------------------------------------------------------------------------
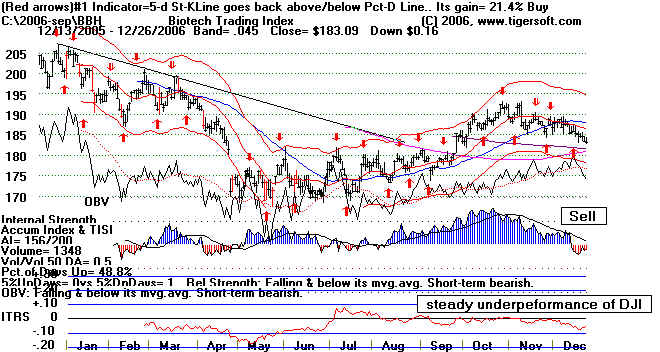
----------------------------------------------- BIOTECH
------------------------------------------------------------------------
I am concerned that we have not yet had any real recovery by the BBH
(Biotechs).
A close below its support at 185 would be bearish short-term. Its blue 50-day ma is
falling.
Its Accumulation Index is negative. So is its relative strength (ITRS).
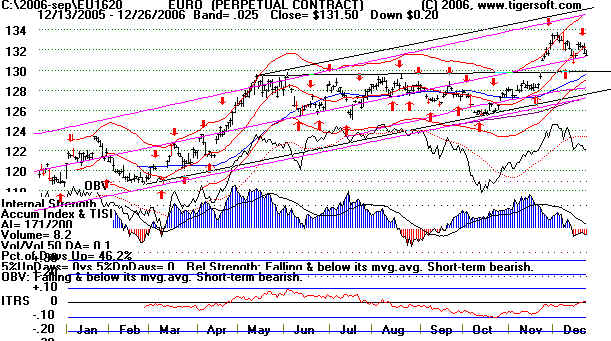
-------------------------------------- WEAK DOLLAR and STRONG EURO
----------------------------------------
The Dollar remains under
pressure. Look at the EURO chart below. Notice all the
Accumulation in its chart. Silver and gold do well in
this environment. So do foreign ETTs until there
is a major Sell Signal from Peerless.... We have to be
concerned that the pronounced weakness
in the dollar will get the FED to start
talking about its concern about "Inflationary Pressures", all
the while what it is really concerned about is how it can
finance the huge Federal Deficit" when
foreigners don't trust the dollar and it must soon start
considering raising interest rates
to satisfy them. Fortunately for the bulls, usually
the Fed will not talk about "inflationary
pressures" in December for fear of hurting Christmas
retail sales, because of their importance
to the economy. So, the Fed usually waits until
January or February. That delay buys some
time for the market in December. As a result, big
declines are very rare in December. You have
to go back to 1968 to find a case when a significant
intermediate-term top was made in December.
After
12/25 seasonality:
Since 1965, the
DJI has risen
59%
after the next 3 trading days.
67% after
the next 5 trading days,
67% after the next 10 trading days,
56%
after the next 21-trading.
+1.2% avg.
64% after
the next two months. +2.1% avg.
.........................................................................................................................................................................
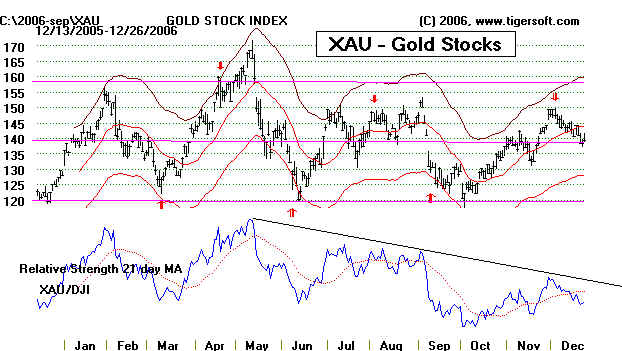
======================= GOLD STOCKS AND GOLD ===================================