 |
TigerSoft and Peerless Nightly Hotline (C) 2007 William Schmidt, Ph.D Book-Mark This Address 9/20/2007 This is no longer the site of the currently nightly Tiger/Peerless hotline. To renew please order the service here for $298 ======================================= 8/31/2007 2007's Best Performing Stocks and "Insider Buying" 8/28/2007 The Market in Sepetember and October with A Republican President 8/18/2007 Discount Rate Changes and Stock Prices: 1955 - 2007. Color Coded: Blue is new or considered most important. ================== Peerless: 1928-1966 Track Record of Major Peerless Signals Earlier Peerless-DJIA charts 7 Paths To Making 25+%/Yr Using TigerSoft New - Tiger-Blog: Humor and Political Economy ALWAYS Refresh THIS PAGE 5/15/2007 - WHAT PREDICTS STOCKS UP MORE THAN 40% IN LAST MONTH? |
NOTE:
The location of this site will change this weekend. If your subscription
has not
expired, you should be notified by Saturday night. If not and you wish to
renew,
please contact us william_schmidt@hotmail.com
Operative Major signal(s)
- Older Sell
S9/S12 and new second minor Buy B14
Peerless gave a second Buy B14 the day of the 1/2%
rate cut. B14s are rare. There
have only been 11 since 1965 and we have now seen two in the last month. Between
1965 and 2006, they averaged
a 12.86% gain if the DJI was held until the next major Sell. There is only one loss
in this
period. And that produced only a 4.6% loss in the 1091-1982 bear market. They
are less
reliable in the period 1942-1966, but were sometime dead-on in their bullishness.
So, though
they are not treated as major Buys, I would, given just the second Buy B14, let the
market
have every chance to move higher. That is made even truer with the Fed rate cut.
Seasonality is bearish for the next two weeks. A retreat from the resistance
levels now reached by the DJI and NASDAQ should start. We saw a new Sell signal
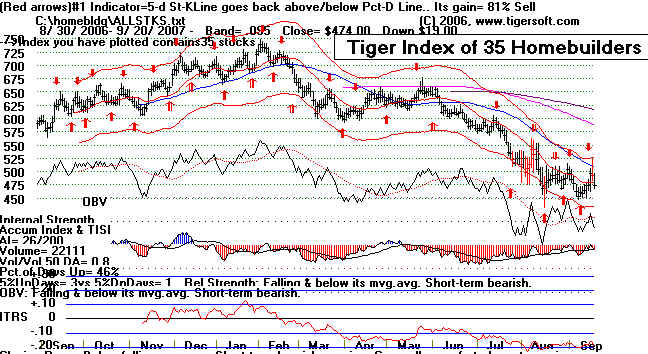
from the NASDAQ today. There 1360 more down than up on the NYSE. Homebuilders,
who might have thought they would be one of the beneficiaries of the 1/2% rate cut
have shifted back to a Red Sell signal and are testing their lows. A new low by this
index would be bearish for the market.
Tiger Homebuilding Index on a Sell.
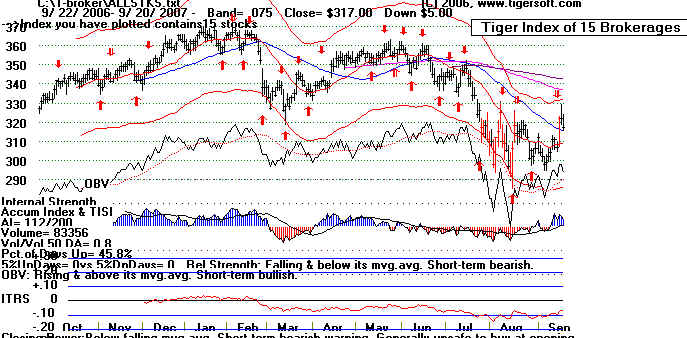
Brokerages correlate closely with the heneral market. Here is my Tiger Index
of 15 of them. It has shifted to a red Sell. This also suggests some weakness
for the next few trading days.
Tiger Index of 15 Brokerages
.
The FED's 1/2% rate cuts has dramatically weakened
the dollar and boosted overseas
stocks Below is the Tiger Index of 53 foreign ETFs. Perhaps, the easy
money has now been made.
Foreign stocks are, very generally speaking, back to the resistance of the old July highs.
Adopt and wait and see attitude. There may still be more upside progress, but
it is
not prudent to buy just below resistance.
The strongest groups, GOLD, CHINA and OIL, are so much stronger than the
rest of the market now, I suggest finding some way to play them, as much as trying to
trade the market as a whole.
Tiger Index of Foreign ETFs
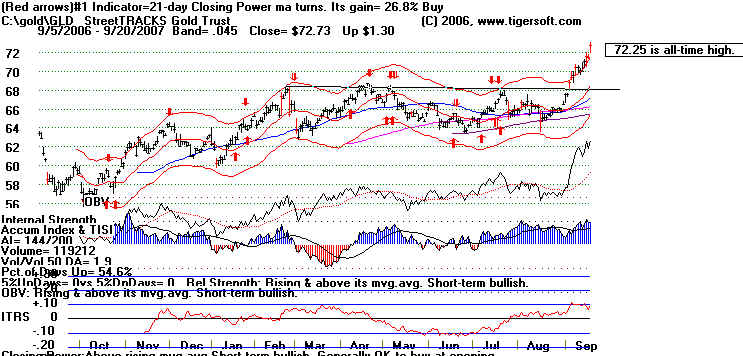
GOLD
Only a 1/4% cut was expected from the Fed on Tuesday, but they gave the market
what the bulls wanted, a 1/2% cut.... This is a big boost to gold and gold stocks.
Gold has just made a new all-time high above 725, or 72.5 for GLD. "Let it run
now."
That's our advise.
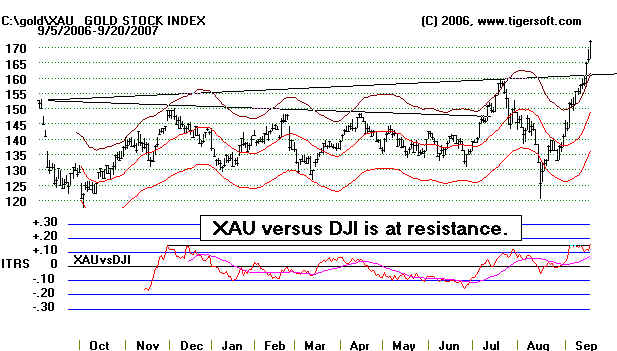
We have been saying for some time that the XAU would soon be making a
major breakout by surpassing 160. That has now happened. Already it is over
170. Below is the chart of XAU. Its RELDJI is approaching its own
breakout.
The XAU is not yet outperforming GLD on a 12 month basis. But it has been
zooming up faster for the last 2 weeks. I have posted more information on
this
most important breakout on my Blog.
http://www.tigersoft.com/Tiger-Blogs/9-19-2007/index.html
=====================================================================================
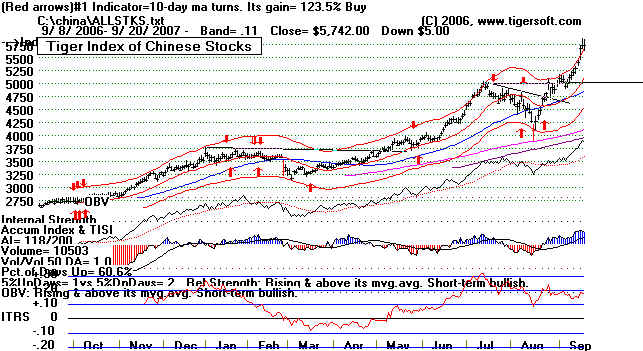
CHINA
China, the strongest area of foreign investments, rested today.
It looks like this
is now experiencing a climactic vertical ascent. CHN, mentioned last night, has a
projected target another 10% higher based on its inverted head and shoulders
pattern's size. When we look at the best performing foreign ETFs for the last
65 trading days, a quarter, we see the top five relate to Chinese investments.
GCH Greater China Fund
+41%
JFC Jaredine Fleming China +31%
CHN China Fund
+23%
PGJ PowerShares Goldn Gragon +21%
GRR Asia Tiger Funds.
+20%
Tiger Index of Chinese Stocks
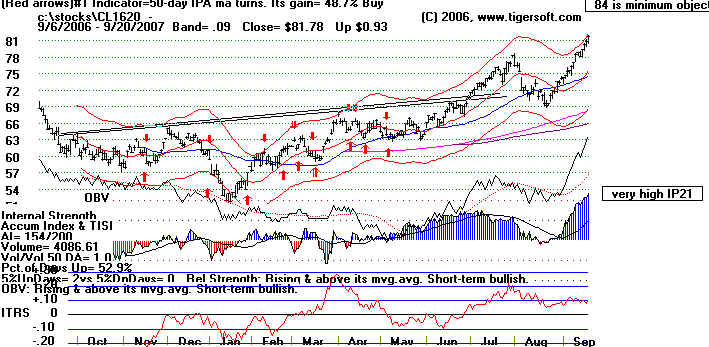
Oil Stocks Are Surging, too.
Crude Oil
has made an all-time high. Its IP1 is very high, above +.50. We associate
that important insider
buying. It sure like $100 is possible. I reckon $84 as the minimum
target based on the height of the
earlier head and shoulders pattern.
There is breaking news of a government sting involving Congressmen
taking
bribes from
oil interests. Let's hold back here. Some of the best looking oil stocks
as Tiger
judges them are: ACGY, STO, TTES and WFT. Waiting for a little pullback
would be
prudent. But in a run like this, wear performance money chases fewer and fewer
high
performance stocks, and pullbacks are usually shallow.
======================================================================================
Market Outlook
It is important to see that The FED can delay a bear market
and it can prolong
a bull market. Our detailed study showed this to
be true in the summer of 1968, the
fall of 1971, 1975, 1976, 1982-1983, 1980, 1984, 1986, December 1990-1991, 1996
and 1998. That is what they have done here. I suspect that they will do
all they
can to delay the inevitable bear market until a Democrat is in the White House in
2009. Look at the evidence I presented before judging this to be too cynical.
http://www.tigersoft.com/Tiger-Blogs/8-18-2003/index.htm
Yesterday Peerless gave a second Buy
B14 signal, NYSE Up Volume swamped
down volume. It's true that July's S9/S12 has not been reversed. But the DJI
did fall
10% afterwards and there are a few cases since 1942 where the DJI moves significantly
higher without an immediate major Buy signal. The only case since 1965 was in the
Spring
of 1987. We see this most often when there have not yet been three or more S9 or S12
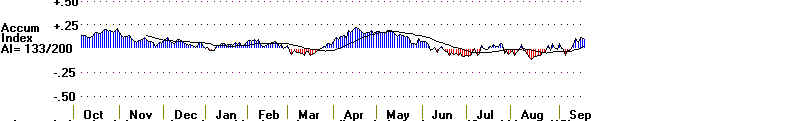
clusters in the previous 8 months, as is true here. The P-Indicator, V-Indicator and
the
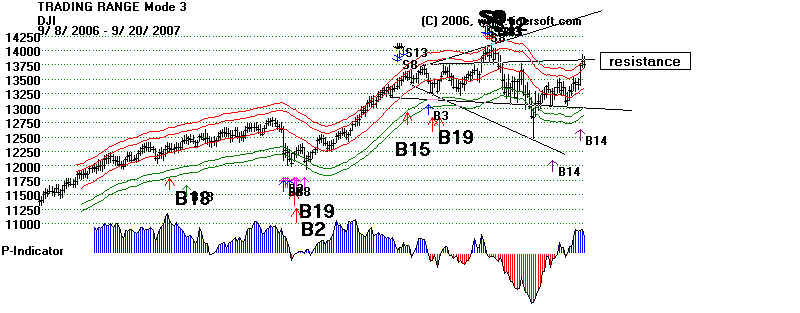
Tiger Accumulation Index are all now positive. The DJI and NASDAQ have reached
points of resistance (See the charts.), but it sure looks the DJI want to get back up to
14,000. The NASDAQ is still below what it was when Bush took office, so it could
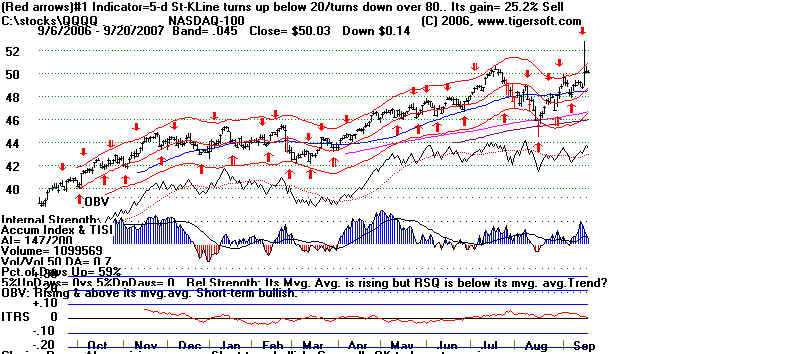
move higher, too. The NASDJI Indicator is positive, showing the NASDAQ is
outperforming the DJI. Don't use the short-term Stochastic for a few days at
least.
Let the surprise 1/2% rate cut's bullishness play itself out.
________________________________________________________________________________
DJI - 250 more points to go to reach the July peak.
NASDAQ
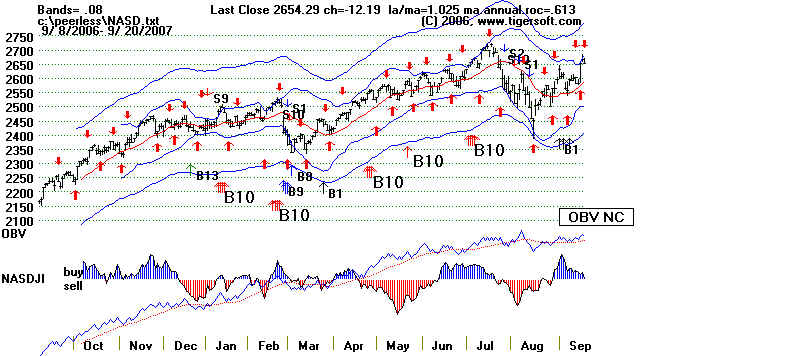
The QQQQ
data was questionable yesterday. But it has not been
corrected from our source.
_______________________________________________________________________________
Sector Signals
44
Sectors' Buy and Sells:
Today 19 Buys 25 Sells
Yesterday
17 Buys 27 Sells
"Most Bullish"
IXP (Global Telecomm) 75.61 +.21 IP21>.25 Strong OBV.
AI/200=167
IGE (Natl. Resources) 129.38 +.68 Back to 12 mo high. OBV
is lagging.
IXC (Global Energy) 137.85 +.53 138.4 is 12 mo
high.
=====================================================================================
US Dollar's Trend Remains Down.
The dependency of the US
Treasury on China and Japan to buy Treasury securities is a key
here. The enormous US trade and budget deficits are
taking away from the Fed, or at least
limiting, the simple option of recharging the economy by
means of buying debt or lowering interest
rates. The reason is that the Dollar might free-fall
if the FED lowers interst rates too much
or too fast... Foreigners may choose not to buy a dwindling
asset that pays an interest rate lower
than its annual rate of decline...See my discussion of the American growing
dependence on
Chinese funding
of the US debt. The Japanese Yen historically moves more independently. It is
on the verge of a breakout to new highs. Do you see
the tell-tale rise in Accumulation a month
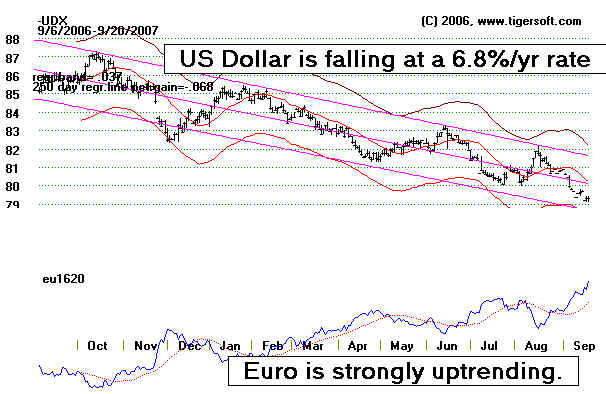
ago? The Euro has stopped idling and is starting
another rally, thanks to the probability of another
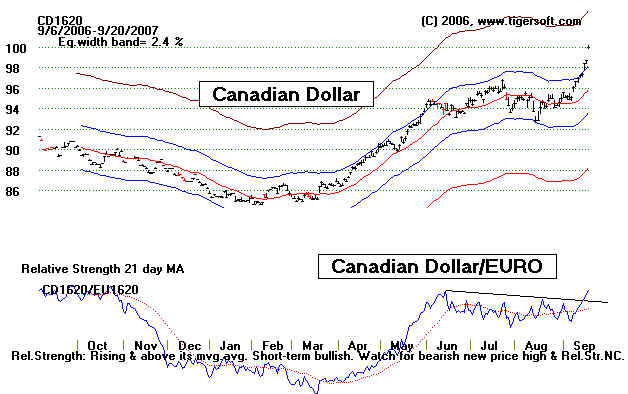
rate cut. Watch these charts. The Euro
shown below is rising at a +8.6% clip versus the DJI.
9/20/2007
The US Dollar has been falling at a 6.8% rate this past year. By comparion,
the EURO just made a new high
and is rising at an 8.6% clip. It will be even more
difficult for the Treasury to
sell its US bonds to foreigners. They will have to print more
money. Hence the rush
into real resources will continue. That should also help US
real estate, though that has
not yet happened. The Canadian Dollar is now even
stronger than the EURO,
because of the mineral resourves Canada has.
Look at the strength in the Canadian Dollar.
=================================================================================
Given
how far up the markets are above big support and how long it has been since there was a
major correction, plus the bearishness of years ending in
"7", it should pay to do some selling.
Table FALLS IN YEARS ENDING
IN "7"
1837 Panic
......
1887 September 19 (-2.24%)
& October 12 (-2.29%)
1897 September 21 (-3.95%)
& October 12 (-3.90%)
1907 Declined
whole year from 90 to 55 in November 37% decline.
Major banking panic October 22.
---------------------- My own study starts
in 1915 -----------------------------------
1917 Early
June peak at 99.... Bottom in December at 66 ... 33%
decline.
Tip-off was well-tested support failure at 88 in August
...........................................................................................................................................
1927 Peak on 10/4 at 200... Fell to 181 on 10/24... 9.5%
decline
Tip-off was OBV NC at upper band.
Tip off was Accum.Index was negative at upper band
.....................................................................................................................................................
1937 Peak was at 190 on 8/16 ... Fell to 113.6 on 11/24 October
18 ...40% decline
Tip-off was OBV NC at upper 3% band..
Tip off was Accum.Index was <+.05 at upper 3% band.
.....................................................................................................................................................
1947 Peak was at 184 on 2/11... Fell to 163.60 on May 20.
...10.9% decline
Tip-off was small head and shoulders top with neckline break at 181 on 2/20
DJI made a 3-month high which was not confirmed by A/D Line
......................................................................................................................................................
1957 Peak was at 521 on 7/12... Fell to 419.80 on October 22.
...19.4% decline
Classic "Sell S9" at upper 3.0% band.
"Sell 12": Tip off was Accum.Index was <+.05 at upper 3% band.
Credit crunch. Sputnik
.....................................................................................................................................................
1967 Peak was at
943 on 9/25... Fell to 826 on March
22. ...12.4% decline
"Sell 12": Tip off was Accum.Index was <+.03 at upper 2.8% band.
Tip-off was head and shoulders top with neckline break at 918 on 10/13
.....................................................................................................................................................
1977 On-going bear
market which did not bottom until March 1978...
In 6/22 DJI reached 2.5% upper band at 926. ...19.0% decline
......................................................................................................................................................
1987 Peak was at 2702
on 8/26... Fell to 1739 on October
19. ...35.6% decline
10/1 at 2639 "Sell 12": Tip off was Accum.Index was <0 at upper 2.8% band.
10/2 at 2640 Classic "Sell S9" at upper 2.6% band. Hit 1739 on 10.19 34.1% decline
......................................................................................................................................................
1997 Peak was at 8015.5
on 10/1... Fell to7498 on 10/28 6.5% decline
"Sell 12": Tip off was Accum.Index was <0 at upper 2.5% band.
......................................................................................................................................................
2007 ???? The DJI
has fallen to a low 10% below its year's high.
=============================================================================
NYSE New
Highs (note link)
NYSE NHs
New Lows
--------------
--------------
9/20
40 13
9/19
89 5
9/18
89 11
9/17
22 31
9/14
26 27
9/13
31 32
9/12
30 49
9/11
23 18
9/10
15 47
9/7
6 30
9/6
24 15
9/5
14
18
9/4
37 12
8/31
26 9
8/30
16 22
8/29
21 19
8/28
3 27
8/27
13 15
8/24
19 7
8/23
11 10
8/22
9 10
8/21
7 21
8/20
8 24
8/17
10 34 Quite a recovery
8/16
4 634 Extreme!
8/15
1
549
8/14
2
332
8/13
8
125
8/10
3
174
8/9
22 146
8/8
70
63
8/7
28 141
8/6
21
261
8/3
13 279
8/2
29
66
7/31
11 160
7/30
14 176
7/27
8 221
7/26
11 503 (correct?)
7/25
18 215
7/24
12 232
7/23
81 78
7/20
34
74
7/19
112
65
7/18
45 NC! 80
------------------------------S9/S12----------------------------------------------------
(Source:http://dynamic.nasdaq.com/asp/52weekshilow.asp?exchange=NYSE&status=HI)
FIDELITY SECTOR FUNDS' PERFORMANCE 9/20/2007
Biggest drops on Friday include automotive,
retailing, consumer, electronics and housing.
Clearly there is increasing concern that a recession looks ahead and that
will hurt consumer
spending. Even hopes of a rate cut are not enough to hold the line
here.
============================================================================
Recent Month's Gain
Biggest Holdings
Strongest
FSAGX Gold
+28%
MDG, ABX, IAG, NEM, KGC, GFI, GG, AZS
FSESX
Energy
+18%
SLB, NOV, SII, RIG, BHI, EFT, CAM, GSF, DO
FNARX Natural
Resources
+15%
XOM, VLO, COP, SLB, NOV, SII, RRC, GSF, AA, COG
FSENX Energy
+14%
XOM, VLO, SLB, COP, NOV, RRC, UPL, CVX, COG, EOG
FSDPX
Inustrial Materials
+10%
DD, MON, AA, DOW, FCX, PX, APD, NUE, WY, CE
FWRLX Wireless
+9%
RIMM, QCOM, VOD, SNCR, S, SBAC, AMT, CCI, T
Weakest
FSVLX
Home
Finance
-2%
FSRBX
Banking
-1%
============= After 9/19 seasonality ==================
Since 1965, the
DJI has risen
39% after the next 3 trading days. Avg change= -0.3%
36% after the next 5 trading
days. Avg change = - 0.5%
41% after the next 10 trading days. Avg
change =- - 0.3%
59% after the next
21-trading. Avg change = 0%
54% after
the next two months. Avg decline = +0.5%
===============================================================
STOCKS
Please consider getting Tiger Soft and Power-Ranker
to Find these stocks
each night or subscribe to the Full Hotline including Stock
Recommendations
for Tiger Software. See also a "Perfect Biotech
Play", 9/13/2007.
This is
what we strive for. Look at stock's behavior last Fall.
-
-
-
-
-
-
--
--
--
---
-
-
--
-