Example: EWZ Brazil Country Fund.

------- Trading an ETF like EWZ (Brazil) ---------
For trading results see Brazil (em Português) 3/8/2012
Peerless Trading of Latin American and Brazilian ETFs 4/26/2011
Producing the Buy and Sell Signals on an ETF, like EWZ should be easy.
The track records we show elsewhere are produced automatically by the software,
too, where a "B" signal is a Buy and an "S" signal is a Sell. The rules are that
1) Any Buy reverses any Sell, and vice verse.
2) One only buys or sells on the Initial Buy shown on
the chart and on subsequent reversing Buys or Sells,
3) We do not trade on subsequent (usually "reinforcing") "
signals.
4) We further assume in our results (though you could have the computer
show you the results where the positions are taken at the close) that
that one takes or closes out a position, long or short, at the next day's
opening.
5) The software assumes that $10,000 is initially invested and all
proceeds afterwards are fully invested.
6) Lastly, $40 commission and clippage is subtracted at the time
of each closed out trade.
7) The trading results assume that a position is closed out on the
last day shown.
8) No allowance is made for dividends paid. Most often the data
we receive has not been adjusted.
9) The user can break out the trading results for "long positions only",
"short positions only" or "long and short positions".
Here are the steps to take (i.e. commands to enter)
when putting our Peerless Buys and Sells on
charts produced by our TigerSoft software:
1) You must download and run Peer04.exe from the Tiger Data and
SECTORS.exe (for US ETFs) or ETFs.exe (for non-US country fund ETFs.)
Go to the Tiger data page and open and run these files. The best way to
do this is Peercomm + Internet + "http://www.tigersoft.com/1221"
+ click "Display Web Page Chose Above".
Do not use quote marks and do use the number that currently applies.
2) Next turn off the automatic Optimized Buy and Sell Signals.
The best way to do this is Peercomm + Charts-2010 / 2011 / 2012 +
Run/Setups in upper left corner of Tiger page + Set Initial Screen's Signals
+ Change the "Y" in the top box at the upper right to N and click
Save these parameters to disk.
3) To produce graph next choose Daily Stocks fromt he Tiger page.
Enter or highlight EWZ from mthe left-most vertical scroll-bar
and click OK or find and double-click EWZ.
4) To superimpose the Peerless signals, choose Signals(1) +
Superimpose DJI Saved Signals. A chart like the one below will
appear. (I later added the remark-reminder in the box at the top using
Operations + Add or Edit Personal Reminder + my comment about the gain.)
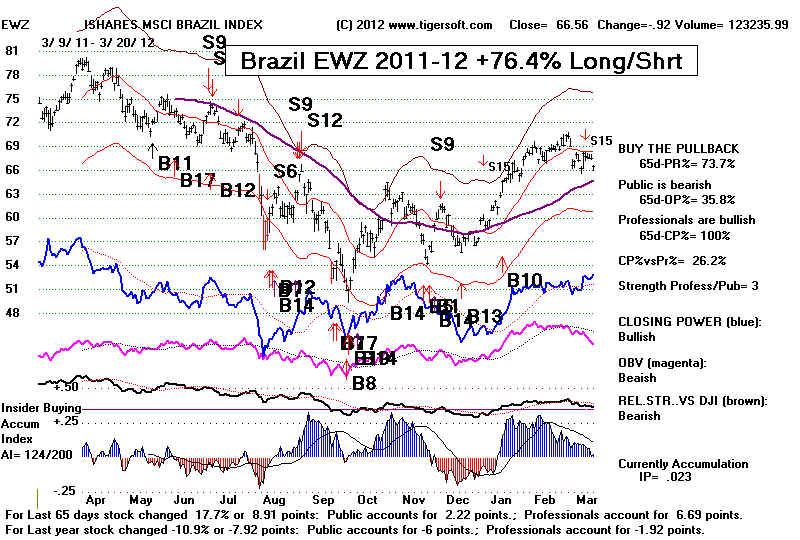
5) To see the trading results, choose Operations + What happens to $10,000
Buys and Sells Short + Y
Upon doing this, you will see a list of the trades chronologically arranged.
You will see at the top the pct gain for the number of trading days used.
These results are compared with a Buy and Hold strategy. At the bottom,
the biggest intra-day paper losses using closings are shown for long and
for short positions. It is suggested elsewhere in our written documentation
that any paper loss bigger than the largest shown for the last year should
probably be used as a Stop Loss. But this is not assumed in the results we have
shown.
Here are the steps to take (i.e. commands to enter)
when putting our Automatic Optimized Tiger Buys and
Sells on charts produced by our TigerSoft software:
1) If you have not already, you must download and run Peer04.exe from the
Tiger Data and SECTORS.exe (for US ETFs) or ETFs.exe (for non-US country fund ETFs.)
Go to the Tiger data page and open and run these files. The best way to
do this is Peercomm + Internet + "http://www.tigersoft.com/1221"
+ click "Display Web Page Chose Above".
Do not use quote marks and do use the number that currently applies.
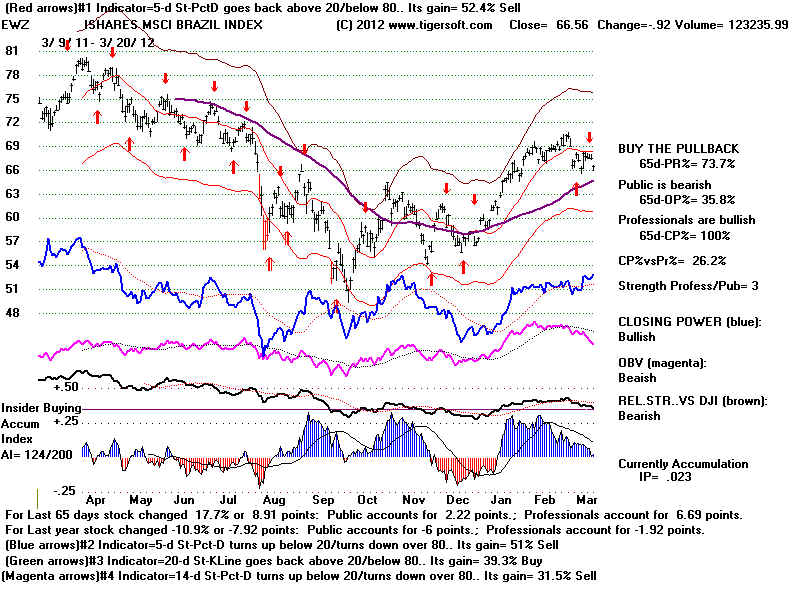
2) Next turn ON the automatic Optimized Buy and Sell Signals.
The best way to do this is Peercomm + Charts-2010 / 2011 / 2012 +
Run/Setups in upper left corner of Tiger page + Set Initial Screen's Signals
+ Change the "Y" in the top box at the upper right to Y and click
Save these parameters to disk.
3) To produce graph next choose Daily Stocks fromt he Tiger page.
Enter or highlight EWZ from mthe left-most vertical scroll-bar
and click OK or find and double-click EWZ.
The chart below is typical. The top line shows the basis of the red Buys
and Sells. A 5-day Stochastic-Pct-D crossing back above 20 gives a
reversing Buy and cover shorts signal. The same indicator crossing below
80 gives a reversing Sell. The computer in a fraction of a second compares
the trading results of 60 different trading systems and places on the screen
the best.
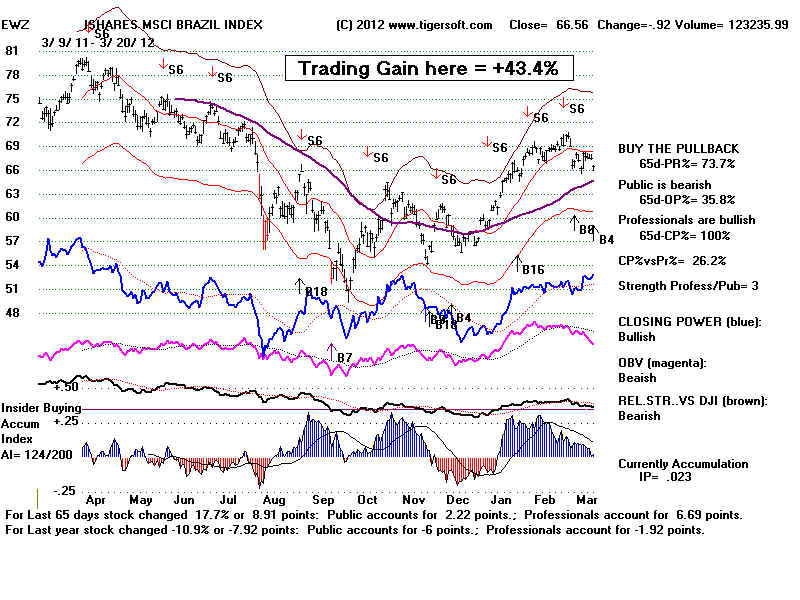
Putting our Technical Tiger Buys and Sells on
Tiger Charts.
With a TigerSoft chart on the screen, you may use any of the items under
Signal(1), Signals(2) and Signals(3). The first item under Help shows you the basis
of each signal. In the chart below, I have placed the Minor Buys (Signals(1) +
Minor Buys... on the screen and then the Minor Sells... on it. This produces a gain
of 43% for the last year, as deterimined by the same technique to show trading
gains as used above. Note that you can then add specific signals using Signals(1)
+ Display User Selected TigerSoft Signal.
 tig
tig====================================================
This might also be a good place
to begin, if you are absolutely new to
the stock market.
Fundamentalists
are those who believe future stock market prices can best be predicted
by studying earnings reports and industry trends. That's a reasonable
approach if the
earnings can be trusted and are not already priced into the stock by insider
trading.
As techinicians,
we look much more at the price and volume action of the stock because the
price and volume of the stock often reveals price trends which are apt to
continue
and because our analysis can show whether insiders are significantly buying
or selling,
thus likely to cause the stock to start trending significantly up or down.
I have already written a lot about recognizing very bullish stocks and very
bearish stocks.
And you can also buy our books on the subjects.
Explosive Super Stocks
Buy Stocks Showing The Signs of Significant Insider Buying
TigerSoft's Explosive Super
Stocks - "Follow The Money"
TigerSoft Blog - 4/14/2008
- LESSONS OF THE TOP PERFORMING STOCKS OF LAST YEAR ...
TigerSoft New Service/Blog
- 5/21/2008 - How To Buy The Biggest Movers in SPeculative Stocks
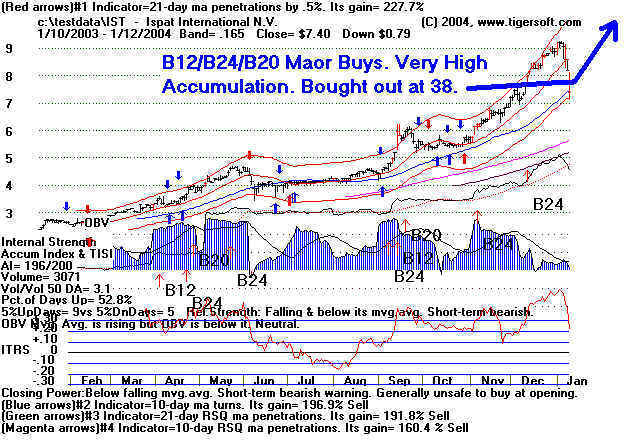
The key here is to spot
the very high bulges of Blue from our TigerSoft Accumulation Index.
Note the gradual uptrend, too. Our materials will explain the other
indicators, lines and
Buy and Sell arrows. Don't sell a stock liek this too quickly.
Our books discuss when
it is best to take profits.
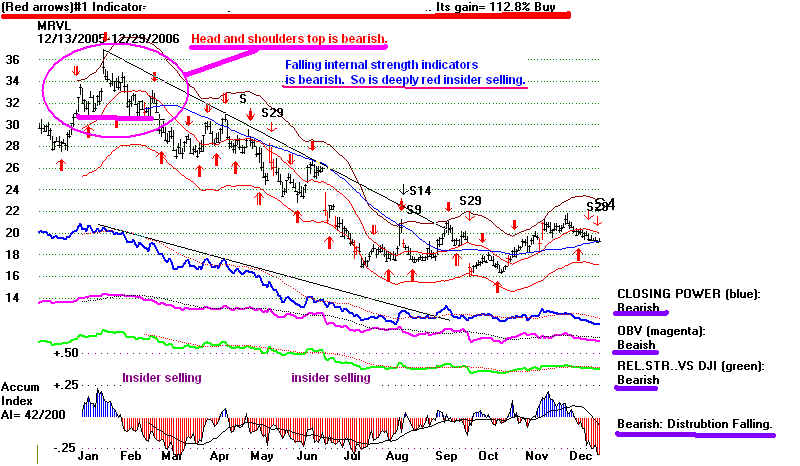
Selling
Short Stocks That Show Heavy Insider Selling.
Use Tiger Software's Insider
Selling ...
The key
here is to spot the deeply negative red dips in our TigerSoft Accumulation Index.
This represents insider selling. Note also the steady
price downtrend. Trade with
expected downtrend using short sales. Avoid buying a
stock like this, because it looks
"cheap". .
Marvel's chart is continued further below.
Immediately below is CitiGroup.
One million
shares of insider stock were sold in 20072-2008 of Citigroup, according
to Yahoo
reports. 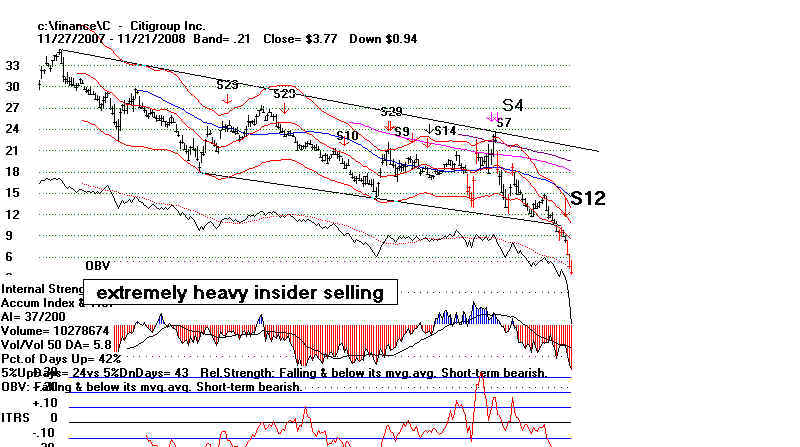
Here I want to show how to use TigerSoft and Peerless
to trade quite easily and very profitably
a stock that is
moving sidewise.
Trading Trendless Stocks.
Trendless stocks be traded quite profitably using certain of our automatic
Buys and
Sells, which are well adapted to working with stocks in "flat trading
ranges". First, we
must establish that the stock is trendless. We can do this by drawing
support and resistance
lines. But, for beginners, the simplest approach is to place a
TigerSoft "trend-finder channel"
on thje chart and note the slope of the trend. This is easy to do. Here
the slope is -.104,
i.e. prices are falling at under the rate of 12%
per year. As long as the slope is not too steep, say over
+12% or under -12%, prices usually trend to bounce up from the bottom of the price
channel
and down from the top of the price channel. In less than a second, our
automatic red Buys show
what the best way would have been over the last months to have traded the stock,
from among
more than 50 excellent trading systems. Here taking all the Buys and
Sells to both but the stock
on red up arrows and sell ir it and sell short on red down arrows would have gained
someone + 174.5%
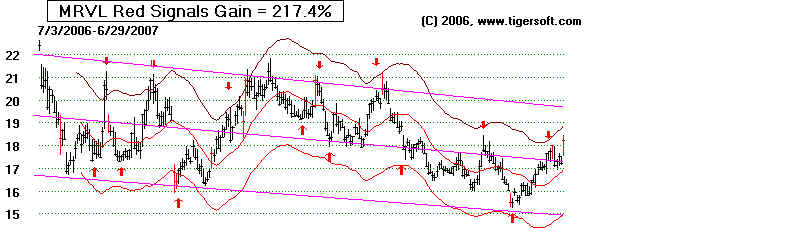

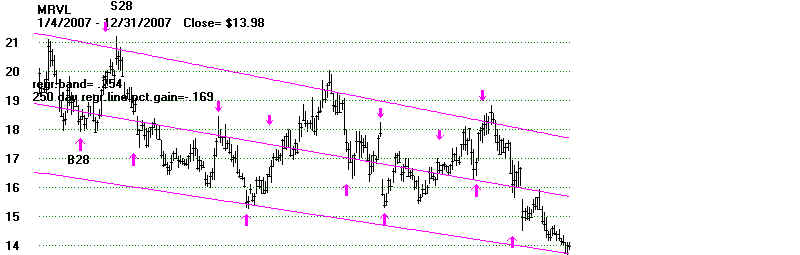
Here is the stock moved forward in time by 6 months. The
slope of the channel has now increased to
-.169 ( -16.9%).
This is too steep a slope to trust both
Buys and Sells.
Though, trading it on the automatic Buys and Sells would have worked
reasonably well, there was
more money to be made by selling it short on the red Down Arrows. The
red Buy and Sell arrows
here gained +52.9%. But the last Buy in the chart below would have
turned out badly. The downward
slope was then too steep to make it a trustworthy Buy. .
![]()
Buying at 14-15 in December 2007 would
have meant sustaining a 35% loss when stock
fell to 10. Besides the steepening
downward slop, there were other warnings. Notice
how prices fell decisivly below the
channel lines I have drawn in. This is bearish action
and negates a flat chennel. You
should be aware of prices go past their normal channels.
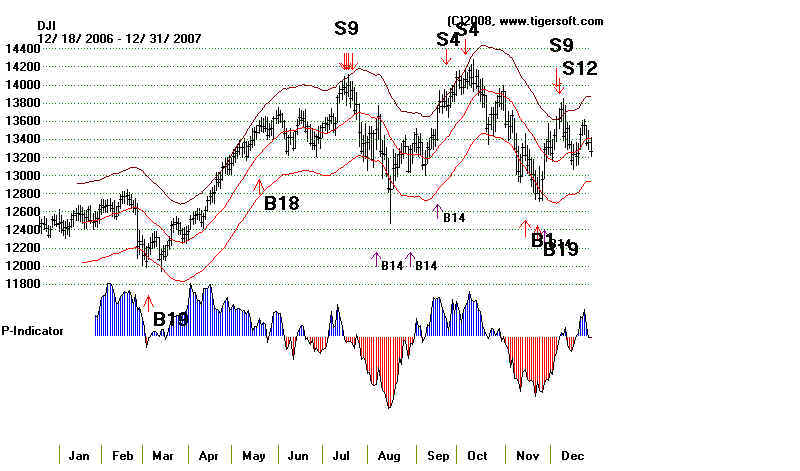
A second way to spot the likely quickenng
pf the downtrend was to Peerless Stock Market
timing. See the second chart
beneath this. Its three sets of major Sells on the DJI-30 in the
period from July 2007 to December
2008 was very bearish.

Notice the July 2007 Peerless Sell signal. Peerless is our general market timing
program.
MRVL fell down as the general market
retreated. Our Peerless has a long history of calling market
tops and bottoms. Also see the
other Sells on the chart below of the DJI. There were quite
significant. Se the Blogs done here
at that time. .
July 25, 2007 The Curse of Cassandra:
With Peerless You Will See The Future, but Your Friends
Will Not Believe You.
August 2, 2007
A Look at Biggest Losers since major
Peerless Sell S9/S12 on 7/17/2007
August 5, 2007
Don't Be A Deer in The Head
Lights.
Look at How Many Valid
Predictions Our Peerless System Has Made.
November 22, 2007
World Bull
Market Is Ending according to Numerous Head and Shoulders' Top Patterns
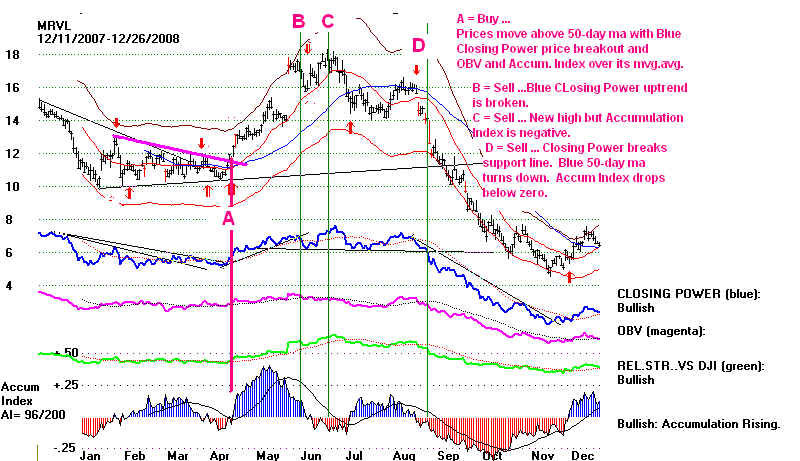
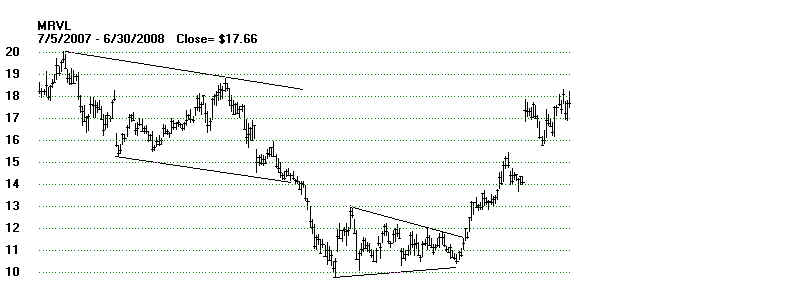
The more recent chart of the MRVL shows the
wild volatility the stock has had in 2008. Remember
to change your tactics when a stock ceases to
behave normally for a trading range stock. We show
you how to trade stocks not in
"polite" trading ranges. Here are the basics.
1) Watch the trend of the Blue 50-day price ma. It is bullish when that ma is rising
and prices
are above it but the move must be confirmed by the Tiger Accumulation Index and Closing
Power.
2) Watch the notations on the right of the screen. The more "bullish"
notations, the better.
The more "bearish" notations, the weaker the stock looks.
A) A Rising blue Closing Power
is bullish.
and a Falling Closing Power is bearish.
(Also watch for trendbreaks of the Closing Power.)
B) A Rising magenta OBV Line
is bullish.
and a Falling magenta OBV Line is bearish.
C) A Rising green Relative Strength
Line is bullish.
and a Falling green Relative Strength Line is bearish.
D) A Rising Blue Accumulation Index
is bullish.
and a Falling red Accumulatin Index is bearish.