Price Trends and
TigerSoft's Fixed Rule
Buys and Sells
Tiger Software Charts Make Analysis of Stocks Simple, Easy and Profitable!

Correct Placement of TigerSoft Signals
See also Trade with The Confirmed Trend of The 50-day MA
The correct placement of TigerSoft signals on a chart requires knowing if the confirmed trend of the
50-day ma is UP, DOWN or Mixed. Visual inspection of the Blue 50-day ma is required along with
the level of the Accumulation Index and the trend of the Blue Closing Power. If the 50-day ma is
clearly rising and the Accumulation Index is positive and the Closing Power is above its rising 21-day
MA, the confirmed trend is up. The opposite conditions force a judgement that the confirmed trend
is down. All other circumstances, cause a chart's trend to be in doubt. The fixed-rule signals you place
on the chart should reflect the confirmed trend.
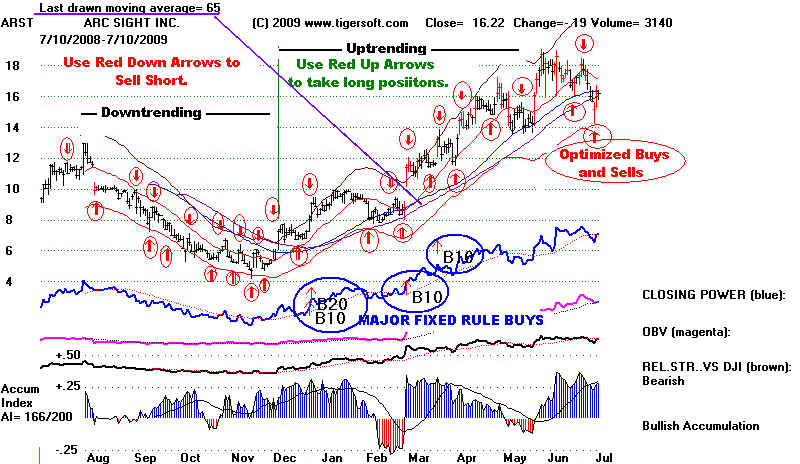
TigerSoft Optimized Buys/Sells - red Buys and Sells that appear automatically.
- see top of chart for basis of signals.
TigerSoft Fixed Buy/Sell Rules (Signals1...Signals2...Signals3
IMPORTANT--->
Automatically fit trend - USE Signals3 - Buy Sells compatible with 50-dma
More Signals? Use these...
With a chart on the screen use the following:
Up-trending stocks:
Signals1 - 1, 3, 4, 5, 19
Down-trending stocks:
Signals1 - 2, 7, 8, 16, 17, 18
Trading Range - Mixed Trend stocks
Signals1 - 6, 10, 11, 12, 13
Warnings - Counter-Trend
Signals1- 2,, 18
Signals2- all
signals, so does TigerSoft, which uses confirmed moves past key moving
averages, like the 50-day and 65-day ma, to distinguish up-trending and
down-trending stocks. The TigerSoft Help routines define and discuss
all major and minor Buys and Sells. The 65-day ma makes more statistical
sense than a 50-day ma, as the former represents the number of trading days
in a typical quarter.
Correct Placing of Buy Signals on A Chart
After you have a chart on your screen, try the following techniques.
Place a 65-day ma on the chart. Mvg.Avg + 65-unit.
Exclude additional Buy signals from the area of the chart where the stock is
below the 65-day ma. Do this by using Lines + Make Signals' Exclusion Zone
+ click first on the oldest portion of the graph where prices are below the 65-day ma
+ click secondly on the last area of the chart where prices are below the 65-day ma
+ Signals(1) + (1) Major Buys +(3) Minor Buys + (4) B21 and B13.
Correct Placing of Sell Signals on A Chart
Exclude additional Sell signals from the area of the chart where the stock is
above the 65-day ma. Do this by using Lines + Make Signals' Exclusion Zone
+ click first on the oldest portion of the graph where prices are below the 65-day ma
+ click secondly on the last area of the chart where prices are below the 65-day ma
+ Signals(1) + (2) Major Sells +(8) Minor Sells + (16) Minor Sells
Moves past one of these key moving averages is more likely to bring a
a substanial advance when TigerSoft gives a major Buy B10, B12, B20 or B24.
Reversals of extended declines also bring sizeable up-moves. Since a
stock may simply be ending its downtrend, when it surpasses its 50-day
and 65-day mas., it is only when the stock makes a confirmed 6 month high
that we can really know that a sizeable uptrend is under way. Watching
the Buy signals that develop (under Signals-1) and how positive the internals
become, often let us anticipate price breakouts.
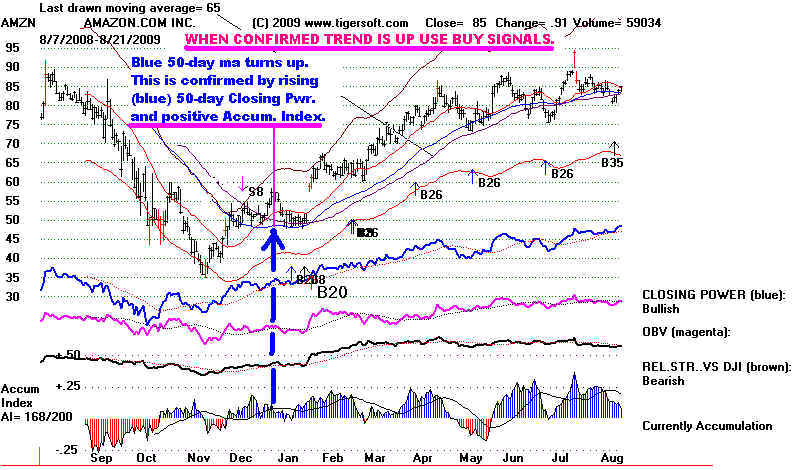
Major Buys B10, B12, B20 and B24
When a stock makes a confirmed move above the 50-day and 65-day
moving averages, we employ the automatic fixed rule major BUY signals
to spot the best stocks and to see when to Buy. The first such Buy is usually
a good entry point. Additional Buys confirm the trend. Confirmed Breakouts
to new highs often also are good entry points. So, are the optimized Buys
while the trend is up. Trading profits can be taken on the next optimized
Sell or when prices close below the 50-day and 65-day ma and this weakness
is confirmed by weak readings from TigerSoft's Accumulation Index and
Closing Power.
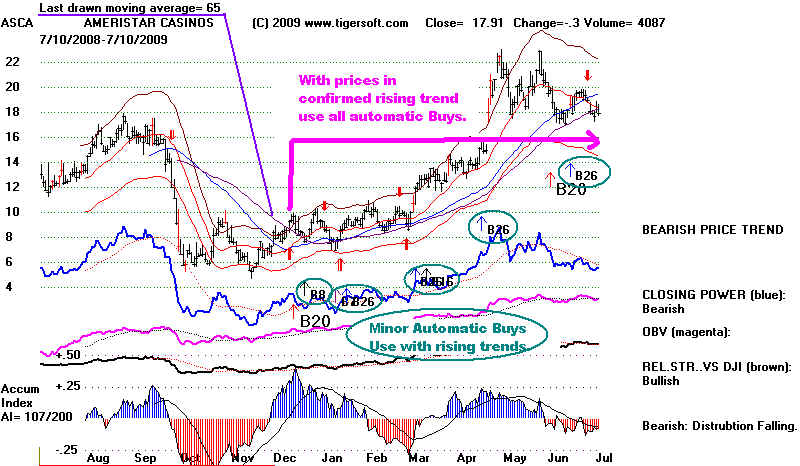
Minor Buys Also Make Good Entry Points.
As long as prices are above the key moving averages with confirming
positive Accumulation and a rising Closing Power, we also use TigerSoft's
automatic minor Buys. These are fixed-rule signals, too. There are 33 such
Buys signals. Each is carefully defined and has been back-tested extensively.
Major and Minor Sells
When a stock closes back below the key intermediate-term moving
averages with confirming weakness form TigerSoft's Accumulation Index
and Closing Power, we take profits and also look for new fixed rule
and automatic TigerSoft Sell signals to sell short if the stock shows
unusual internal strength weakness and insider selling, as defined by
TigerSoft's Accumulation index. These Sells are used to sell short.
There are 37 different TigerSoft sells. Each is defined and discussed
in our software's Help routines. Automatic Stochastic Buys can be
used to cover. But in very weak, heavily distributed stocks, we recommend
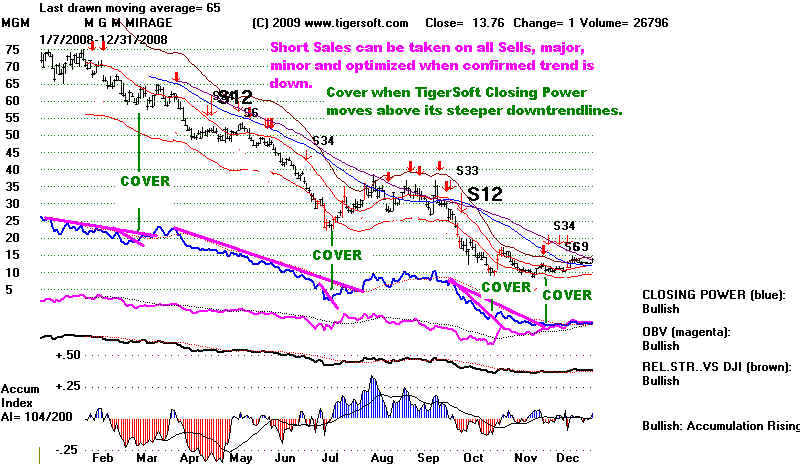
using breaks in steeply declining Closing Power downtrends.
When a stock crosses below these moving averages, we use the
automatic fixed rule major SELL signals to spot the best stocks to sell
short.
We then use breaks in the downtrending Closing Power to cover
these short sales.
Stocks are sometimes in trading ranges. In these cases, they may
whipsaw a trader using only 50- and 65-day moving averages. Such action
is reduced by also requiring moves beyond these moving averages to be
confirmed by readings from the TigerSoft Accumulation Index and Closing
Power. Even so, be on the alert for stocks stuck in trading ranges, where
the stock has not made new 3-month lows and new highs. In these cases, the
optimimum trading system is often a Stochastic and the slope of a least
squares line for this period is nearly flat. Trading ranges often occur after big
advances and big declines. The former are often periods of distribution and
the latter are periods of accumulation. Watching the internal strength
indicators will help you decide if they are hesitations before reversals of
price or hesitations before more movement up or down.
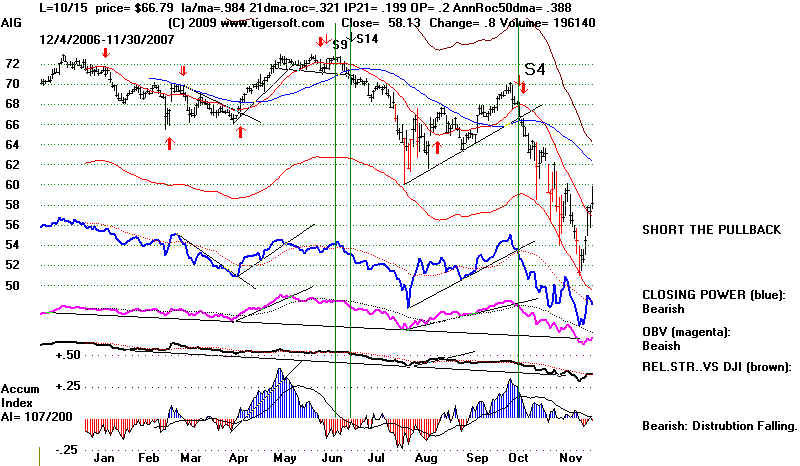
AIG's 2007 TOP
Weakening Choppiness and Rising Down-Side Volume
AIG topped out after repeatedly being unable to get past 73. The Accumulation
Index turned negative where the Sell S9 is seen in the chart below. Prices in
that price area can be considered to have formed a bearish head and shoulders
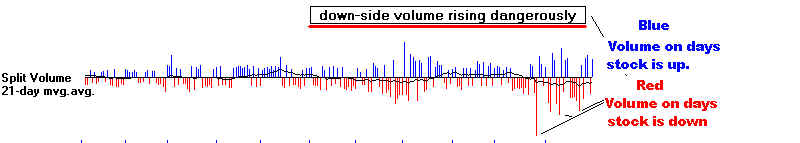
pattern. The big tip-off that this stock was in trouble were the very heavy colume
down days in November. The blue Accumulation did not give a warning here.
Too many institutions still felt this Dow Jones "blue chip" was cheat at 60.
Place TigerSoft Signals on the screen using Signals(1) + + Major Sells
S9 - IP21 negative on new high or on repeated test of resistance.
S14 - Big increase in down-day volume
S4 - Close below 30-week ms.
AIG - 2007
Closing Power trend-breaks proved effective ways to catch the stock's swings.
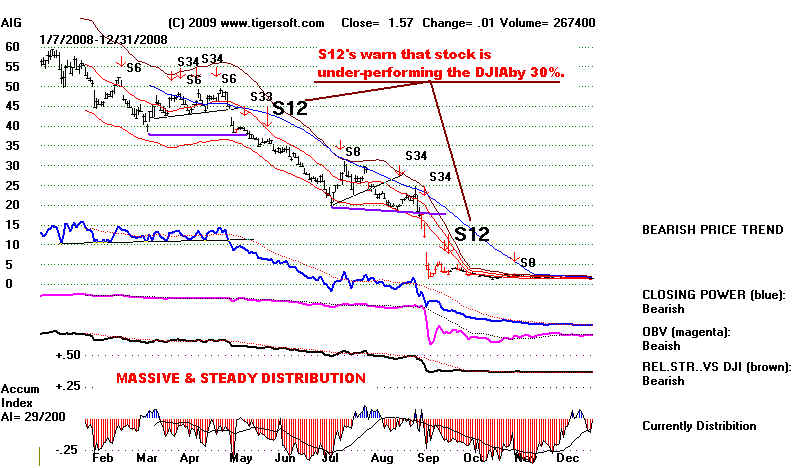
AIG's 2008 - MASSIVE PROFESSIONAL SELLING
When a high-capitialization stock shows as much red distribution as
AIG did in early and mid 2008 AND the stock also repeatedly fails to get
back above its declining blue day ma, the company is in big trouble.
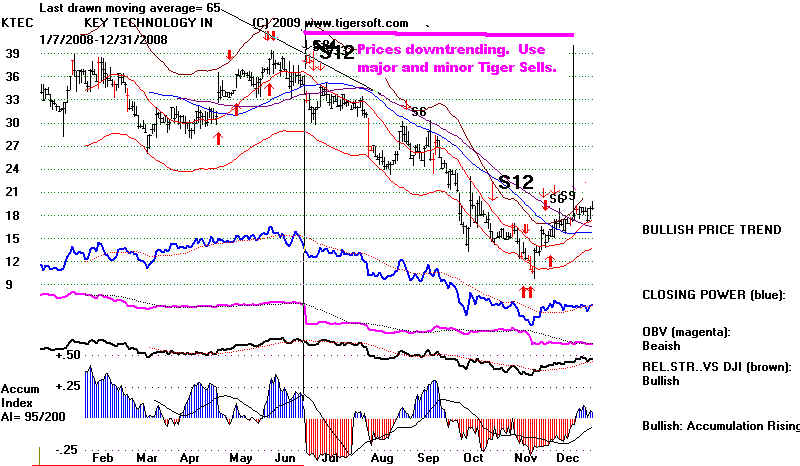
Short selling on down-arrows based on minor rallies, like S6, is usually
quite profitable. Also go short on break-downs by the TigerSoft Closing
Power to new lows. Use the Tiger-Power-Ranker to find stocks making
S12s and new 12-month lows. Qualify the stock by requiring heavy
(red) down-day volume, deeply red distribution and a weak Closing
Power Line.